
- Contact Us:
-

-

-

-


Daily Market Updates
13 Mar 2023
USDJPY
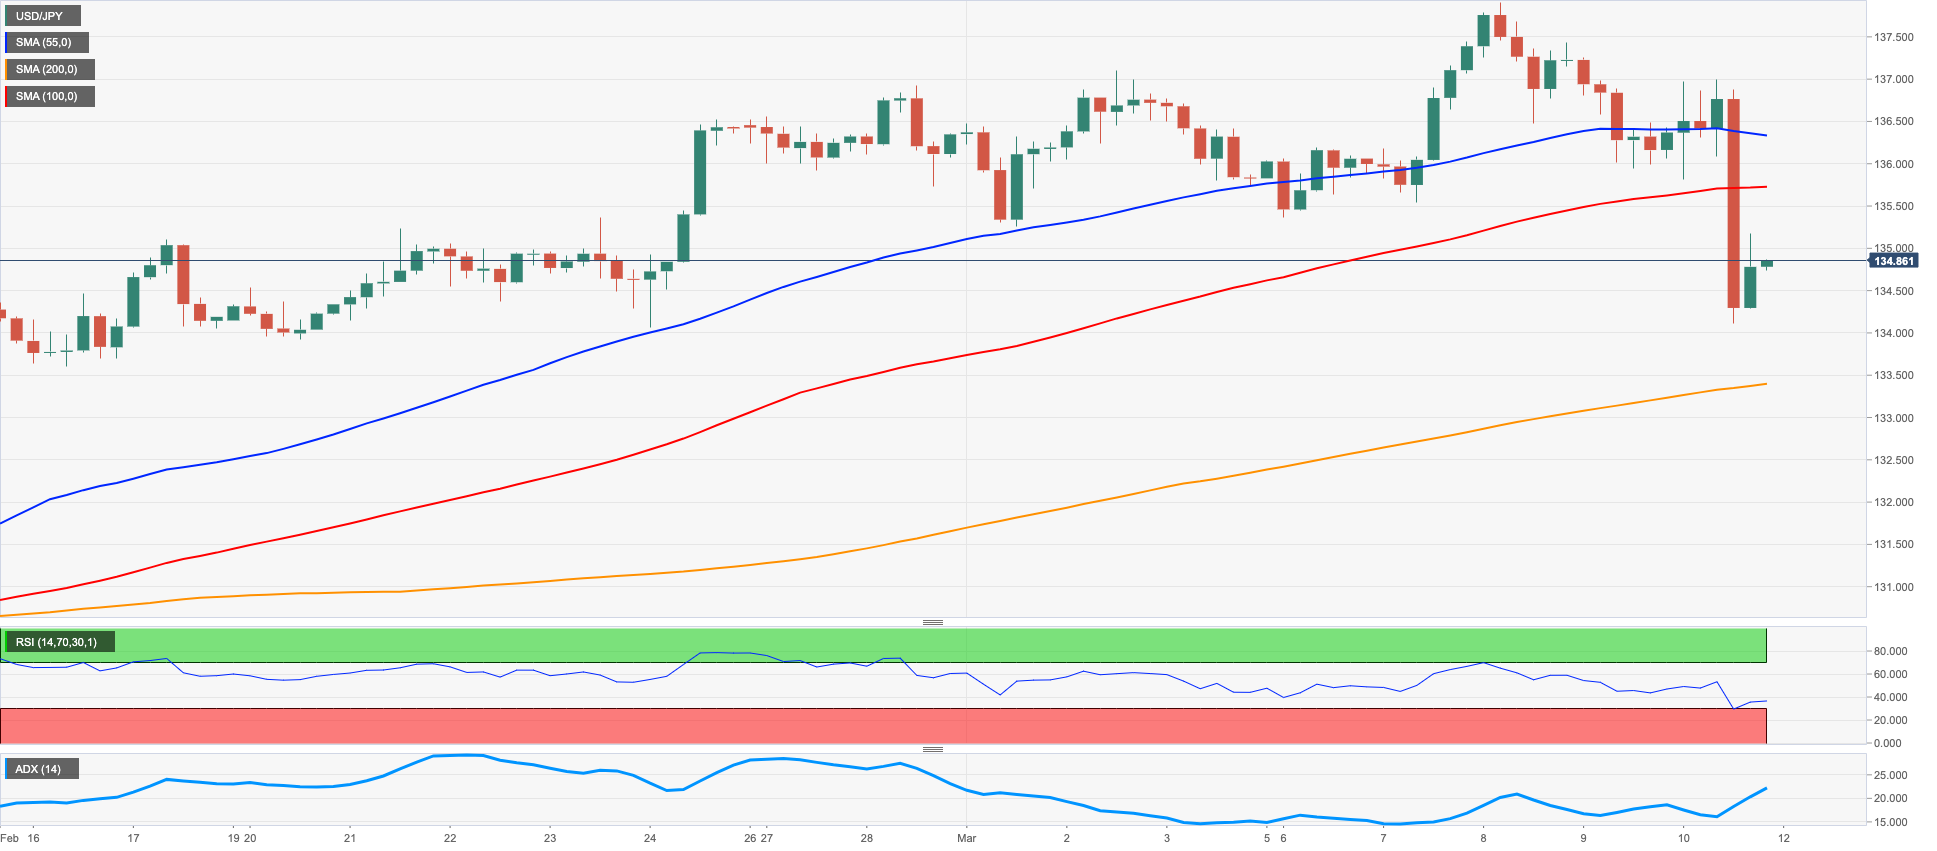
USD/JPY added to Thursday’s retracement and briefly tested the vicinity of the 134.00 region, or 2-week lows, before ending the session just above the 135.00 hurdle.
Extra weakness in spot came in response to the equally acute decline in the dollar and US yields across the curve. As a matter of fact, the pair saw its downside gather impulse following a mixed result from the US Non-farm Payrolls for the month of February.
In Japan, no news at Kuroda’s final BoJ gathering after he reiterated the bank’s readiness to ease further in case of need. In addition, the BoJ matched expectations and kept the policy rate unchanged as well as the YCC, at the time when Kuroda gave an upbeat assessment of the economy and noted that inflation expectations remain on the rise.
The Japanese calendar saw Household Spending contract 0.3% in the year to January, while Producer Prices dropped 0.4% MoM in February and rose 8.2% from a year earlier.
Next on the downside for USD/JPY appears the March low at 134.10 (March 10) seconded by the interim 55-day SMA at 132.44 and the weekly low at 129.79 (February 10). The breach of the latter could put the February low at 128.08 (February 2) to the test before the 2023 low at 127.21 (January 16). On the contrary, the breakout of the key 200-day SMA at 137.46 should give way to a probable test of the 2023 top at 137.91 (March 8) followed by weekly peaks at 138.17 (December 15 2022) and 139.89 (November 30 2022), all ahead of the key round level at 140.00 and the weekly peak at 142.25 (November 21 2022). The daily RSI debilitated to the proximity of the 53 zone.
Resistance levels: 137.91 138.17 139.89 (4H chart)
Support levels: 134.10 132.44 129.79 (4H chart)
GBPUSD
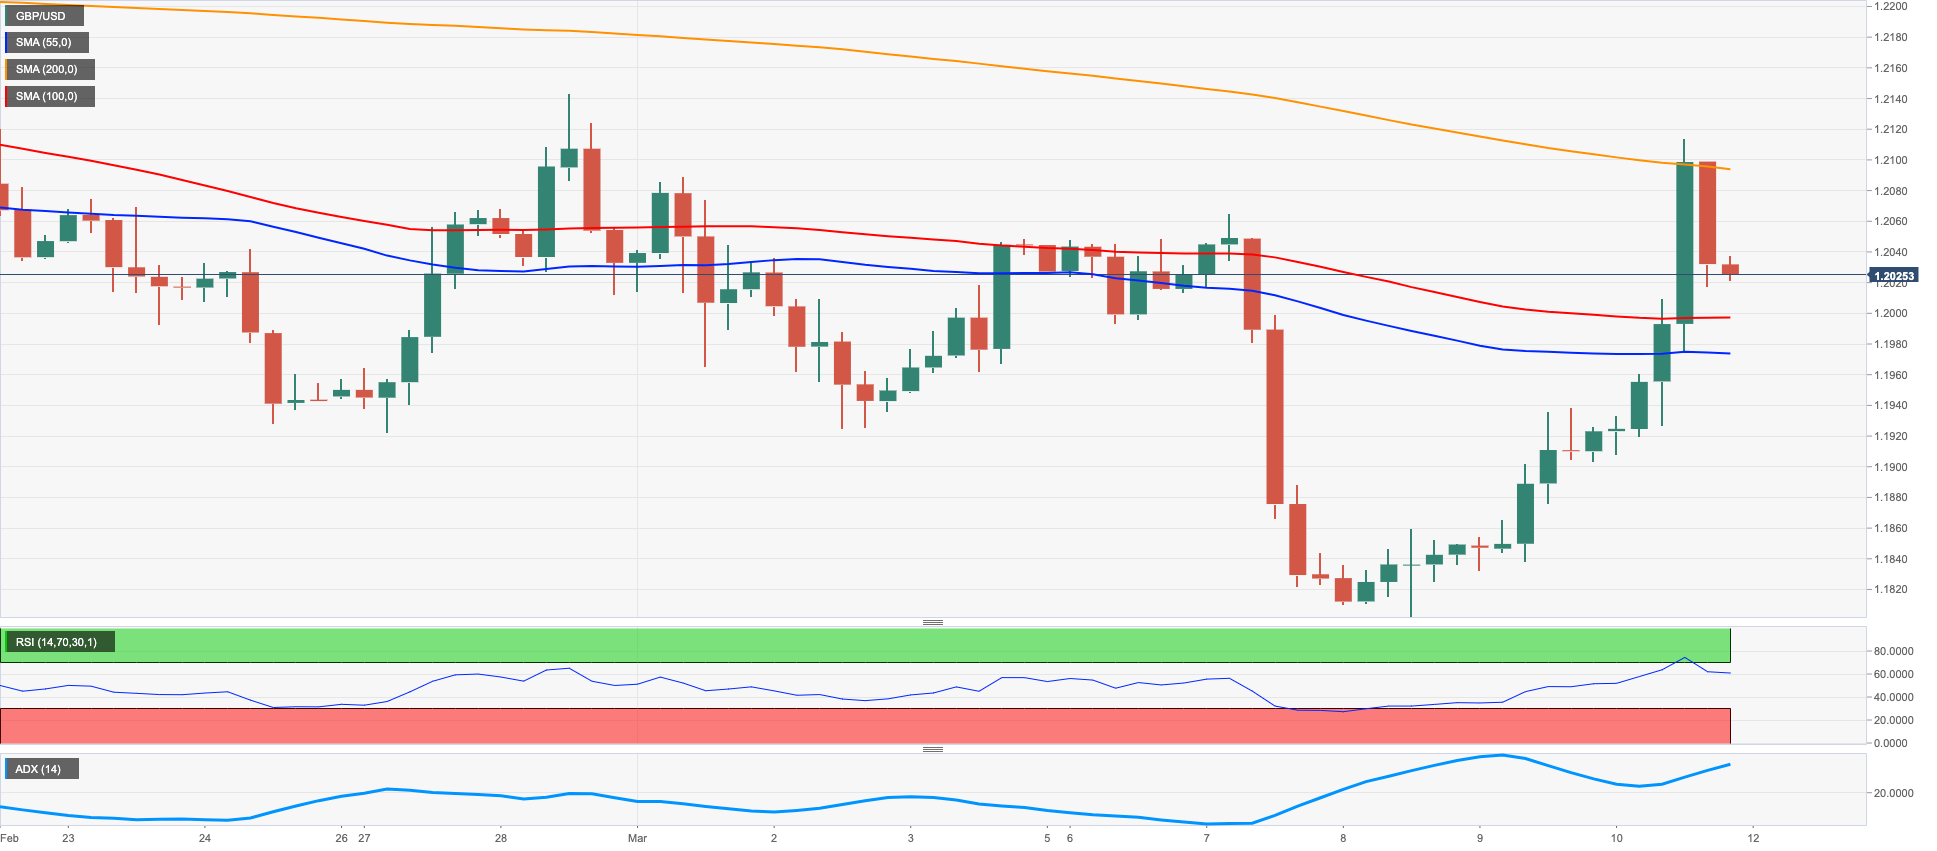
GBP/USD advanced strongly for the third consecutive session and fully reversed Tuesday’s sharp Powell-induced sell-off to the 1.1800 neighbourhood, surpassing the 1.2100 mark and flirting with the 55-day SMA near 1.2120.
In fact, Cable intensified the bounce and reclaimed the area above 1.2100 the figure in response to the pronounced retracement in the dollar, particularly soon after the publication of the jobs report for the month of February, where the US economy created more jobs than estimated and the jobless rate unexpectedly edged higher.
The UK docket showed mixed results after the GDP 3-Month Avg came in flat in January and over the last twelve months, while the GDP expanded 0.3% MoM also in January. Further results in January saw the trade deficit shrink to £17.855B, Industrial Production contract 4.3% YoY and Manufacturing Production drop 5.2% from a year earlier.
The improvement in the Sterling came in contrast to the marked drop in the 10-year Gilt yields, which eased to the 3.60% zone amidst the broad-based corrective move in the rest of the global money markets.
Further gains in GBP/USD appear likely for the time being. That said, the breakout of the provisional 55-day SMA at 1.2118 should spark a potential visit to the weekly high at 1.2147 (February 21) prior to another weekly top at 1.2269 (February 14) and the 2023 peak at 1.2447 (January 23). Just the opposite, while the immediate contention emerges at the 2023 low at 1.1802 (March 8), a breach of this level should see no support of significance until the November 2022 low at 1.1142 (November 4). The daily RSI advanced further and flirted with the 50 region.
Resistance levels: 1.2113 1.2143 1.2269 (4H chart)
Support levels: 1.1907 1.1802 1.1762 (4H chart)
AUDUSD
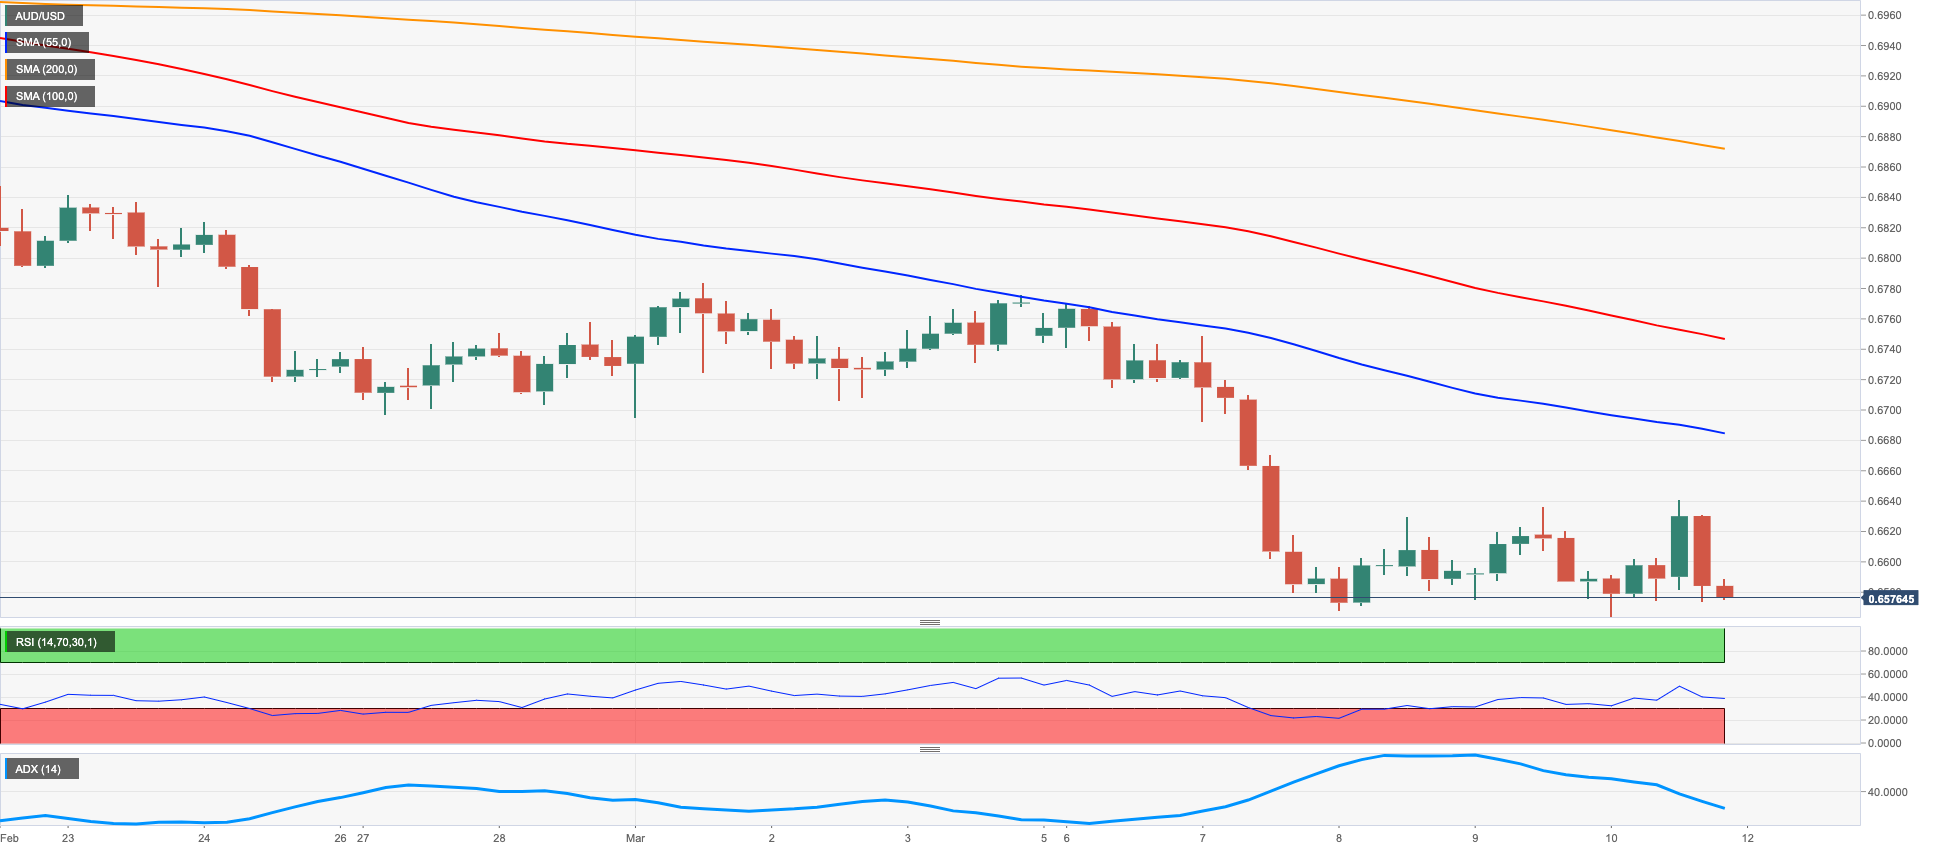
AUD/USD reversed two consecutive daily advances and closed below the 0.6600 mark for the fourth straight session on Friday.
Unlike the rest of the risk-linked assets, the Aussie dollar could not take any advantage from the exacerbated weakness around the greenback, while the generalized bearish performance in the commodity complex also added to the gloomy mood around the currency.
In fact, AUD remained mostly side-lined in the lower end of the weekly range and unable to stage a meaningful bullish attempt following Tuesday’s severe retracement in response to the dovish hike by the RBA.
There were no data releases in Oz on Friday.
AUD/USD clinched a fresh 2023 low at 0.6563 on March 10. If the pair breaches this level it could then confront the weekly low at 0.6386 (November 10 2022) ahead of the November 2022 low at 0.6272 (November 3). The other way around, the key 200-day SMA at 0.6775 is expected to emerge as the initial resistance preceding the weekly top at 0.6783 (March 1) and the provisional 55-day SMA at 0.6870. The trespass of this region could put a test of the weekly peak at 0.6920 (February 20) back on the radar prior to the key round level at 0.7000 and another weekly high at 0.7029 (February 14). The daily RSI remained in the oversold territory below 30.
Resistance levels: 0.6640 0.6685 0.6754 (4H chart)
Support levels: 0.6563 0.6386 0.6271 (4H chart)
GOLD
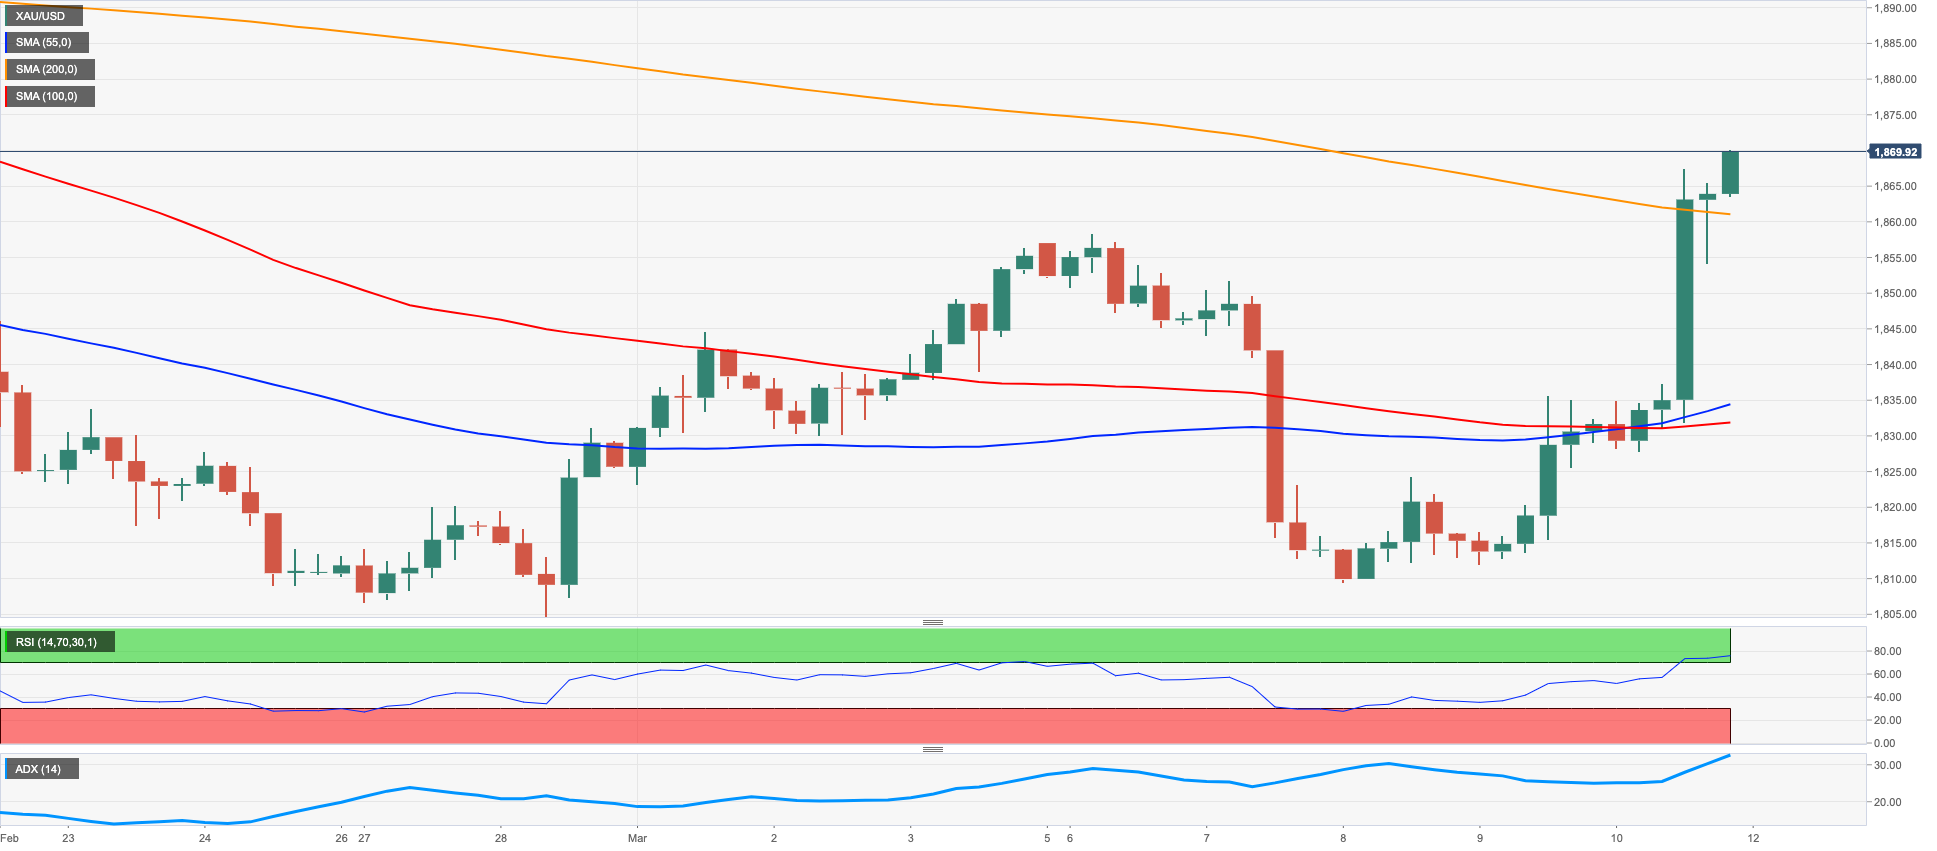
Gold prices extended the needle-like recovery so far this week and closed in new 3-week tops around $1870 per ounce troy on Friday.
Another sharp retracement in the greenback lent extra wings to the weekly recovery in the precious metal, while the sharp loss of momentum in US yields across the curve added to the improved buying bias in bullion.
The upside in the yellow metal derived further strength after investors scaled back their expectations of a 50 bps rate hike in favour of a 25 bps raise by the Federal Reserve at the March 22 event, all following the mixed prints from the US jobs report in February.
Immediately to the upside for gold now emerges the weekly peak at $1890 (February 9) prior to the 2023 high at $1959 (February 2) and the April 2022 top at $1998 (April 18), all closely followed by the psychological $2000 mark per ounce. On the opposite side, there is a minor support at the March low at $1809 (March 8) just ahead of the 2023 low at $1804 (February 28), all prior to the key $1800 region. Once this area is cleared, the metal could slip back to the 200-day SMA at $1775 before the weekly low at $1727 (November 23) and the November 2022 low at $1616 (November 3).
Resistance levels: $1870 $1890 $1918 (4H chart)
Support levels: $1827 $1804 $1784 (4H chart)
CRUDE WTI
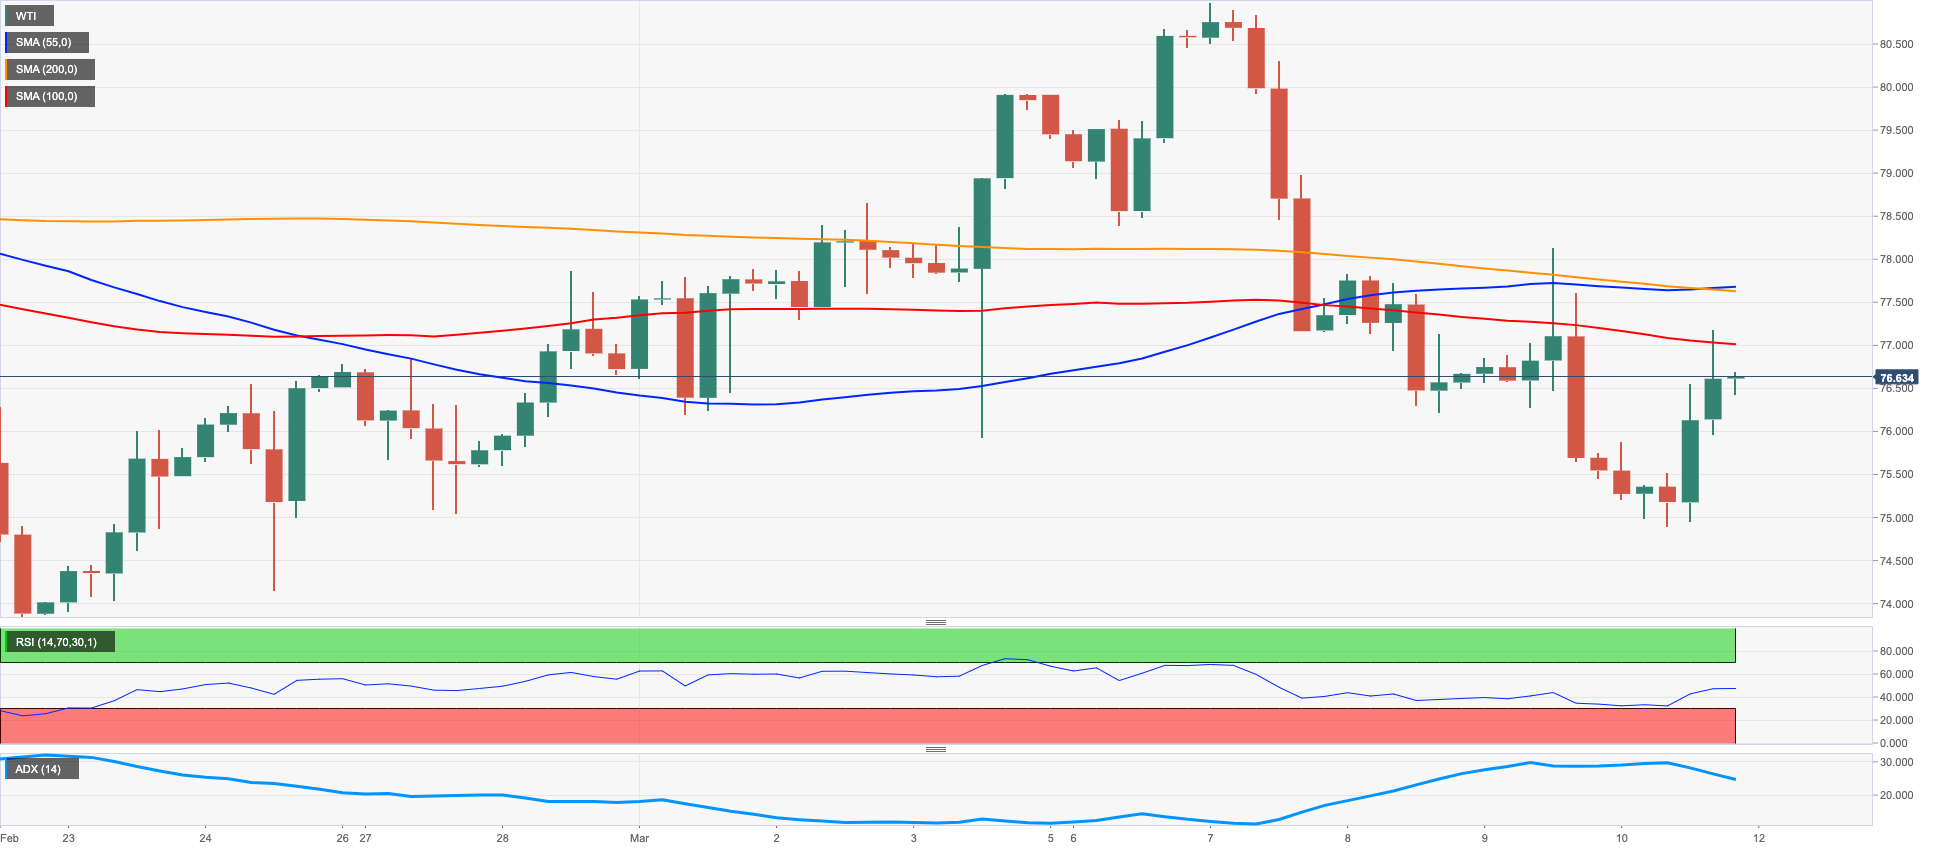
After three consecutive daily pullbacks, prices of the WTI managed to regain some buying interest and closed above the $76.00 mark per barrel after bottoming out in weekly lows near $74.80 on Friday.
The much weaker greenback helped prices of the commodity regain the smile at the end of the week, while the mixed US NFP seems to have mitigated recession concerns somewhat and also collaborated with the corrective uptick.
From the supply side, Iran and Saudi Arabia agreed to resume diplomatic relations, thus ending seven years of persistent effervescence.
In the calendar, driller Baker Hughes said the US total active oil rigs went down by 2 to 590 in the week to March 10.
Consolidation seems to still be the name of the game around crude oil. Against that, the breakdown of the March low at $74.82 (March 10) should rapidly expose a test of the weekly low at $73.83 (February 22) prior to the 2023 low at $72.30 (February 6) and the 2022 low at $70.10 (December 9), just before the key round level at $70.00. By contrast, the 100-day SMA at $79.53 should offer provisional resistance ahead of the March peak at $80.90 (March 7) and the 2023 high at $82.60 (January 23). The surpass of the latter could open the door to the December 2022 top at $83.32 (December 1) ahead of the $90.08 level (November 11 2022) and the November 2022 peak at $93.73 (November 7).
Resistance levels: $77.07 $78.01 $80.90 (4H chart)
Support levels: $74.74 $74.06 $73.77 (4H chart)
GER40
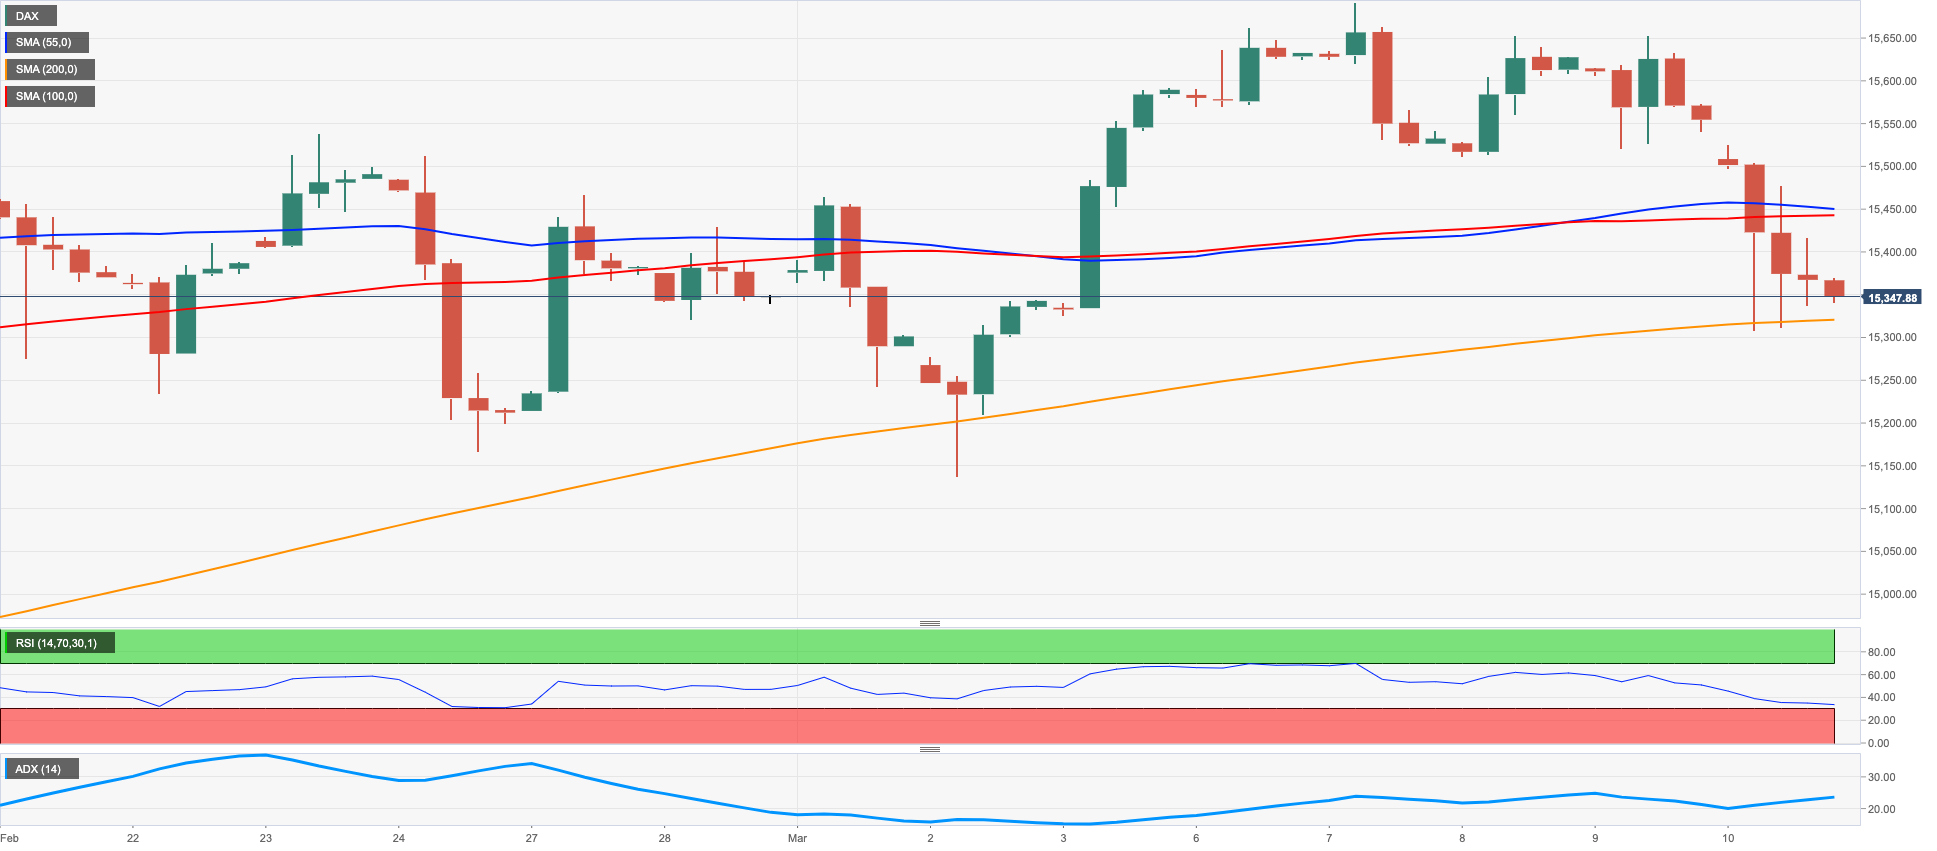
German equities ended the week in red figures and forced the benchmark DAX40 to recede to multi-session lows near the 15300 region on Friday. As a matter of fact, the index could not sustain a bull run to fresh 2023 highs around 15700 recorded earlier in the week, sparking a corrective decline soon afterwards.
Indeed, European markets succumbed to renewed concerns over the likelihood that further tightening by major central banks could trigger an economic slowdown, while the banking sector was also hurt by news around Credit Suisse and SVB.
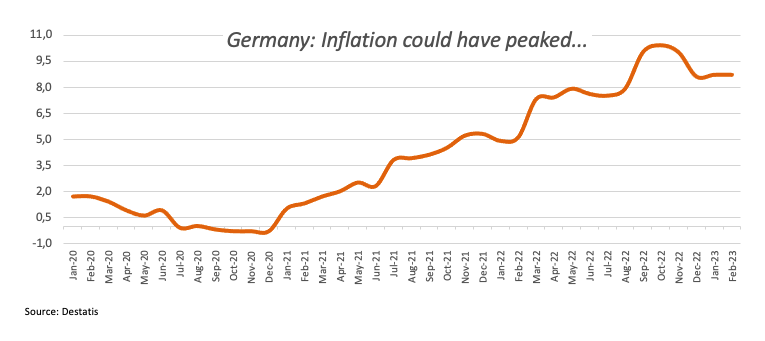
In Germany, final inflation figures for the month of February saw the CPI rising 0.8% MoM and 8.7% over the last twelve months.
In addition, German 10-year Bund yields followed the rest of their peers and dropped to multi-day lows near the 2.40% region.
While the DAX40 appears broadly within a consolidation range, further weakness could prompt the index to revisit the March low at 15150 (March 2) prior to the interim 55-day SMA at 15086 and the weekly low at 14906 (January 19). Down from here turns up the provisional 100-day SMA at 14586 ahead of the key 200-day SMA at 13823. Having said that, the initial up-barrier remains at the 2023 top at 15706 (March 6) before the February 2022 peak at 15736 (February 2 2022). The surpass of this level exposes the round level at 16000 prior to the 2022 peak at 16285 (January 5). The daily RSI surrendered ground and breached 52.
Best Performers: Fresenius Medical Care KGAA ST, Deutsche Boerse, Fresenius se
Worst Performers: Deutsche Bank AG, Daimler Truck Holding, Continental AG
Resistance levels: 15706 15736 15912 (4H chart)
Support levels: 15316 15150 14906 (4H chart)
NASDAQ
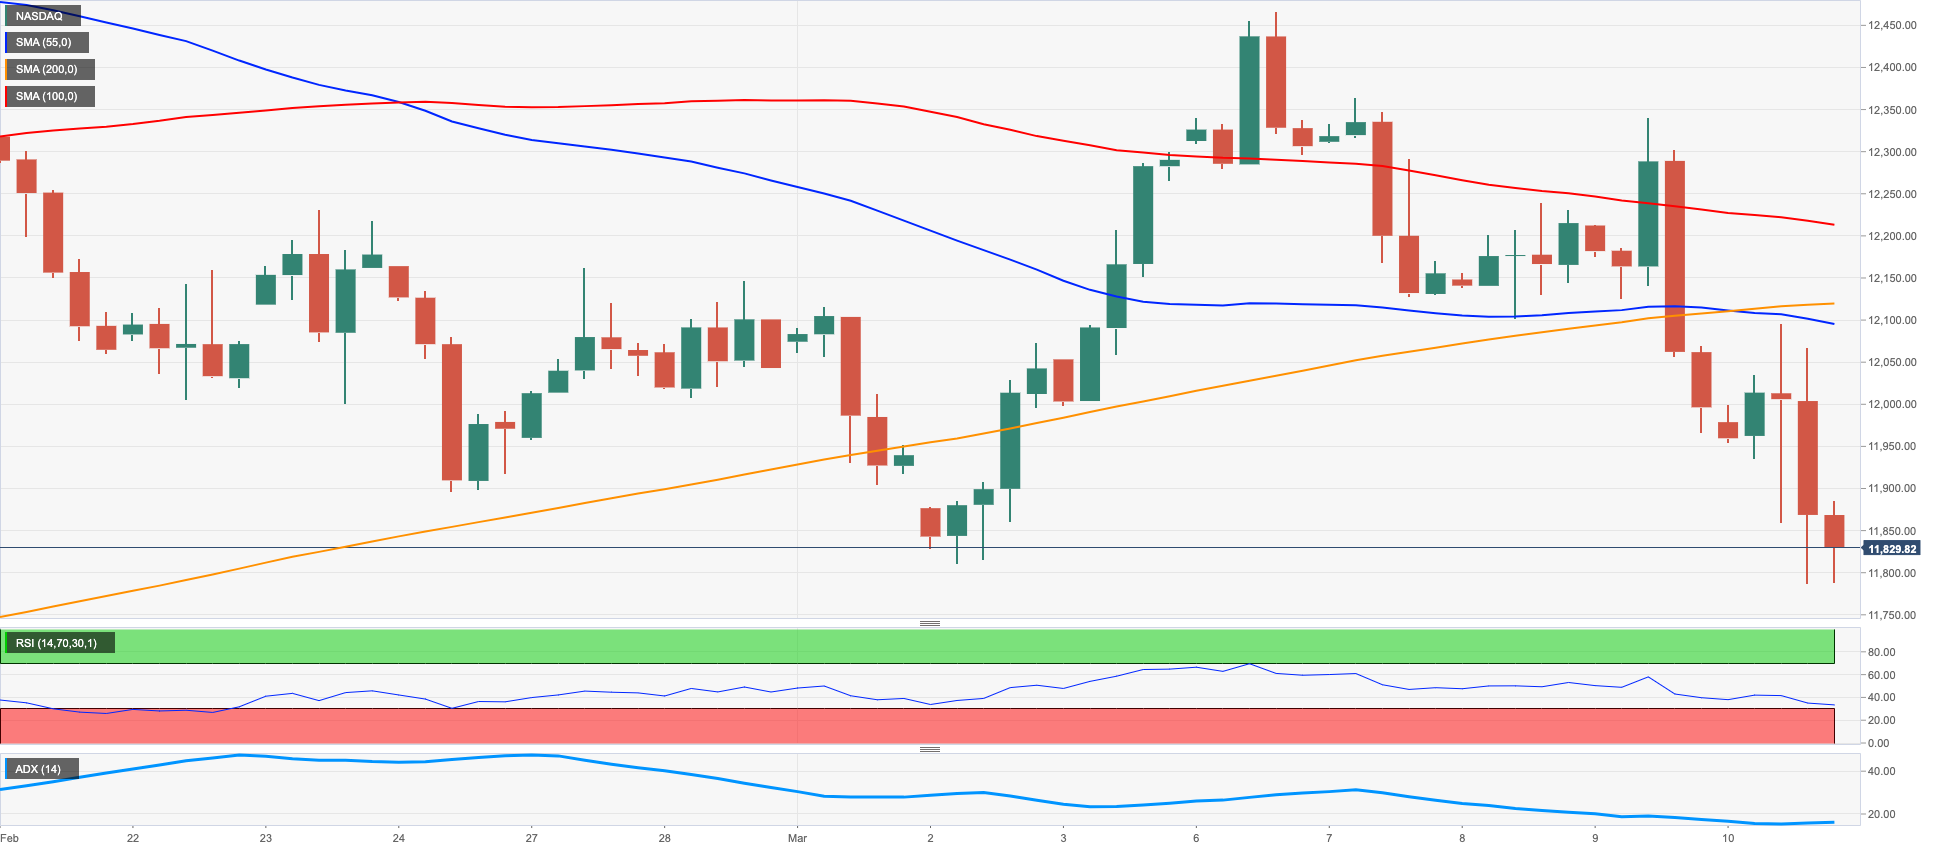
Tech equities gauged by the Nasdaq 100 retreated further and recorded new 2-month lows around the 11800 zone at the end of the week, levels close to the 55-day SMA.
Furthermore, Friday’s downtick saw the tech benchmark trade at shouting distance from the key 200-week SMA, currently at 11702.
Concerns around the US banking sector following SVB news in combination with almost omnipresent jitters around prospects for the continuation of the hiking cycle by the Federal Reserve did the rounds on Friday and kept the mood among investors depressed.
If sellers maintain control of the sentiment, the Nasdaq 100 could drop further and retest the temporary 100-day SMA at 11653 ahead of weekly lows at 11550 (January 25) and 11251 (January 19) prior to the 2023 low at 10696 (January 6) and the December 2022 low at 10671 (December 22). In opposition, the immediate hurdle emerges at the March peak at 12466 (March 6) ahead of the weekly high at 12689 (February 15) and the 2023 top at 12880 (February 2). Once the latter is cleared, the index could prompt the round level at 13000 to emerge on the horizon before the weekly peak at 13175 (August 26 2022). The daily RSI debilitated to the sub-43 region.
Top Gainers: Intel, Amgen, Palo Alto Networks
Top Losers: Atlassian Corp Plc, Datadog, Marvell
Resistance levels: 12466 12689 12880 (4H chart)
Support levels: 11789 11641 11251 (4H chart)
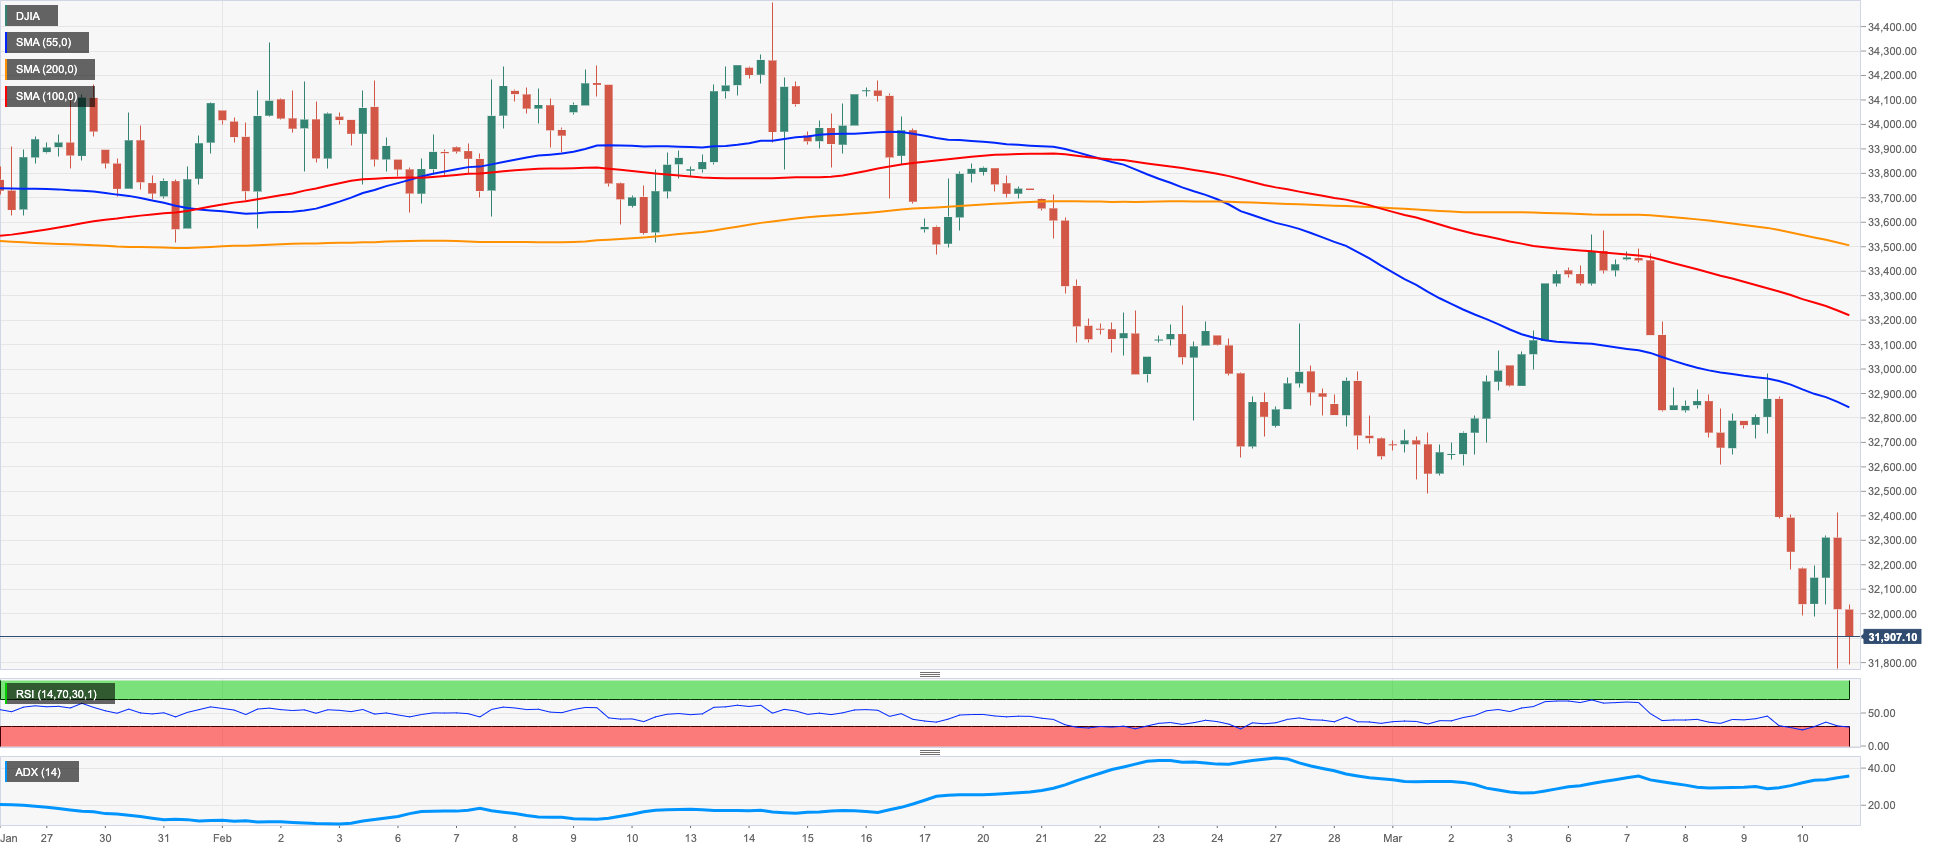
DOW JONES
Another day, another drop in the Dow Jones. This time the stocks’ benchmark broke below the 32000 mark for the first time since early November 2022.
Indeed, and despite fears of a tighter-for-longer stance by the federal Reserve eased somewhat following the US jobs report, investors saw their concerns aggravated after California banking regulators closed SVB Financial Group, a decision that seems to have opened cracks in the sentiment surrounding the health of the banking sector.
Overall, the Dow Jones eased 1.07% to 31909, the S&P500 retreated 1.45% to 3861 and the tech-heavy Nasdaq Composite dropped 1.76% to 11138.
The door now appears open to extra losses for the Dow Jones in case the index breaks below the 2023 low at 31783 (March 10), an area closely followed by the November 2022 low at 31727 (November 3). Further weakness could see the 2022 low at 28660 (October 13) revisited in the not-so-distant future. On the other hand, the key 200-day SMA at 32392 emerges as the initial hurdle prior to the provisional 100- and 55-day SMAs at 33250 and 33448, respectively, followed by the March top at 33572 (March 6) and the 2023 top at 34342 (January 13). The daily RSI approached the oversold territory around 31.
Top Performers: Intel, JPMorgan Travelers
Worst Performers: Caterpillar, Goldman Sachs, American Express
Resistance levels: 32990 33213 33572 (4H chart)
Support levels: 31783 31727 28660 (4H chart)
MACROECONOMIC EVENTS

All Information & Updates provided by:

All information relating to the financial markets available on this page has been prepared and issued by FXStreet (Forexstreet SL, Spain, Reg: B62498233) on the basis of publicly available information and all information believed to be reliable and does not conflict with Kuwaiti local laws, and all necessary care has been taken to before the company to ensure that the facts mentioned are correct from the source.
NCM Investment nor any of its directors or employees shall in any way be held responsible for the contents of this news, and the information contained on this page is intended only to provide clients with publicly available information and should not be construed as investment advice, report or analysis and/or constitute an offer or invitation to buy or sell financial instruments of any kind.
RISK WARNING: Forex and CFDs are highly risky leveraged products, as losses can exceed deposits. Please ensure you understand all the risks and take independent advice if necessary. NCM will segregate the clients based on the criteria of the regulator and its bylaws. NCM does not provide any advisory service; the material published does not constitute advice or a recommendation for a transaction in any financial instrument. NCM accepts no responsibility for any use of the content presented and any consequences of that use. Anyone acting on the information provided does so at their own risk.