
- Contact Us:
-

-

-

-


Daily Market Updates
14 Mar 2023
USDJPY
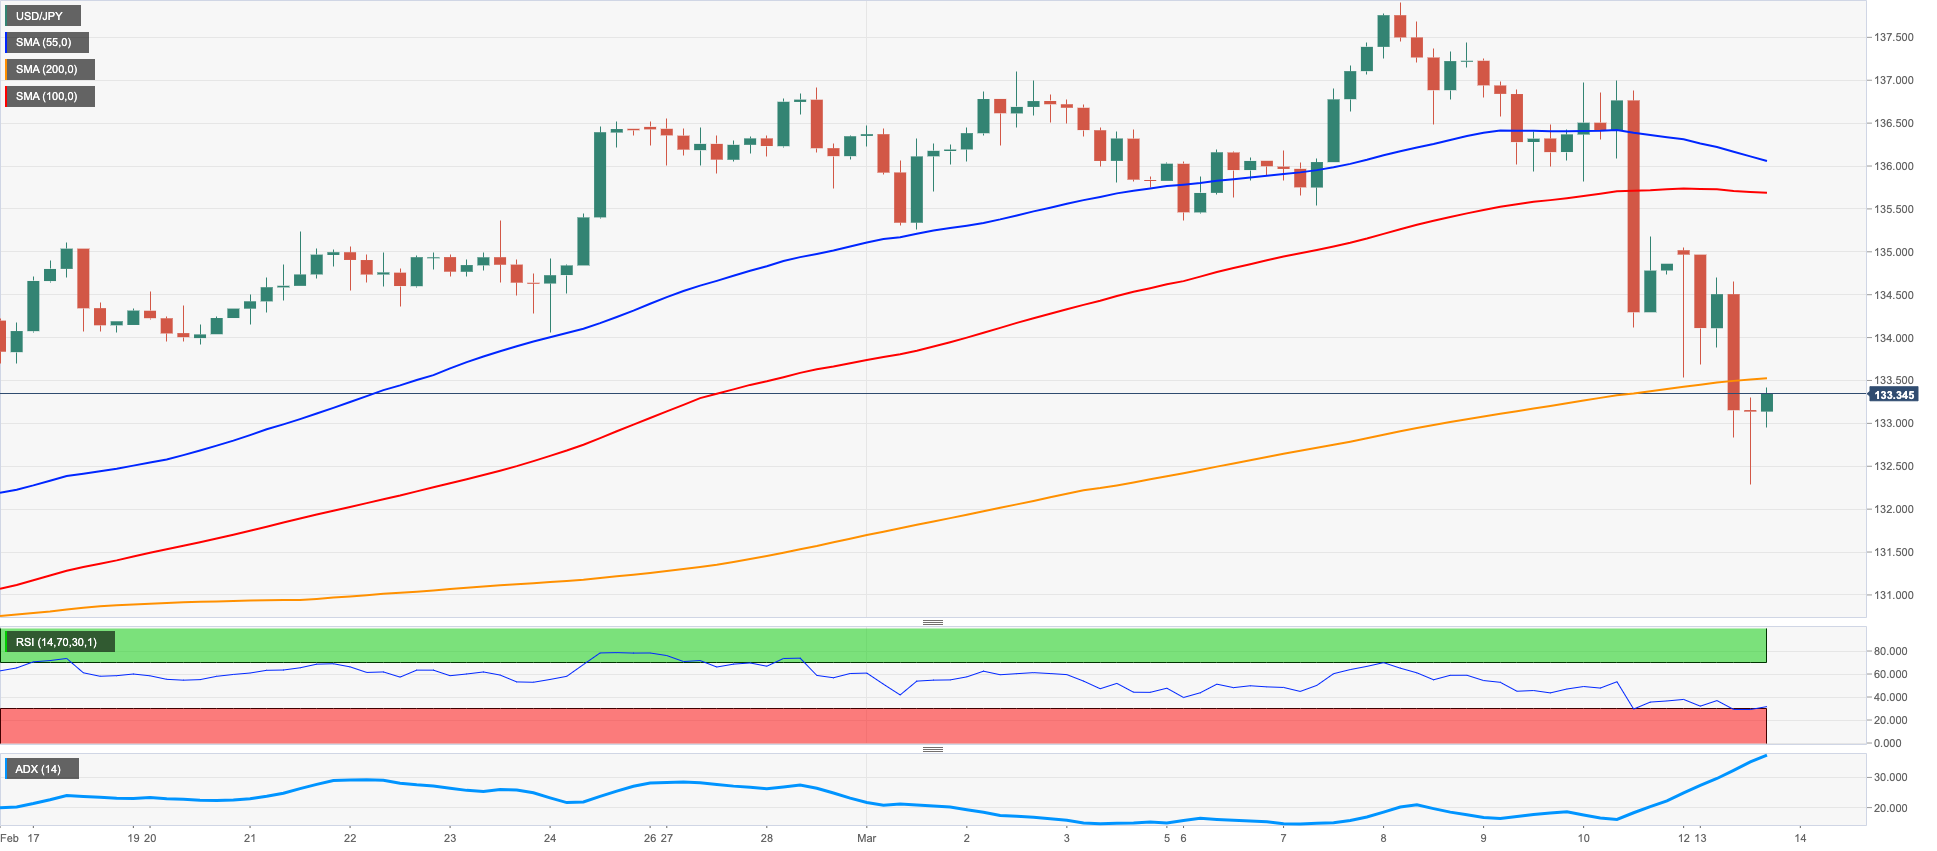
USD/JPY plummeted to new 4-week lows and revisited the 132.30/25 band in quite an ominous start of the week. The fresh monthly low also coincides with the temporary 55-day SMA.
The pronounced move lower in the pair came in response to the equally acute retracement in the greenback, while a strong decline also forced US yields to retreat to multi-week lows across the curve.
The Japanese money market, in the same line, showed the JGB 10-year yields debilitate to the 0.30% region, an area last seen back in later December 2022.
In the Japanese calendar, the BSI Large Manufacturing contracted 10.5% QoQ in the January-March period, in what was the sole release on Monday.
USD/JPY clocked a new monthly low at 132.27 (March 13). The loss of this level could open the door to a probable visit to the key 130.00 mark prior to the weekly low at 129.79 (February 10) and the February low at 128.08 (February 2), all followed by the 2023 low at 127.21 (January 16). Just the opposite, if the pair surpasses the key 200-day SMA at 137.47, it could then rapidly dispute the 2023 peak at 137.91 (March 8) ahead of weekly highs at 138.17 (December 15 2022) and 139.89 (November 30 2022) before the key round level at 140.00 and the weekly top at 142.25 (November 21 2022). The daily RSI deflated to the vicinity of 44.
Resistance levels: 136.09 137.91 138.17 (4H chart)
Support levels: 132.27 129.79 128.08 (4H chart)
GBPUSD
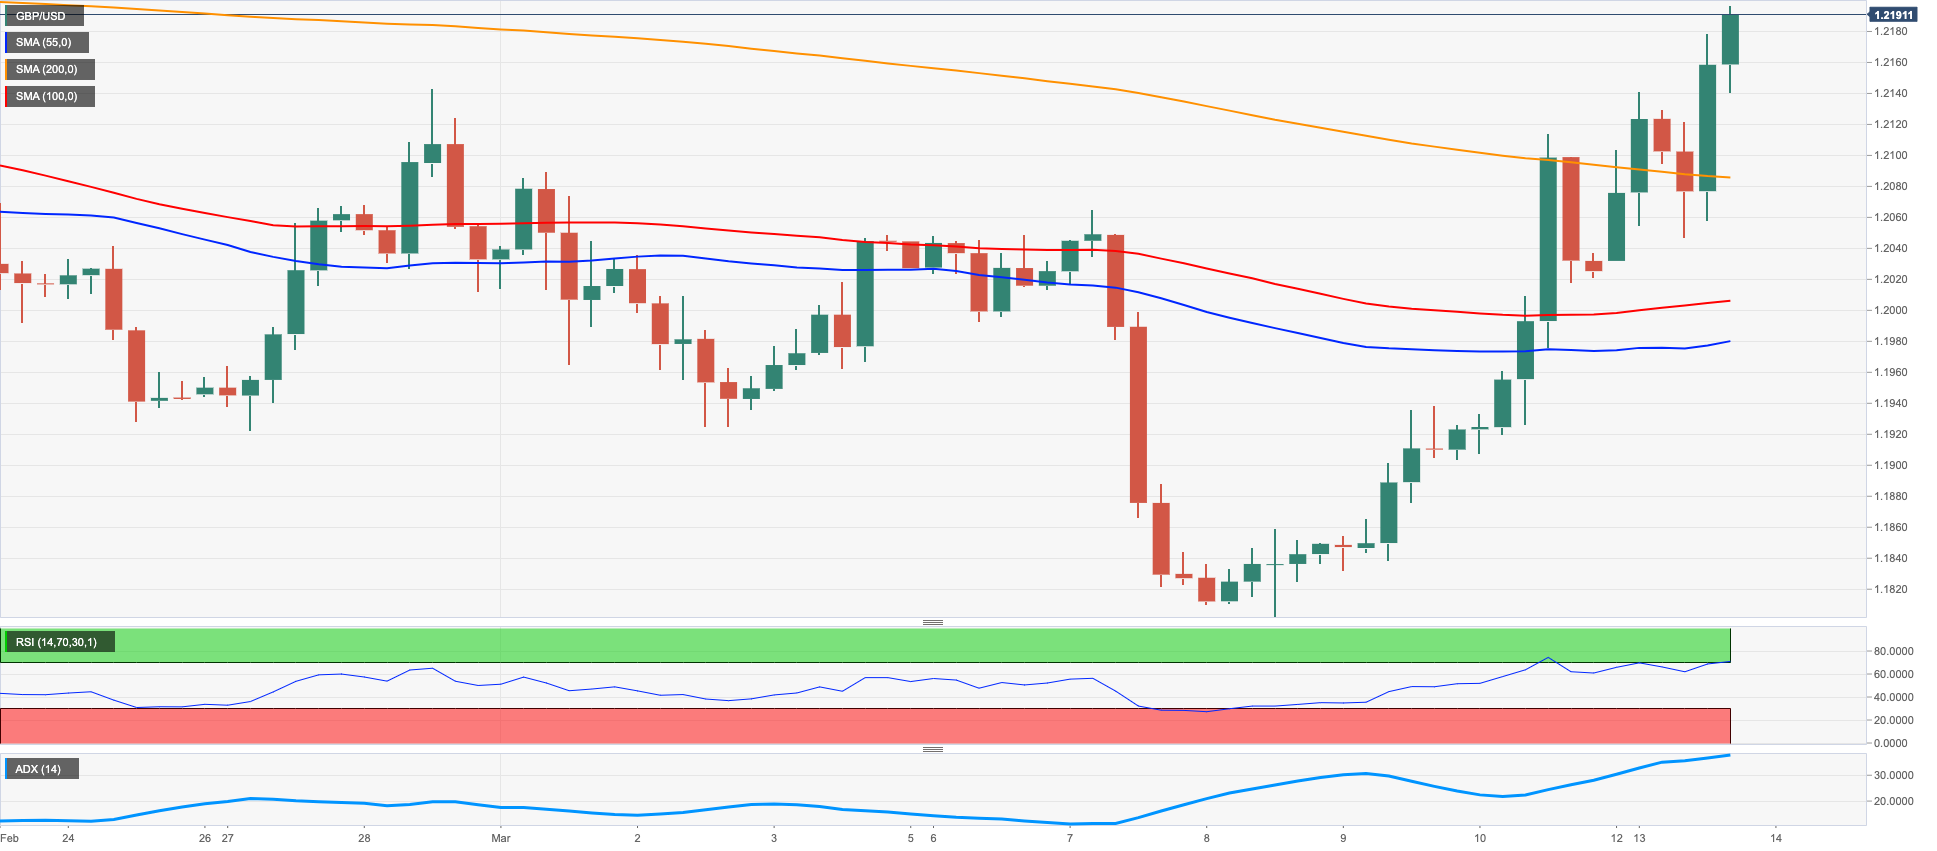
GBP/USD extended the sharp rebound and traded with gains for the fourth straight session on Monday, this time managing to (flirt with the 1.2200 mark, up nearly 4 cents since last week’s 2023 low near 1.1800 (March 8).
Fresh concerns in the banking sector following the SVB crisis coupled with mixed results from February’s Payrolls underpinned the intense downside momentum in the greenback and sponsored the drop to multi-week lows in the USD Index (DXY).
There were no data releases in the UK at the beginning of the week, leaving the bulk of the attention to Tuesday’s publication of the labour market report and the 10-year Gilt Auction.
Next on the upside for GBP/USD appears the weekly peak at 1.2269 (February 14) before the 2023 high at 1.2447 (January 23). Further north, bulls should meet the next opposition at the May 2022 top at 1.2666 (May 27) prior to the 200-week SMA at 1.2873 and the psychological 1.3000 barrier. On the flip side, the 200-day SMA at 1.1896 should offer decent support prior to the 2023 low at 1.1802 (March 8) and the November 2022 low at 1.1142 (November 4). The daily RSI improved to the boundaries of the 58 level.
Resistance levels: 1.2199 1.2269 1.2401 (4H chart)
Support levels: 1.2045 1.1977 1.1802 (4H chart)
AUDUSD
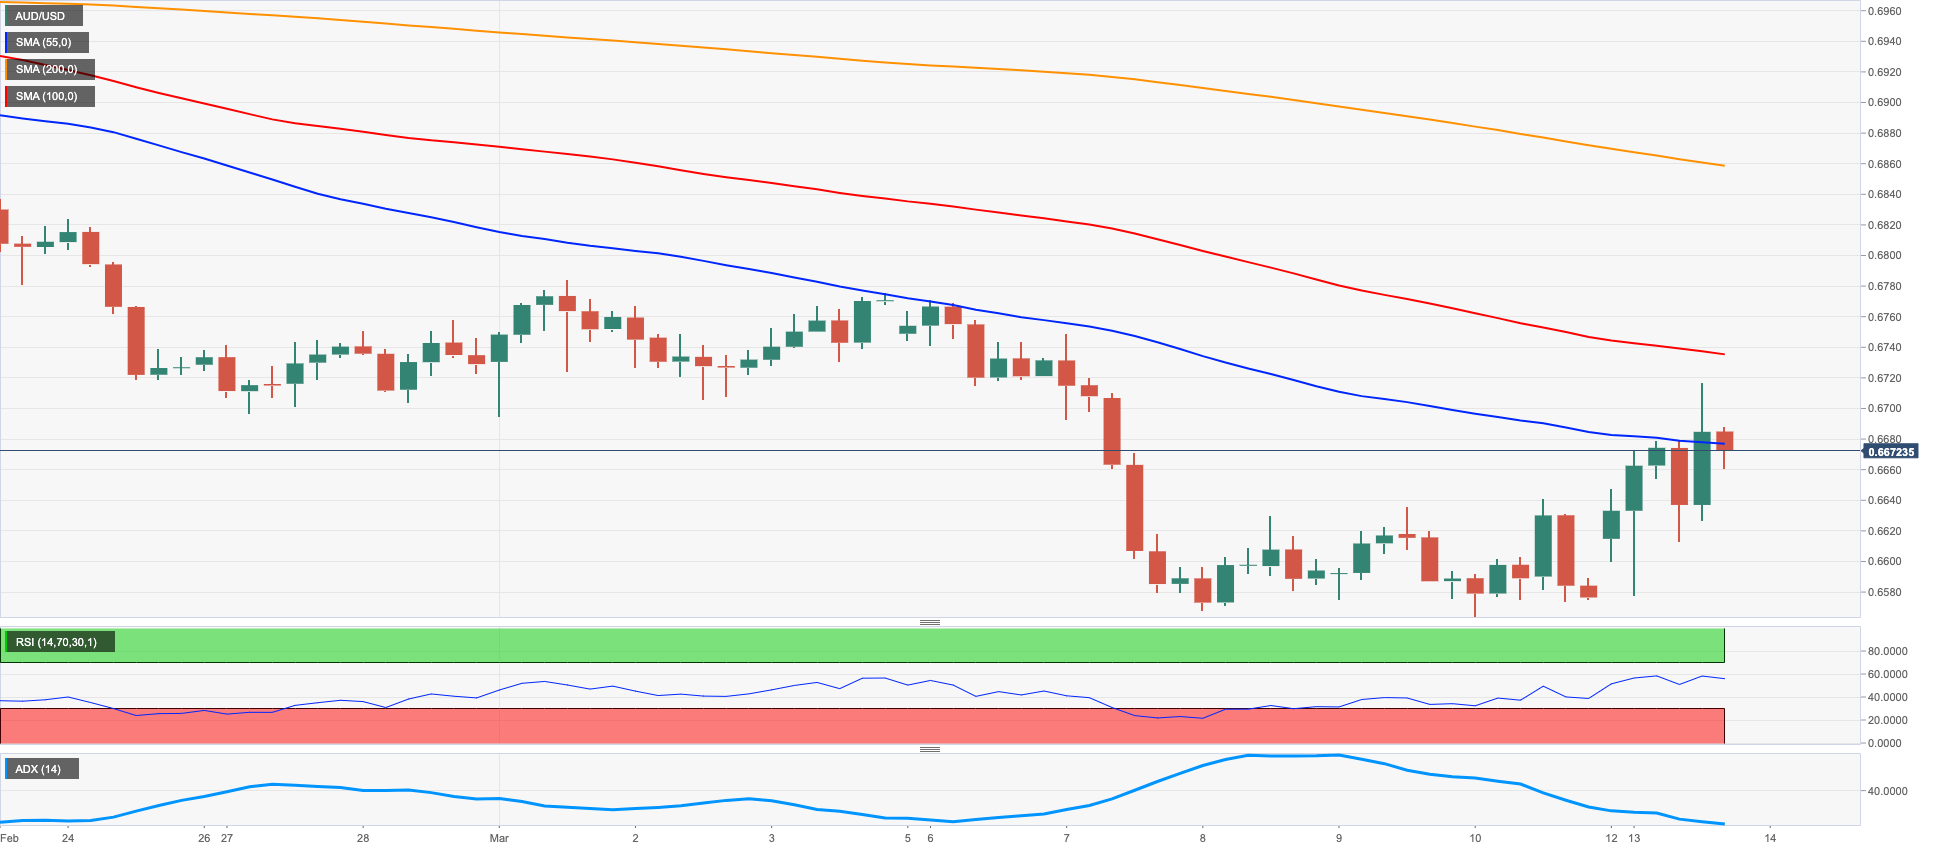
The generalized upbeat mood in the risk complex against the backdrop of the steep pullback in the greenback across the board sponsored the move to multi-day highs past 0.6700 the figure in AUD/USD on Monday.
Also bolstering the upside bias in the Aussie dollar appeared the rebound in copper prices, while the iron ore receded marginally amidst the broad-based firmer sentiment in the commodity galaxy.
The Australian docket was empty at the beginning of the week, whereas the Consumer Confidence gauged by the Westpac will be in the limelight on Tuesday along with the NAB Business Confidence.
Immediately to the upside for AUD/USD now emerges the so far weekly top at 0.6716 (March 13) ahead of the key 200-day SMA at 0.6772, which remains closely followed by another weekly peak at 0.6783 (March 1) ahead of the interim 55-day SMA at 0.6869. Up from here aligns the weekly high at 0.6920 (February 20) seconded by the key round level at 0.7000 and another weekly top at 0.7029 (February 14). On the contrary, the 2023 low at 0.6563 (March 10) should hold the initial test before the weekly low at 0.6386 (November 10 2022) and the November 2022 low at 0.6272 (November 3). The daily RSI bounced past the 41 zone.
Resistance levels: 0.6716 0.6774 0.6868 (4H chart)
Support levels: 0.6563 0.6386 0.6271 (4H chart)
GOLD
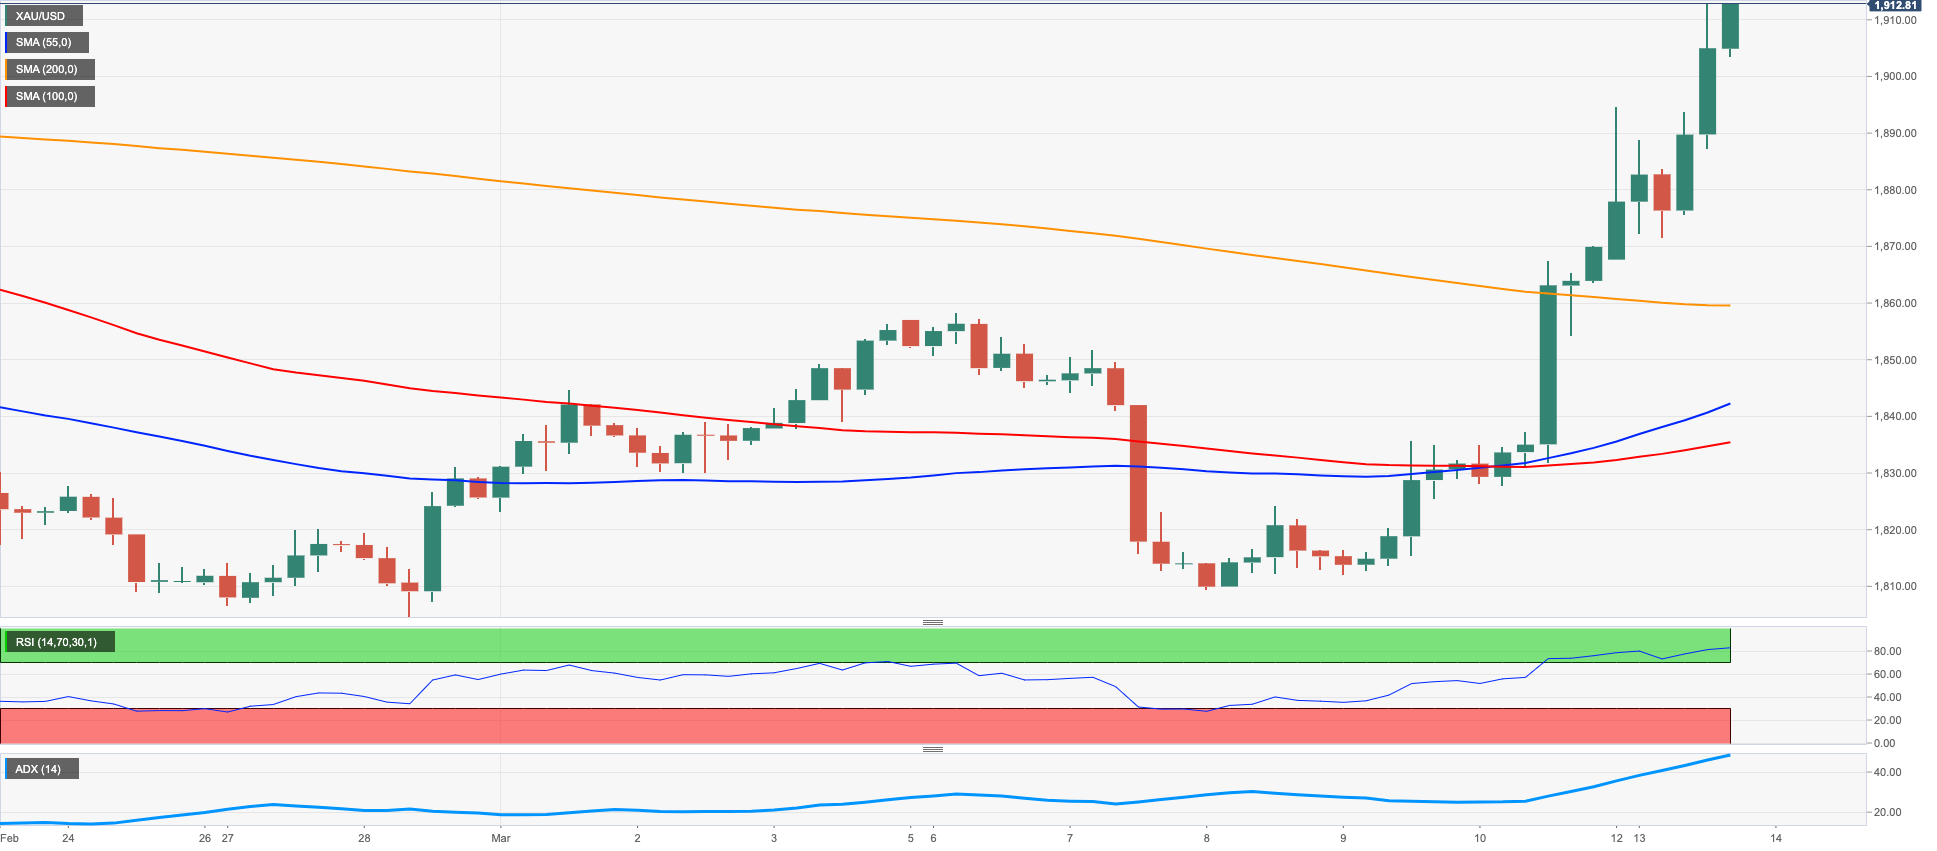
Prices of the ounce troy of gold started the week on a strong foot and surpassed the key $1900 mark for the first time since early February.
The razor-sharp decline in the greenback coupled with collapsing US yields across the curve and the generalized risk-off mood fueled by the SVB crisis all sponsored the advance to 6-week highs in the precious metal at the beginning of the week.
Bullion also derived further support from rising speculation that the Federal Reserve might pause its hiking cycle at the March event in a way to assess the jitters coming from the US banking sector.
The continuation of the strong rebound in gold now targets the 2023 top at $1959 (February 2) followed by the April 2022 peak at $1998 (April 18) and the psychological $2000 mark per ounce. The other way around, the minor support at the March low at $1809 (March 8) precedes the 2023 low at $1804 (February 28) ahead of the key $1800 region. The breach of this key region could leave the yellow metal vulnerable to a deeper drop to the 200-day SMA at $1775 prior to the weekly low at $1727 (November 23) and the November 2022 low at $1616 (November 3).
Resistance levels: $1913 $1959 $1998 (4H chart)
Support levels: $1862 $1841 $1809 (4H chart)
CRUDE WTI
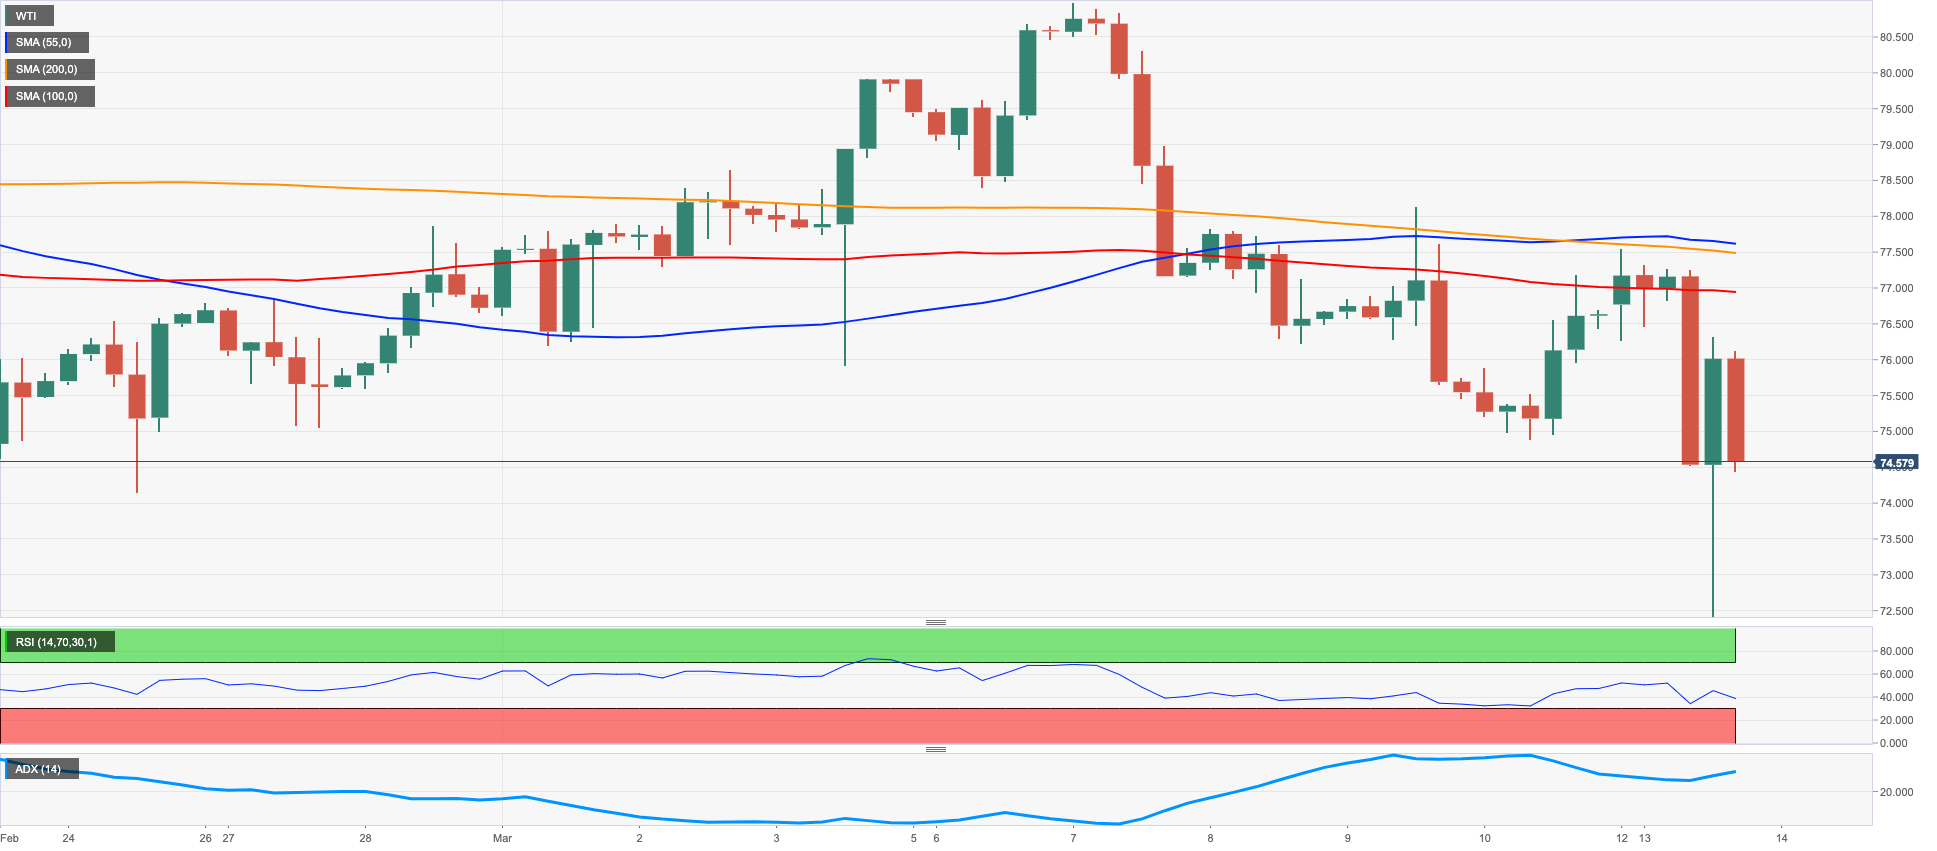
Prices of the barrel of the West Texas Intermediate (WTI) flirted with the area of 3-month lows near $72.30 before staging a marked comeback past the $75.00 yardstick on Monday.
Furthermore, the $72.30 region appears to be quite a firm support for the time being, as it remains propped up by the 200-month SMA ($72.56)
In fact, volatility in crude oil prices picked up pace at the beginning of the week in response to mounting jitters surrounding the US banking system, which in turn seem to have bolstered speculation of a pause in the Fed’s hiking cycle, starting as soon as at the March gathering.
Later in the week, the API and the EIA will report on US crude oil inventories in the week to March 10.
So far, it seems sellers remain in control of the sentiment around crude oil. A drop below the 2023 low at $72.30 (February 6) could pave the way for a potential test of the 2022 low at $70.10 (December 9) just ahead of the key round level at $70.00. For all that, there is an interim hurdle at the 100-day SMA at $79.43 prior to the March high at $80.90 (March 7) and the 2023 top at $82.60 (January 23). North from here emerges the December 2022 peak at $83.32 (December 1) seconded by the $90.08 level (November 11 2022) and the November 2022 high at $93.73 (November 7).
Resistance levels: $78.01 $80.90 $82.60 (4H chart)
Support levels: $72.36 $70.07 $67.52 (4H chart)
GER40
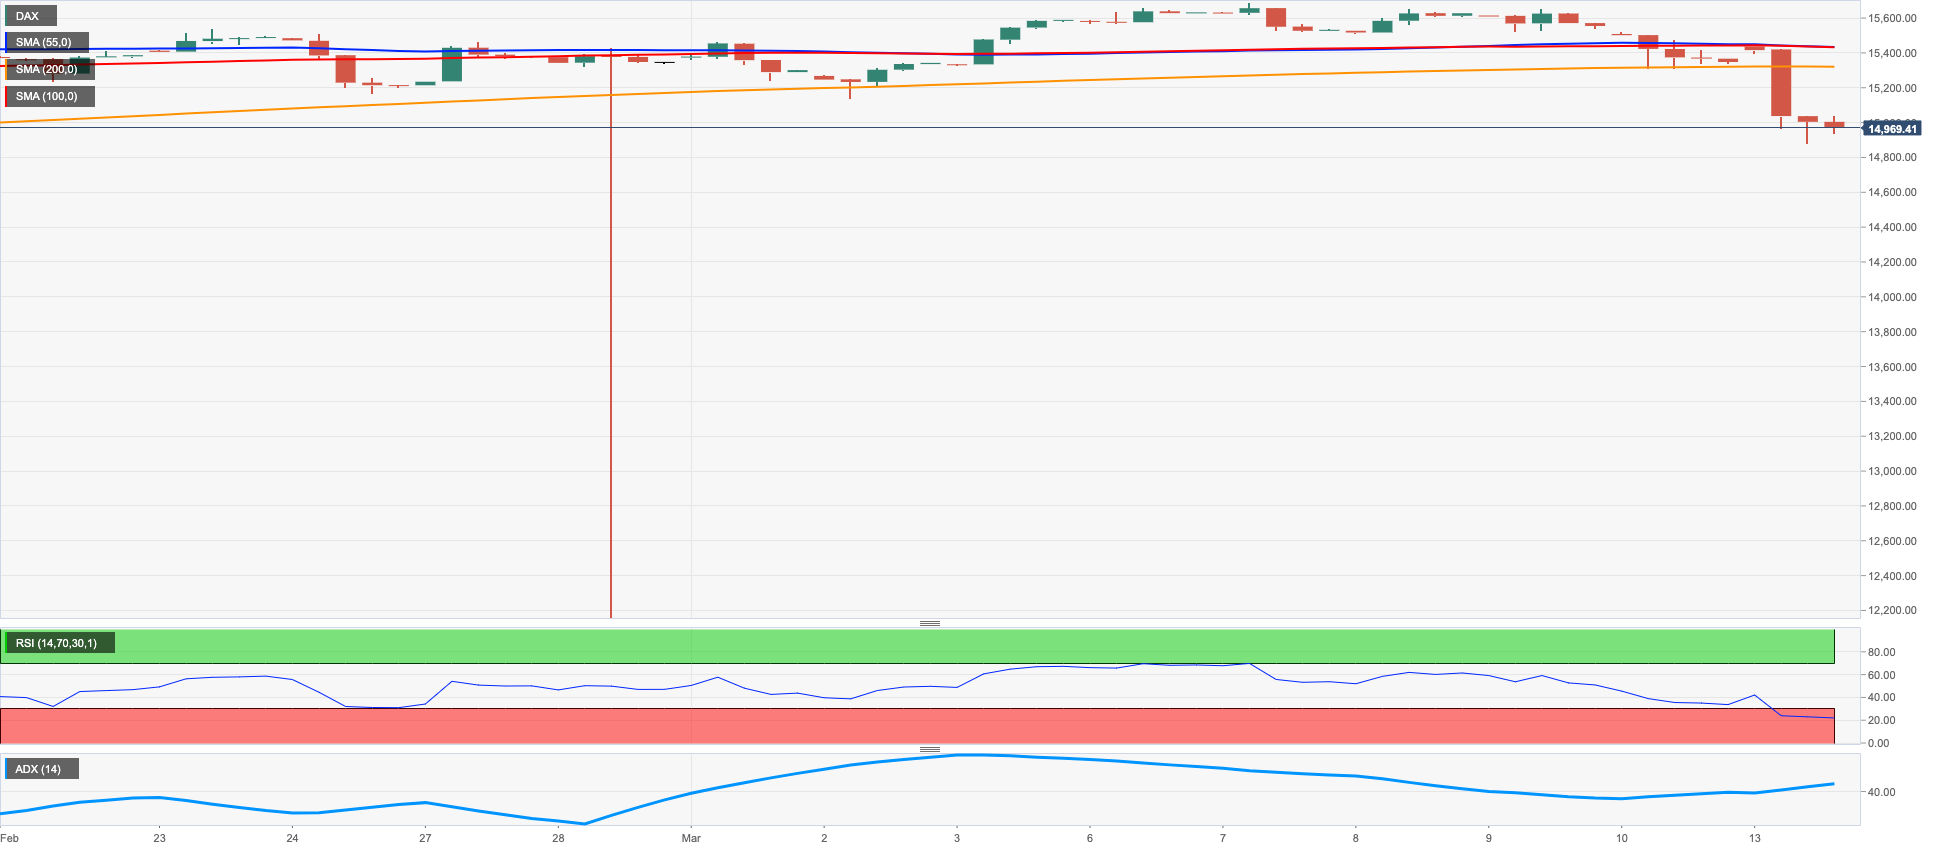
European equities started the week in a very negative fashion. Against that, the German stock benchmark DAX40 retreated more than 3% and closed below the 15000 mark for the first time since mid-January.
Contagion fears stemming from the SVB collapse spread rapidly at the beginning of the week and weighed heavily on investors’ sentiment, bolstering at the same time a strong risk-off mood.
Against that backdrop, the German 10-year Bund yields dropped below the 2.20% level in line with the rest of their global peers, a region last traded back in early February.
The DAX40 now looks under pressure and the breach of the weekly low at 14906 (January 19) could expose a move to the provisional 100-day SMA at 14608 prior to the more significant 200-day SMA at 13826 and just before the December 2022 low at 13791 (December 13). On the other hand, the 2023 peak at 15706 (March 6) emerges as the next big magnet for bulls ahead of the February 2022 high at 15736 (February 2 2022). Beyond the latter, the index could face the round level at 16000 before the 2022 top at 16285 (January 5). The daily RSI grinded lower to the sub-38 region.
Best Performers: Sartorius AG VZO, RWE AG ST, Symrise AG
Worst Performers: Commerzbank, Covestro, Deutsche Bank Ag
Resistance levels: 15706 15736 15912 (4H chart)
Support levels: 14887 14388 13791 (4H chart)
NASDAQ
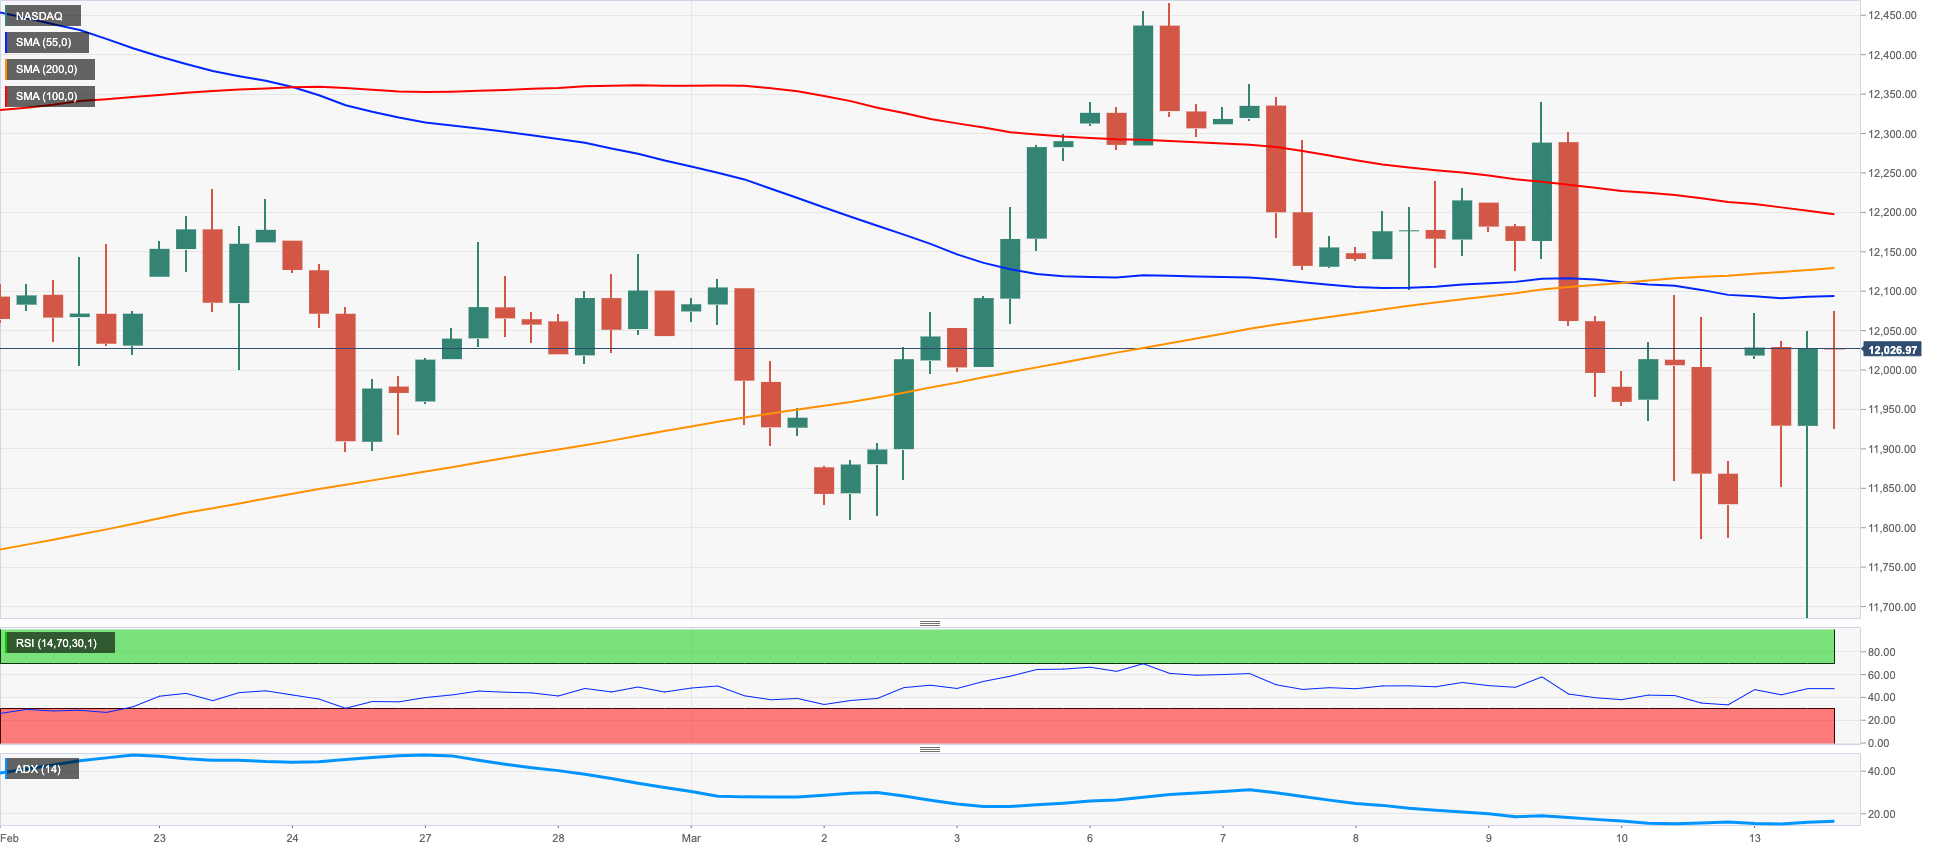
The tech reference Nasdaq 100 started the week in a promising note and reversed two consecutive daily pullbacks on Monday, although not before receding to 2-month lows near the 11700 zone, where the 100-day SMA also converges.
The better tone in the tech sector came on the back of the weaker dollar and the heightened selling pressure in US yields across the curve, while speculation around a potential impasse in the Fed’s hiking cycle in response to the crisis around SVB and probable contagion effervescence also lent legs to the index at the beginning of the week.
Further recovery could motivate the Nasdaq 100 to revisit the March high at 12466 (March 6) prior to the weekly top at 12689 (February 15) and the 2023 peak at 12880 (February 2). Further gains could see the round level at 13000 revisited before ahead of the weekly high at 13175 (August 26 2022). Having said that, the loss of the March low at 11695 (March 13) could quickly put the 100-day SMA at 11663 to the test before weekly lows at 11550 (January 25) and 11251 (January 19). Down from here aligns the 2023 low at 10696 (January 6) and the December 2022 low at 10671 (December 22). The daily RSI climbed to the proximity of 49.
Top Gainers: Illumina, Seagen, Moderna
Top Losers: Fiserv, Rivian Automotive, Diamondback
Resistance levels: 12279 12466 12880 (4H chart)
Support levels: 11695 11251 11050 (4H chart)
DOW JONES
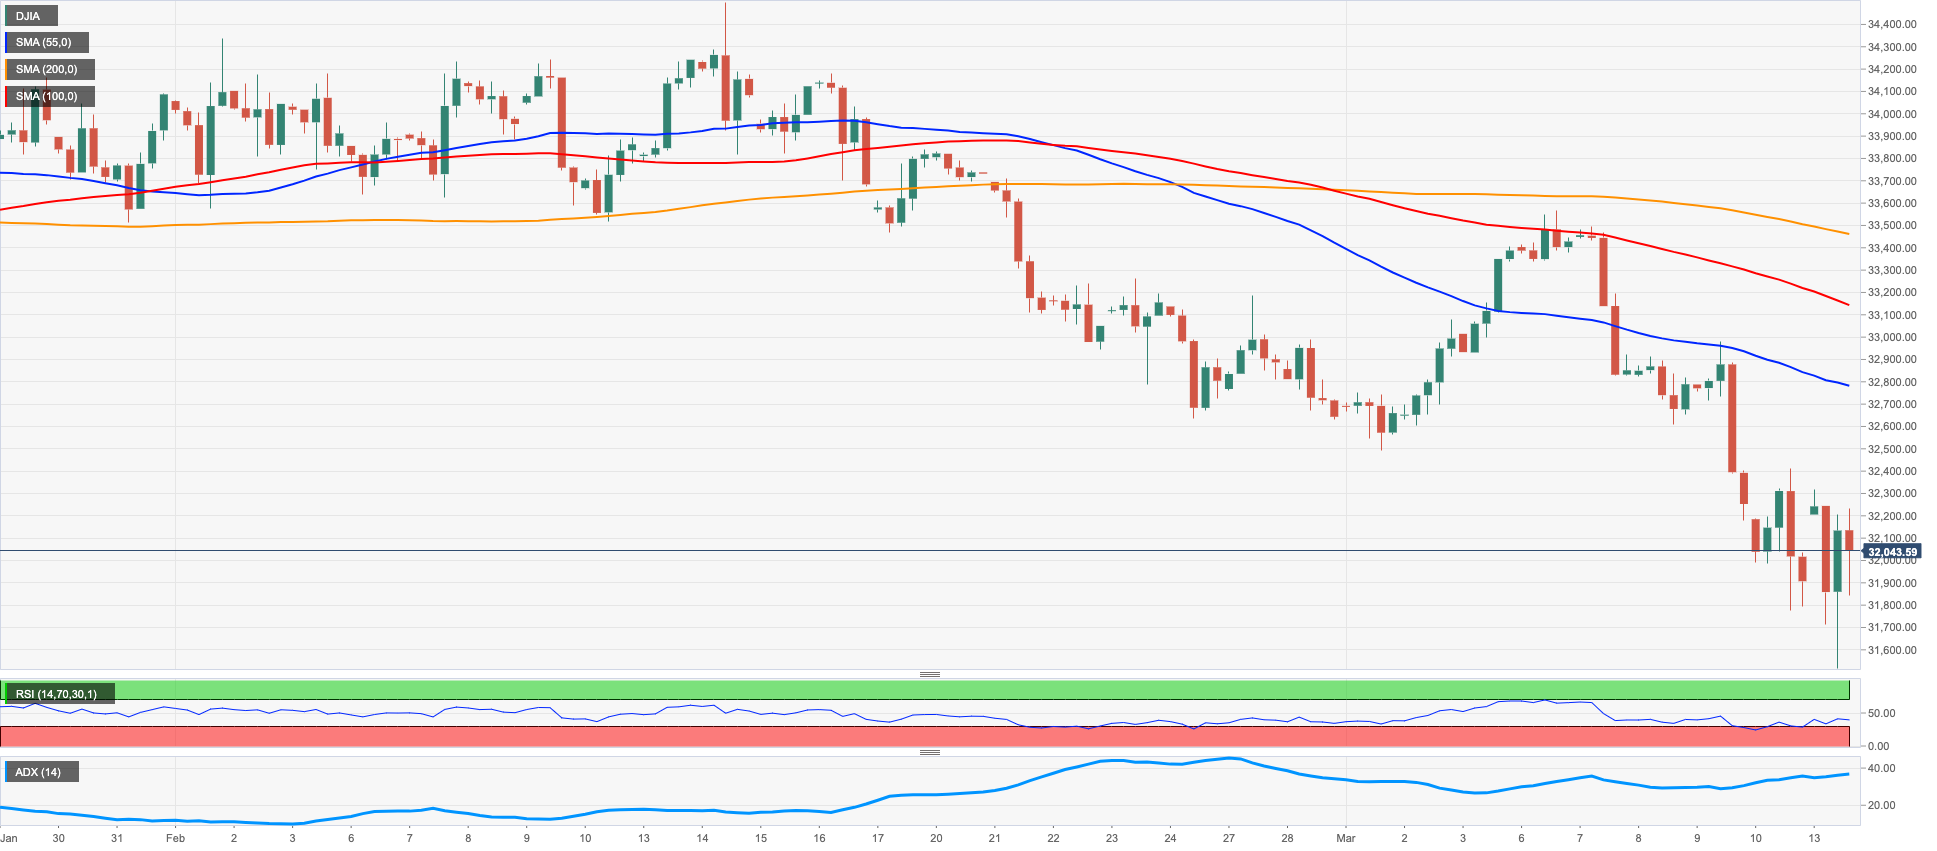
US equities tracked by the Dow Jones managed to reverse an earlier drop to new YTD lows near 31600, regaining some upside traction and poking once again with the 32000 neighbourhood.
Concerns surrounding the US banking system following the SVB meltdown and rising rumours among investors that the Federal Reserve might pause its tightening cycle supported the rebound in all three major US stock indices on Monday.
All in all, the Dow Jones gained 0.50% to 32069, the S&P500 rose 0.57% to 3883 and the tech-reference Nasdaq Composite advanced 1.23% to 11275.
The breakdown of the 2023 low at 31624 (March 13) could drag the Dow to the next support at 31515 (November 3) ahead of the key 30000 mark and followed by the 2022 low at 28660 (October 13). By contrast, the initial meaningful barrier appears at the key 200-day SMA at 32392 ahead of temporary barriers at the 100- and 55-day SMAs at 33267 and 33432, respectively. Further up comes the March peak at 33572 (March 6) ahead of the 2023 high at 34342 (January 13). The daily RSI rebounded to the proximity of the 34 area.
Top Performers: Microsoft, Amgen, Coca-Cola
Worst Performers: American Express, Goldman Sachs, Dow
Resistance levels: 33224 33572 34331 (4H chart)
Support levels: 31624 28660 26143 (4H chart)
MACROECONOMIC EVENTS

All Information & Updates provided by:

All information relating to the financial markets available on this page has been prepared and issued by FXStreet (Forexstreet SL, Spain, Reg: B62498233) on the basis of publicly available information and all information believed to be reliable and does not conflict with Kuwaiti local laws, and all necessary care has been taken to before the company to ensure that the facts mentioned are correct from the source.
NCM Investment nor any of its directors or employees shall in any way be held responsible for the contents of this news, and the information contained on this page is intended only to provide clients with publicly available information and should not be construed as investment advice, report or analysis and/or constitute an offer or invitation to buy or sell financial instruments of any kind.
RISK WARNING: Forex and CFDs are highly risky leveraged products, as losses can exceed deposits. Please ensure you understand all the risks and take independent advice if necessary. NCM will segregate the clients based on the criteria of the regulator and its bylaws. NCM does not provide any advisory service; the material published does not constitute advice or a recommendation for a transaction in any financial instrument. NCM accepts no responsibility for any use of the content presented and any consequences of that use. Anyone acting on the information provided does so at their own risk.