
- Contact Us:
-

-

-

-


Daily Market Updates
15 Mar 2023
USDJPY
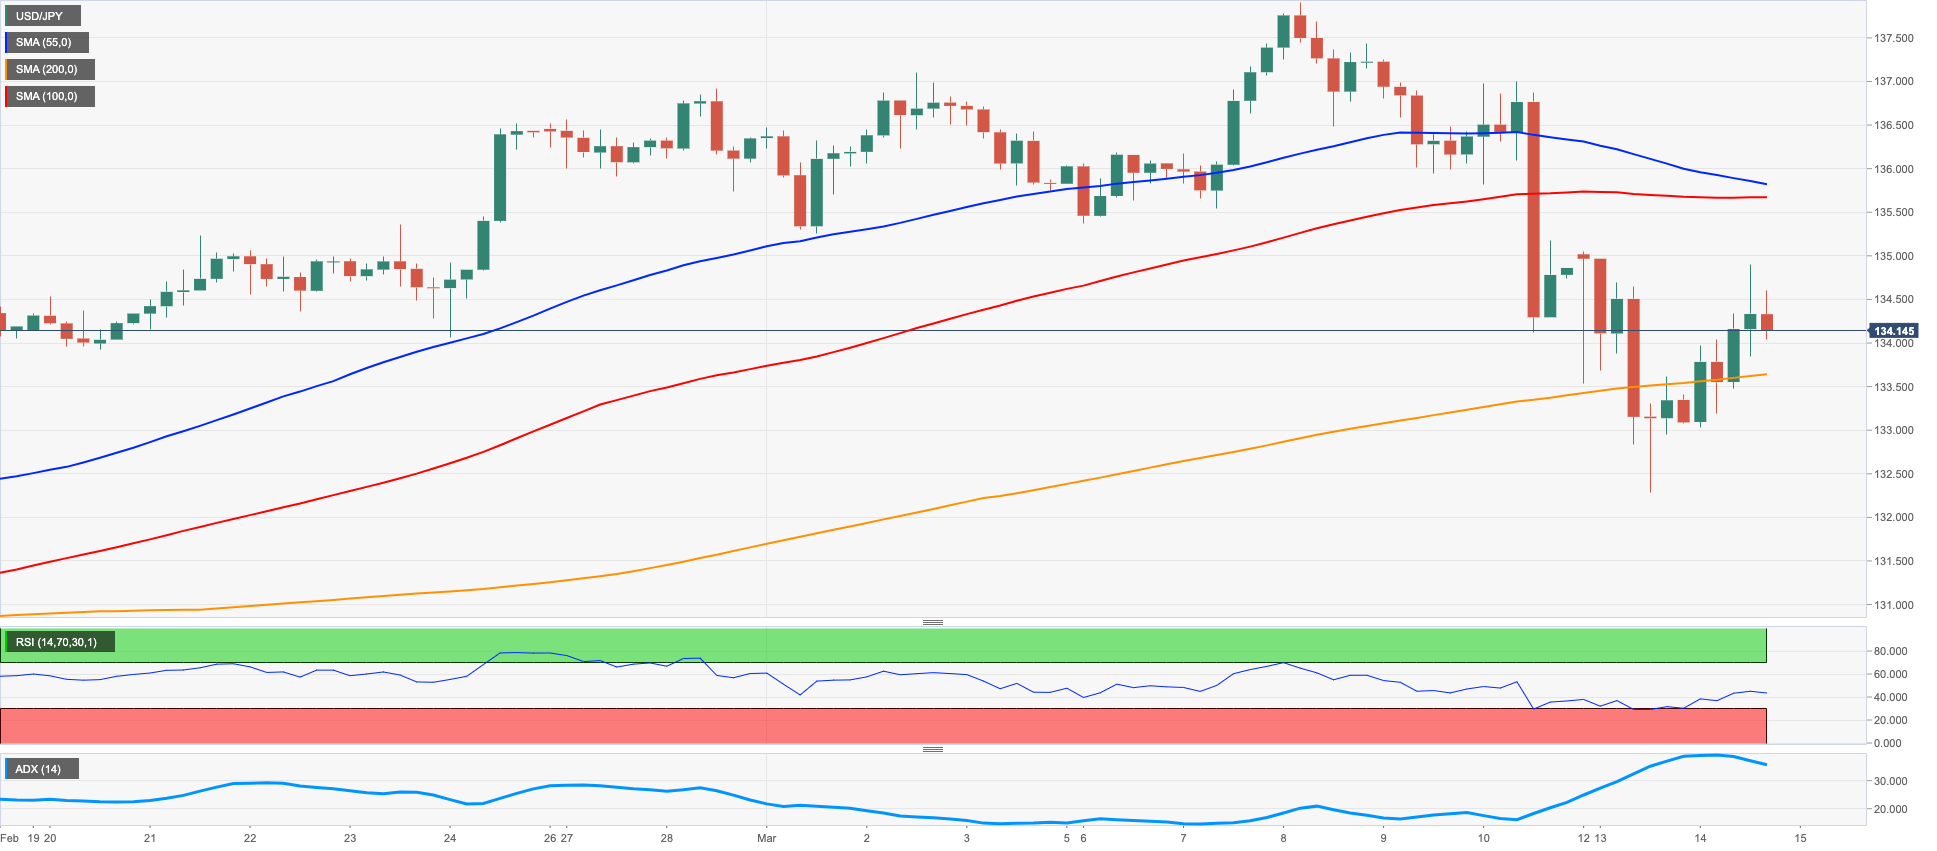
USD/JPY finally saw some light at the end of the tunnel and advanced moderately to the boundaries of 135.00 the figure after three daily drops in a row on Tuesday.
The small improvement in the greenback and the recovery in US yields across the curve added some colour to the bullish attempt in spot after bottoming out in 4-week lows near 132.30 in the previous session, an area also coincident with the 55-day SMA.
In the Japanese bond market, the JGB 10-year yields regained some composure in line with the rest of their global peers and rose past the 0.32% level following an early drop to the 0.16% region.
There were no data releases scheduled in Japan on Tuesday, leaving all the attention to Wednesday’s release of the BoJ Minutes of the March meeting.
USD/JPY puts some distance from recent lows, although it is not out of the woods just yet. That said, the breakdown of the March low at 132.27 (March 13) should lead up to a potential test of the key 130.00 mark ahead of the weekly low at 129.79 (February 10). Down from here turns up the February low at 128.08 (February 2) seconded by the 2023 low at 127.21 (January 16). On the flip side, there is a temporary hurdle at the 100-day SMA at 135.67 ahead of the key 200-day SMA at 137.48, which precedes the 2023 high at 137.91 (March 8). Once this level is cleared, the pair could challenge weekly tops at 138.17 (December 15 2022) and 139.89 (November 30 2022) ahead of the key round level at 140.00 and the weekly peak at 142.25 (November 21 2022). The daily RSI rebounded north of the 47 area.
Resistance levels: 134.90 136.99 137.91 (4H chart)
Support levels: 133.49 132.27 129.79 (4H chart)
GBPUSD
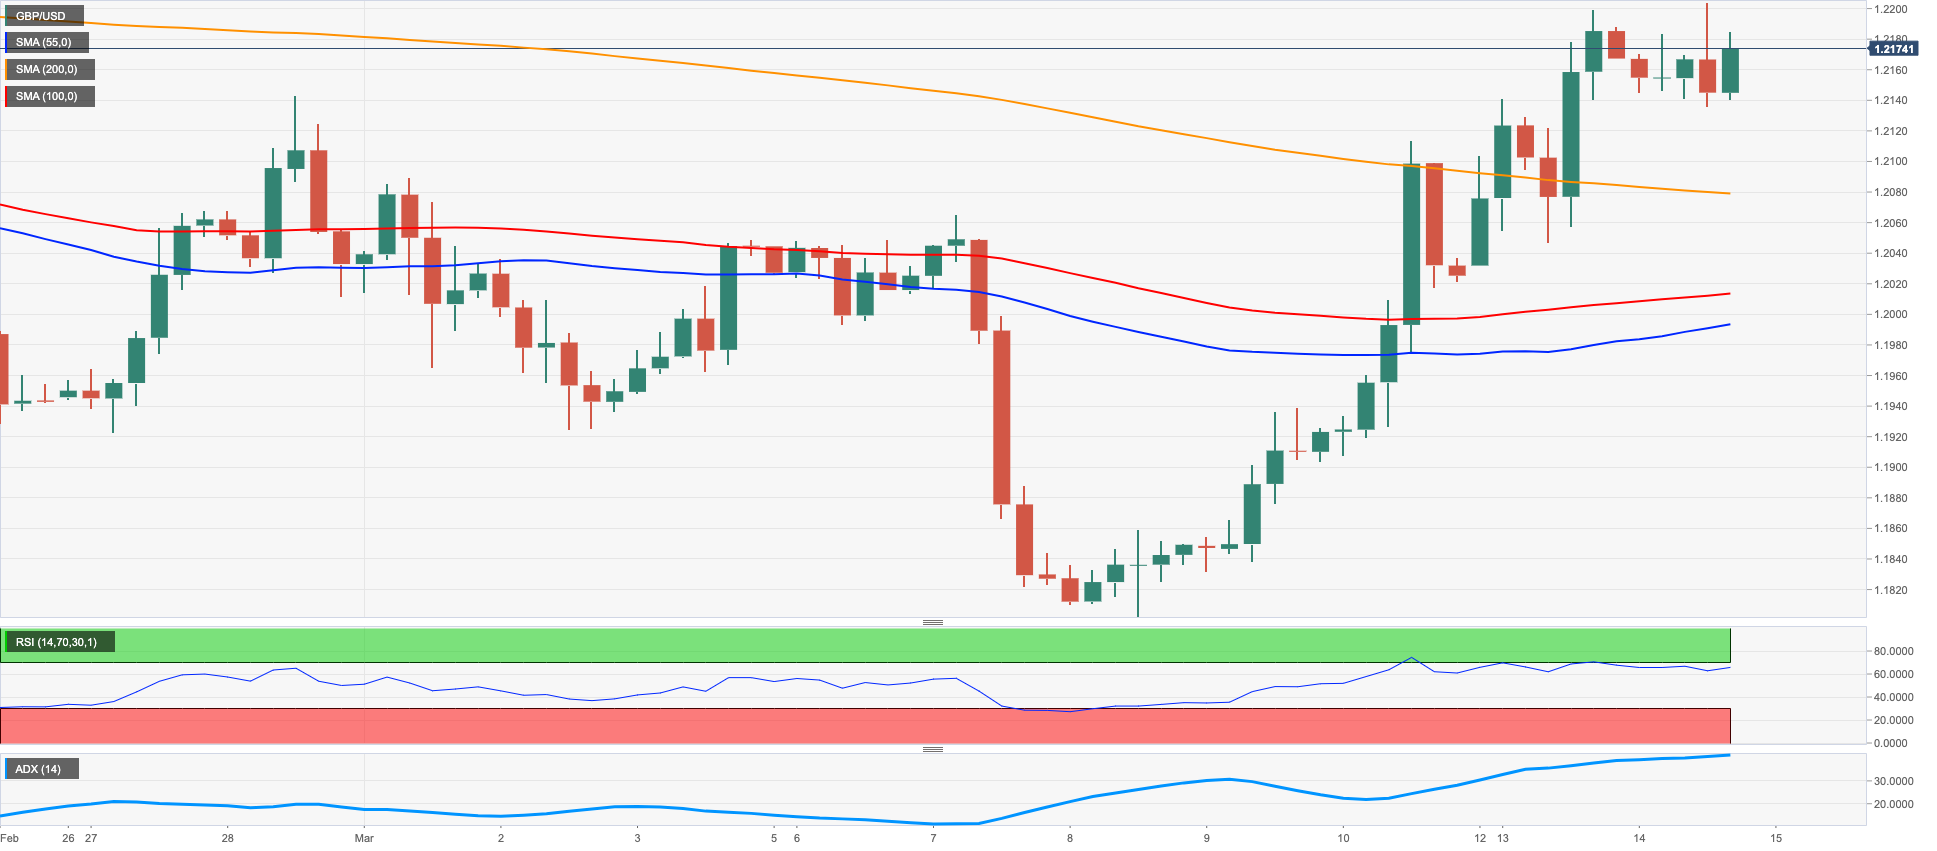
In line with some of the risk-associated assets, the British pound gave away part of the recent 4-day strong rebound and prompted GBP/USD to quickly fade the earlier advance just beyond 1.2200 the figure on Tuesday.
In fact, Cable could not sustain the trespass of the 1.2200 mark and succumbed to the initial recovery in the greenback, although better-than-expected results from the UK labour market report appear to have limited the downside in the pair.
On the latter, the Employment Change increased by 65K people in December and the Unemployment Rate stayed unchanged at 3.7% in January. Additionally, Average Earnings inc. Bonus expanded 5.7% in the 3Month/Year in January and the Claimant Count Change dropped by 11.2K persons in February.
GBP/USD now faces the next hurdle at the March peak at 1.2203 (March 14) ahead of the weekly high at 1.2269 (February 14). Above the latter, there are no resistance levels of note until the 2023 top at 1.2447 (January 23) seconded by the May 2022 peak at 1.2666 (May 27) and the 200-week SMA at 1.2873, all preceding the psychological 1.3000 barrier. In opposition, the immediate contention comes at the key 200-day SMA at 1.1894 before the 2023 low at 1.1802 (March 8) and the November 2022 low at 1.1142 (November 4). The daily RSI deflated a tad to the area below the 57 level.
Resistance levels: 1.2203 1.2269 1.2401 (4H chart)
Support levels: 1.2090 1.1991 1.1802 (4H chart)
AUDUSD
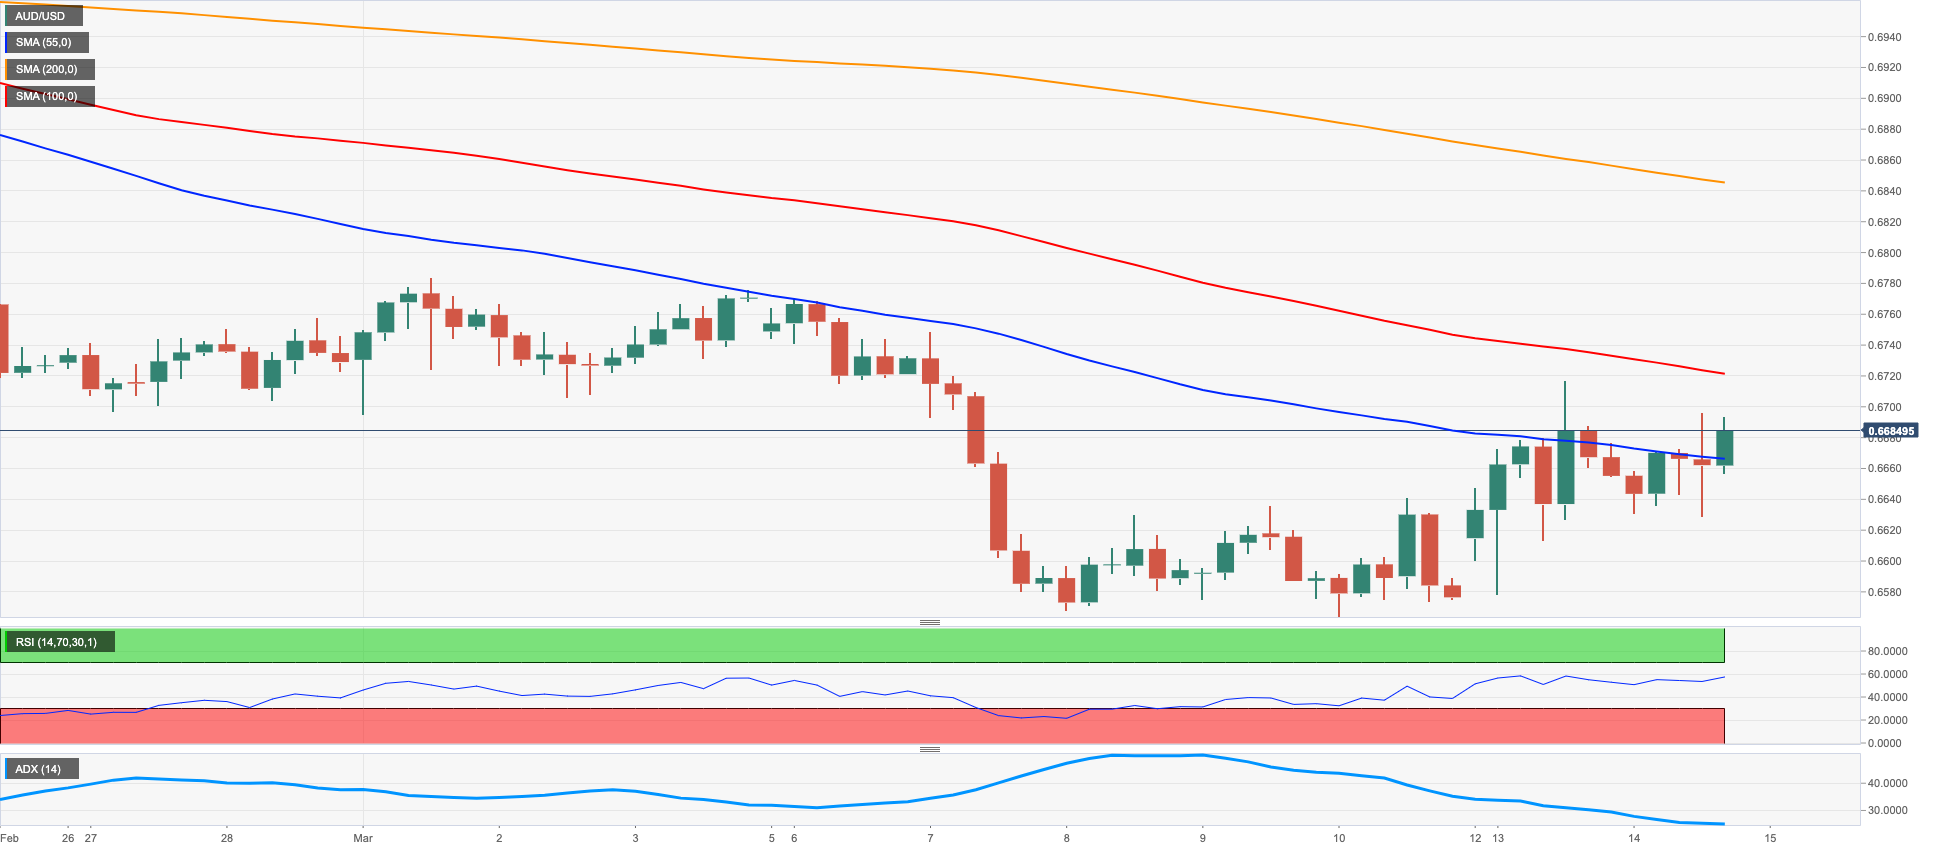
The inconclusive price action around the greenback prompted AUD/USD to follow and equally vacillating performance on Tuesday, ending the session around Monday’s closing levels near 0.6670/80.
The mixed note in the commodity complex did not help the Aussie dollar either after copper prices kept the erratic activity and faded part of Monday’s uptick and the iron ore surpassed the $130.00 mark per tonne for the first time since late June 2022.
In Oz, the Consumer Confidence measured by Westpac held steady at 78.5 in March, while the NAB Business Confidence worsened to -4 in February.
In case bulls regain the upper hand, AUD/USD is expected to meet the next up-barrier at the weekly peak at 0.6716 (March 13) prior to the key 200-day SMA at 0.6769. Soon after this level emerges another weekly high at 0.6783 (March 1) before the provisional 55-day SMA at 0.6868 and the weekly top at 0.6920 (February 20). Further north appears the key round level at 0.7000 seconded by the weekly peak at 0.7029 (February 14). Just the opposite, the initial support remains at the 2023 low at 0.6563 (March 10) ahead of the weekly low at 0.6386 (November 10 2022) and the November 2022 low at 0.6272 (November 3). The daily RSI picked up some pace and approached the 42 area.
Resistance levels: 0.6716 0.6774 0.6855 (4H chart)
Support levels: 0.6563 0.6386 0.6271 (4H chart)
GOLD
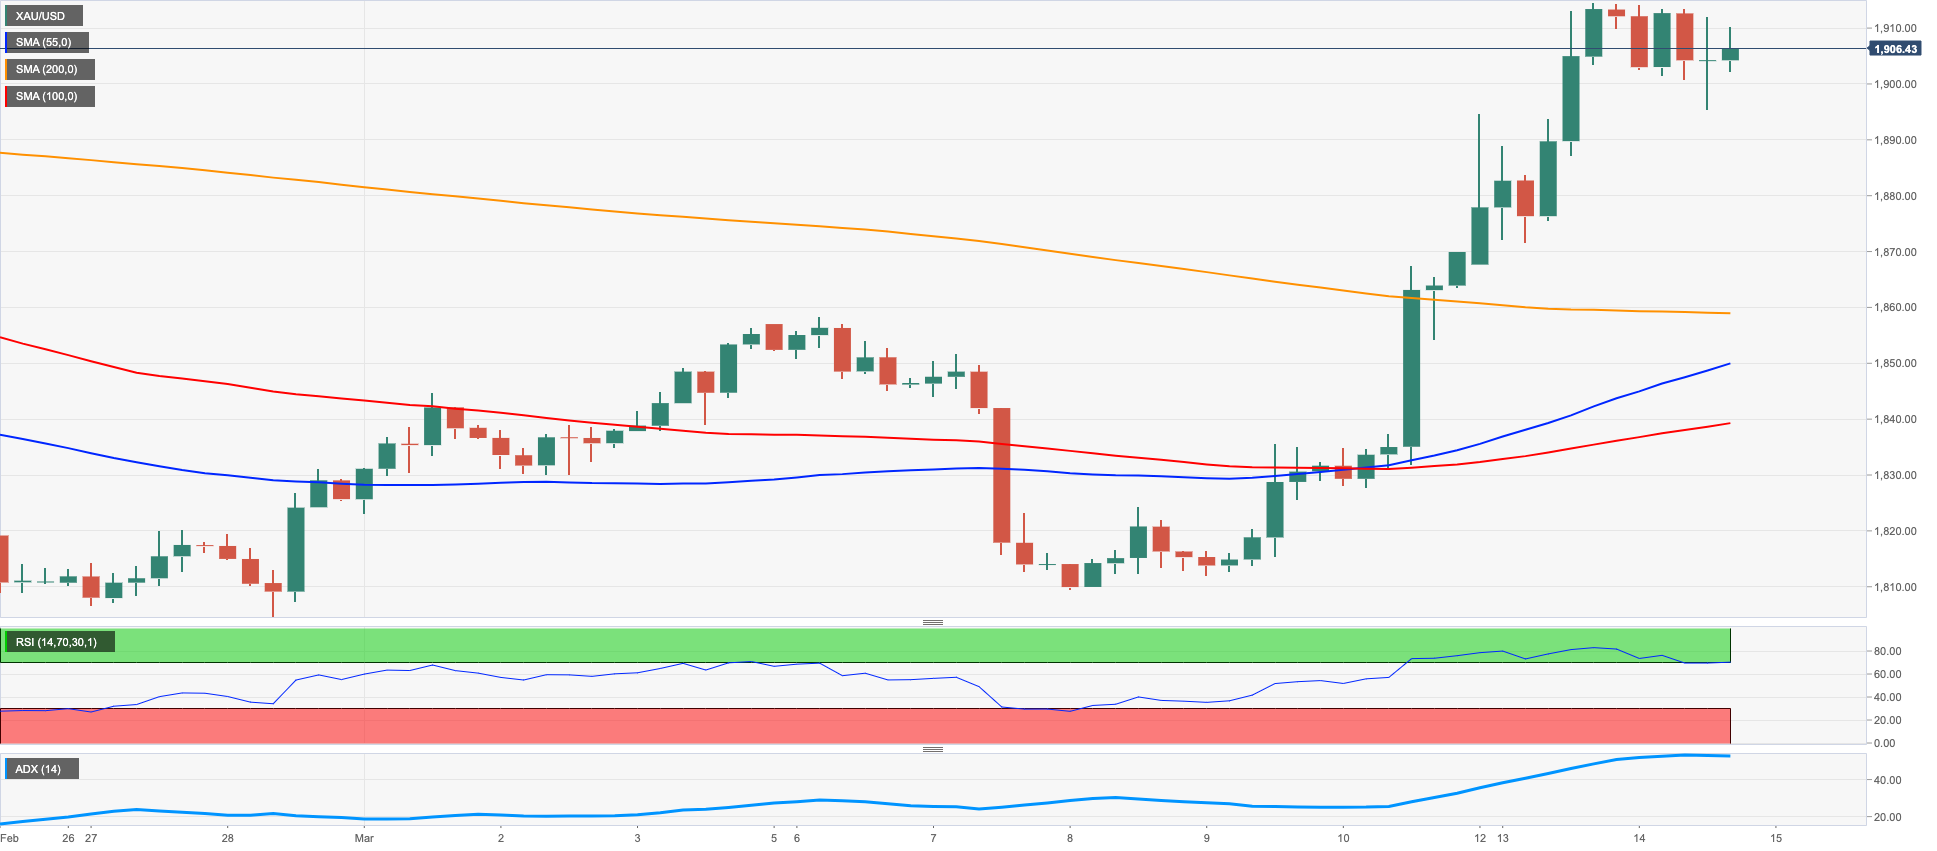
Gold prices met a tough resistance around $1915 per ounce troy so far this week. That said, the yellow metal gave away some of the recent 4-day acute rebound and briefly revisited the sub-$1900 area on Tuesday.
The lacklustre price action in the dollar initially weighed on the yellow metal along with alleviating concerns surrounding the US banking sector in the aftermath of the SVB and Signature Bank crisis.
However, declining bond prices saw US yields pare some of the recent losses and advance sharply in the short end of the curve vs. modest gains in the belly and the long end.
Tuesday’s small pullback in gold prices does not change the positive near-term view. On that, the breakout of the March top at $1914 (March 14) could put a potential advance to the 2023 high at $1959 (February 2) back on the traders’ radar ahead of the April 2022 high at $1998 (April 18) and the psychological $2000 mark per ounce. On the contrary, there is interim support levels at the 55- and 100-day SMA at $1869 and $1812, respectively, seconded by the March low at $1809 (March 8), which precedes the 2023 low at $1804 (February 28) and the key $1800 region. South of this level comes the key 200-day SMA at $1776 seconded by the weekly low at $1727 (November 23) and the November 2022 low at $1616 (November 3).
Resistance levels: $1914 $1959 $1998 (4H chart)
Support levels: $1861 $1849 $1809 (4H chart)
CRUDE WTI
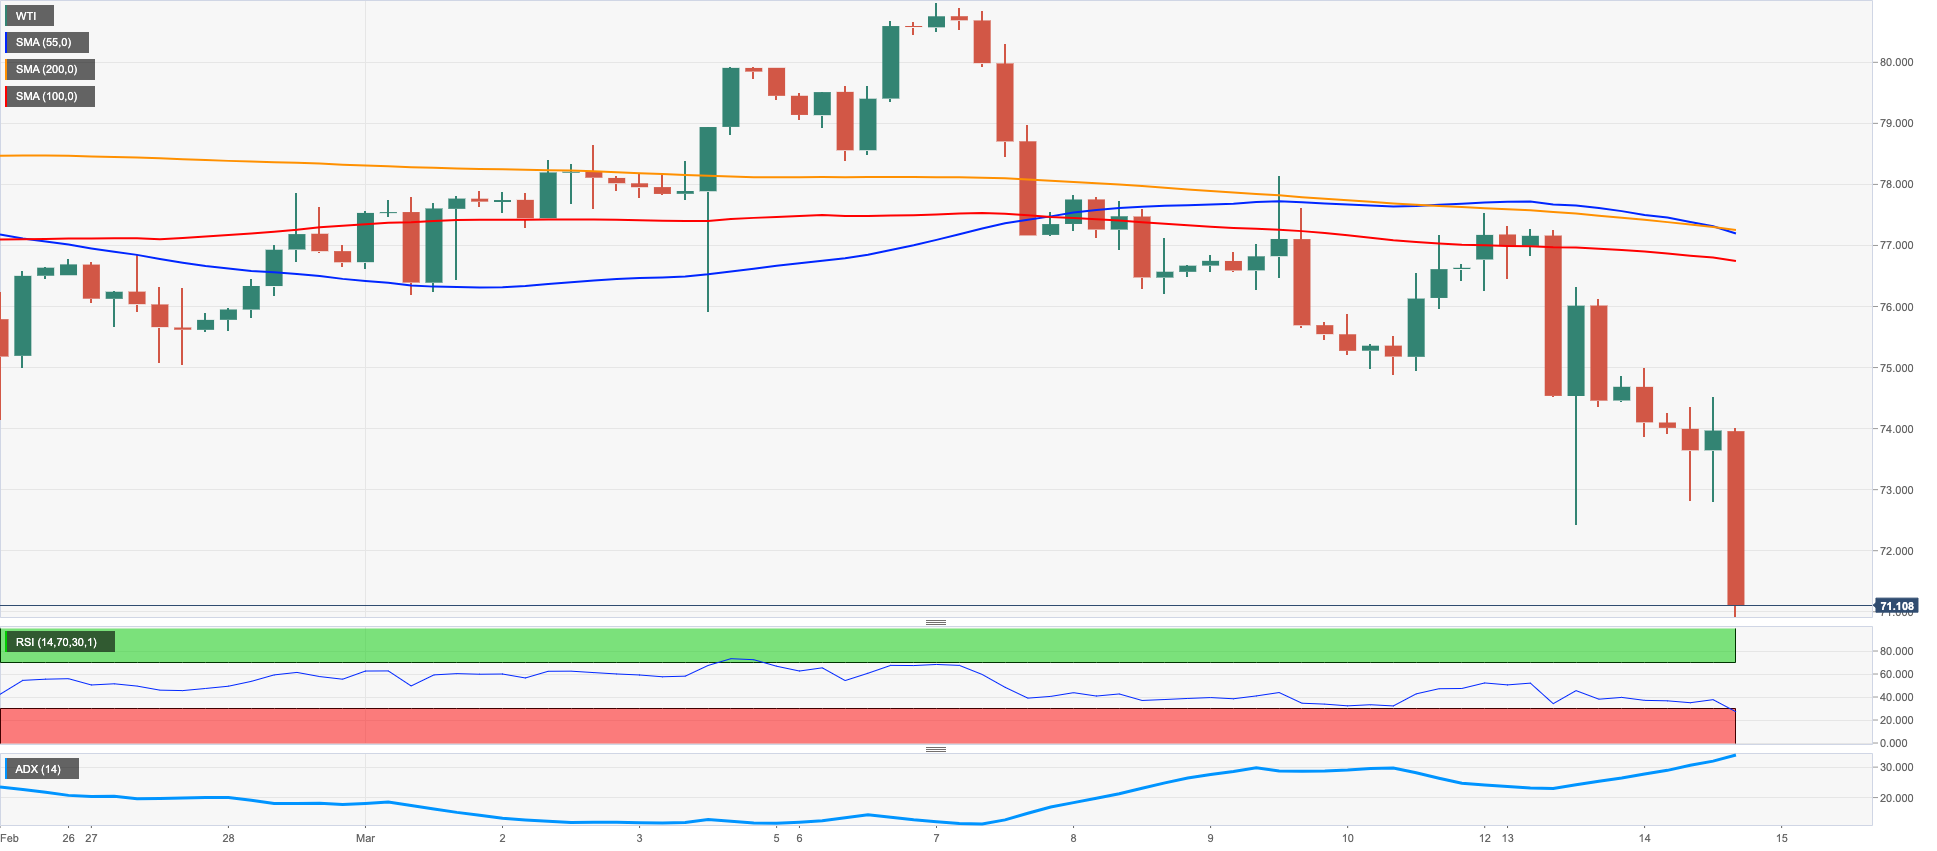
Unabated concerns surrounding a potential economic slowdown and its impact on the demand for crude oil have been reinforced by the recent collapse of two US lenders and the subsequent resurgence of contagion jitters, all forcing prices of the barrel of the West Texas Intermediate (WTI) to revisit levels last seen in mid-December below $71.00 on turnaround Tuesday.
In addition, persistent elevated inflation – as per February’s CPI – left well and sound the likelihood that the Federal Reserve could maintain the ongoing hiking cycle, which ultimately morphed into extra recession concerns.
Later on Tuesday, the API will report on US crude oil stockpiles in the week to March 10.
A deeper drop of the WTI could see the 2022 low at $70.10 (December 9) revisited just before the key round level at $70.00 and the weekly low at $66.15 (December 20 2021). On the opposite side, provisional up-barriers emerge at the 55- and 100-day SMAs at $77.56 and $79.28, respectively, ahead of the March top at $80.90 (March 7) and the 2023 peak at $82.60 (January 23). Further gains could revisit the December 2022 high at $83.32 (December 1) followed by the $90.08 level (November 11 2022) and the November 2022 high at $93.73 (November 7).
Resistance levels: $77.21 $80.90 $82.60 (4H chart)
Support levels: $70.83 $70.07 $67.52 (4H chart)
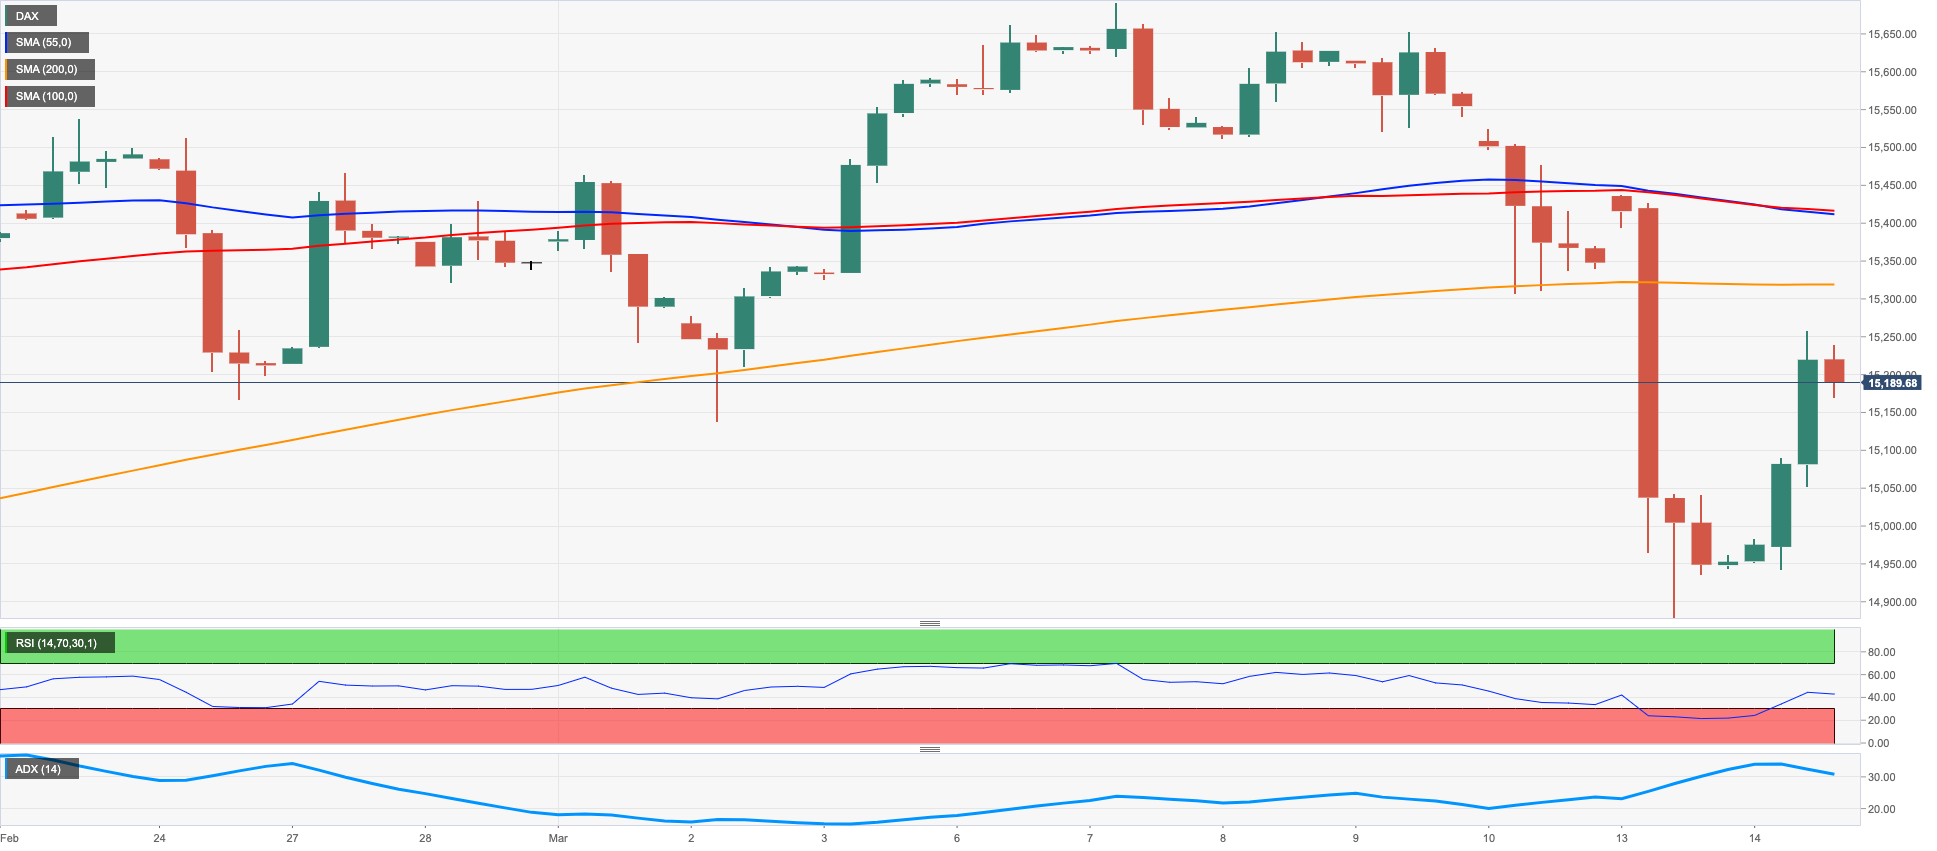
GER40
Equities measured by the main European stock indices rebounded markedly and left behind part of the recent strong retracement on Tuesday.
The German benchmark DAX40 partially set aside the acute decline seen at the beginning of the week and reclaimed the area above the 15200 level on the back of the strong rebound in banking shares as investors seem to have digested the recent SVB collapse.
Extra support for equities came after US inflation figures showed the CPI lost further strength in February, which in turn reignited speculation that the Fed may pause its hiking cycle in the not-so-distant future.
In line with the rest of the global money markets, the German 10-year Bund yields finally reversed five consecutive sessions with losses and advanced decently to the area past the 2.40% level.
If the rebound gathers extra steam, then the DAX40 could dispute the 2023 high at 15706 (March 6) prior to the February 2022 top at 15736 (February 2 2022). The surpass of this level exposes the round level at 16000 ahead of the 2022 peak at 16285 (January 5). By contrast, the resumption of the downside pressure could put another test of the March low at 14887 (March 13) back on the traders’ radar prior to the interim 100-day SMA at 14631 and the more relevant 200-day SMA at 13828, all ahead of the December 2022 low at 13791 (December 13). The daily RSI leapt to the vicinity of 47.
Best Performers: Dr Ing hc Porsche AG Pfd, Commerzbank, Deutsche Bank Ag
Worst Performers: Volkswagen VZO, Porsche, Qiagen
Resistance levels: 15706 15736 15912 (4H chart)
Support levels: 14887 14388 13791 (4H chart)
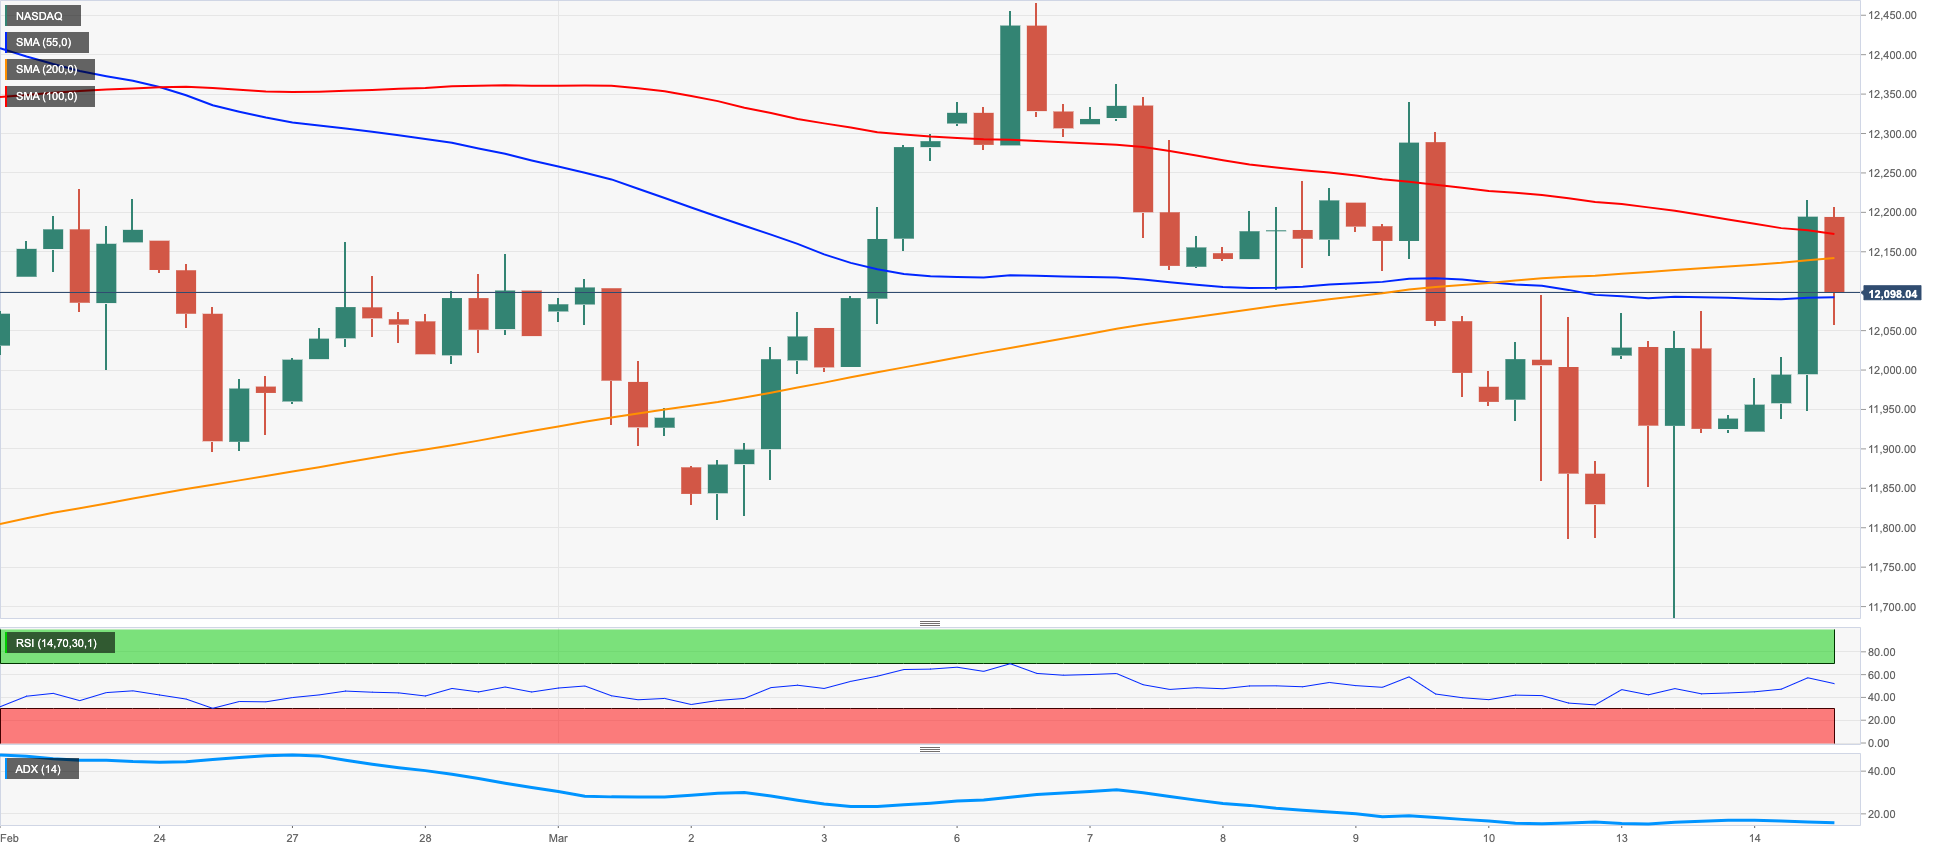
NASDAQ
The tech sector followed its peers and rebounded markedly past the key 12000 yardstick on Tuesday, or 3-day highs.
The uncertain price action in the greenback in combination with another sign of loss of momentum in US inflation collaborated with the optimism in the tech sector and in the US markets in general, all against the backdrop of firmer conviction among market participants of a pivot in the Fed’s tightening cycle sooner rather than later.
Extra upside in the Nasdaq 100 could prompt a visit to the March top at 12466 (March 6) to emerge on the horizon before the weekly peak at 12689 (February 15) and the 2023 high at 12880 (February 2). North from here emerges the round level at 13000 seconded by the weekly top at 13175 (August 26 2022). On the other hand, the March low at 11695 (March 13) appears reinforced by the temporary 100-day SMA at 11672 ahead of weekly lows at 11550 (January 25) and 11251 (January 19). The breach of the latter unveils a potential move to the 2023 low at 10696 (January 6) prior to the December 2022 low at 10671 (December 22). The daily RSI advanced just above 50.
Top Gainers: Meta Platforms, AMD, Fiserv
Top Losers: Lucid Group, Rivian Automotive, Sirius XM
Resistance levels: 12260 12466 12880 (4H chart)
Support levels: 11695 11251 11050 (4H chart)
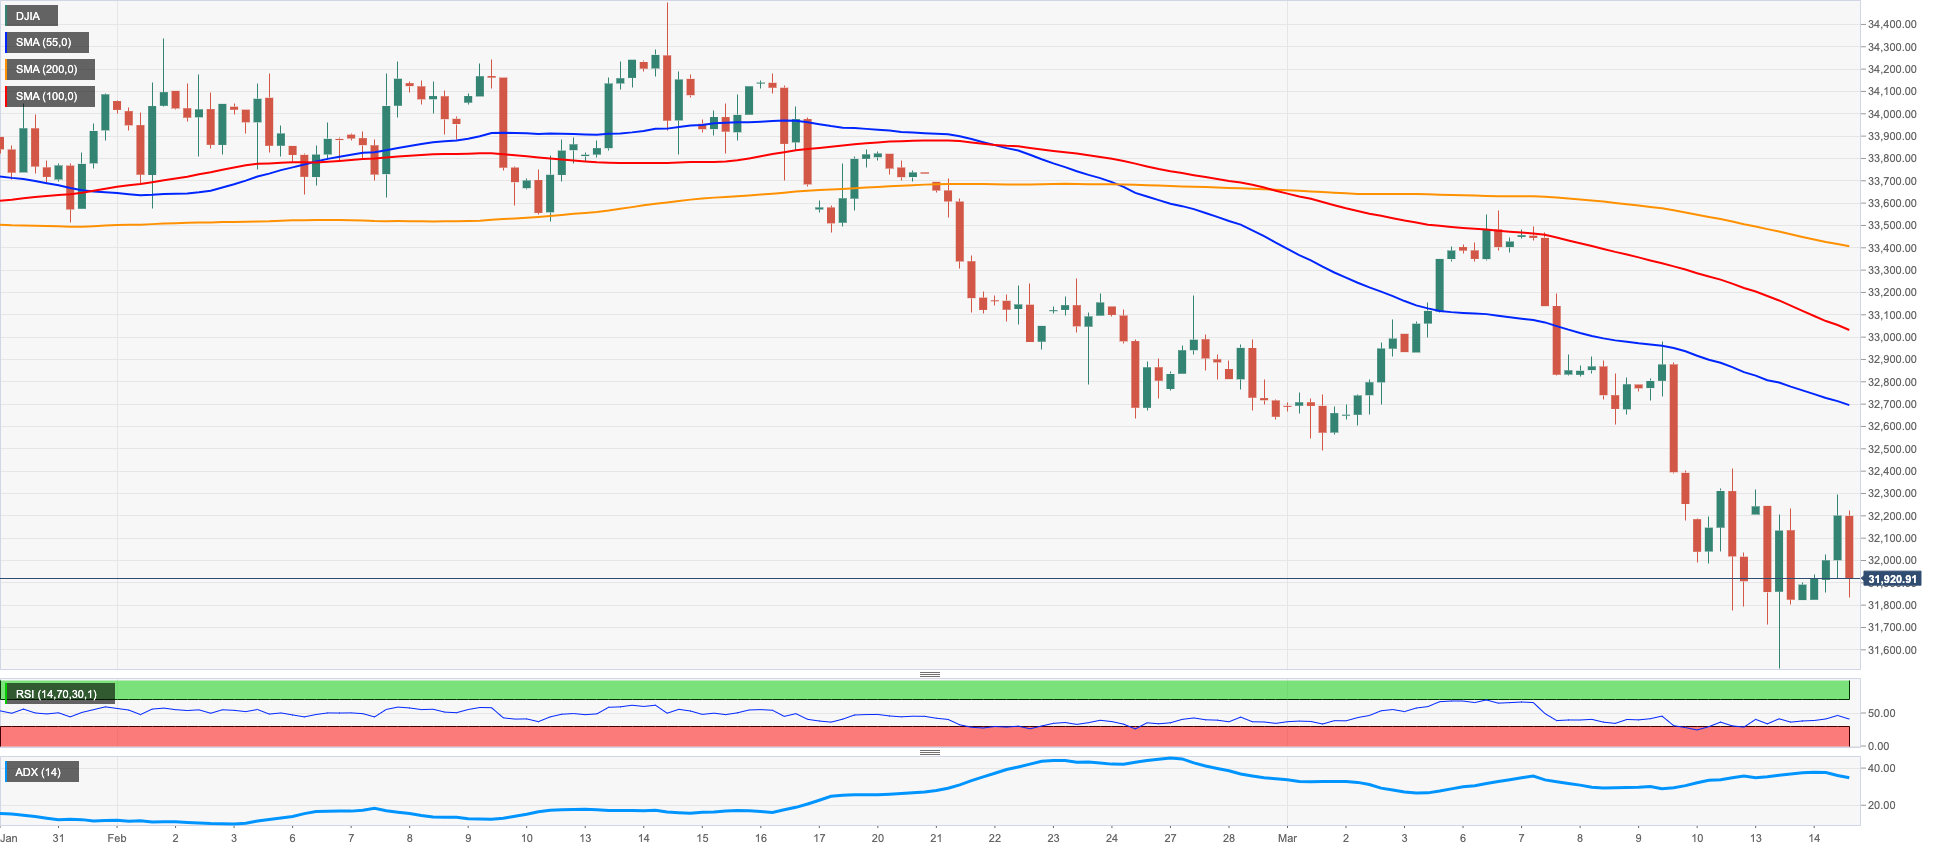
DOW JONES
Fresh hopes that the Federal Reserve could pause its tightening stance resurfaced and lent extra legs to the US stock benchmark Dow Jones on Tuesday, which traded with gains for the first time after five consecutive daily losses.
Indeed, those hopes found support after the US inflation tracked by the CPI deflated further in February – albeit it remains in elevated levels – while concerns around the US banking sector also seem to have underpinned bets for a 25 bps rate hike at the March 22 meeting.
Overall, the Dow Jones advanced 0.49% to 31974, the S&P500 gained 1.14% to 3899 and the tech-benchmark Nasdaq Composite rose 1.61% to 11369.
Once the Dow Jones clear the key 200-day SMA at 32391, it could then challenge provisional hurdles at the 100- and 55-day SMAs at 33280 and 33404, respectively, ahead of the March high at 33572 (March 6) and the 2023 top at 34342 (January 13). For all that, a move below the 2023 low at 31624 (March 13) is expected to open the door to a probable test of the key 30000 mark before the 2022 low at 28660 (October 13). The daily RSI regained upside traction and trespassed the 33 level.
Top Performers: Salesforce Inc, American Express, Intel
Worst Performers: Walgreen Boots, 3M, IBM
Resistance levels: 33248 33572 34331 (4H chart)
Support levels: 31624 28660 26143 (4H chart)
MACROECONOMIC EVENTS

All Information & Updates provided by:

All information relating to the financial markets available on this page has been prepared and issued by FXStreet (Forexstreet SL, Spain, Reg: B62498233) on the basis of publicly available information and all information believed to be reliable and does not conflict with Kuwaiti local laws, and all necessary care has been taken to before the company to ensure that the facts mentioned are correct from the source.
NCM Investment nor any of its directors or employees shall in any way be held responsible for the contents of this news, and the information contained on this page is intended only to provide clients with publicly available information and should not be construed as investment advice, report or analysis and/or constitute an offer or invitation to buy or sell financial instruments of any kind.
RISK WARNING: Forex and CFDs are highly risky leveraged products, as losses can exceed deposits. Please ensure you understand all the risks and take independent advice if necessary. NCM will segregate the clients based on the criteria of the regulator and its bylaws. NCM does not provide any advisory service; the material published does not constitute advice or a recommendation for a transaction in any financial instrument. NCM accepts no responsibility for any use of the content presented and any consequences of that use. Anyone acting on the information provided does so at their own risk.