
- Contact Us:
-

-

-

-


Daily Market Updates
16 Mar 2023
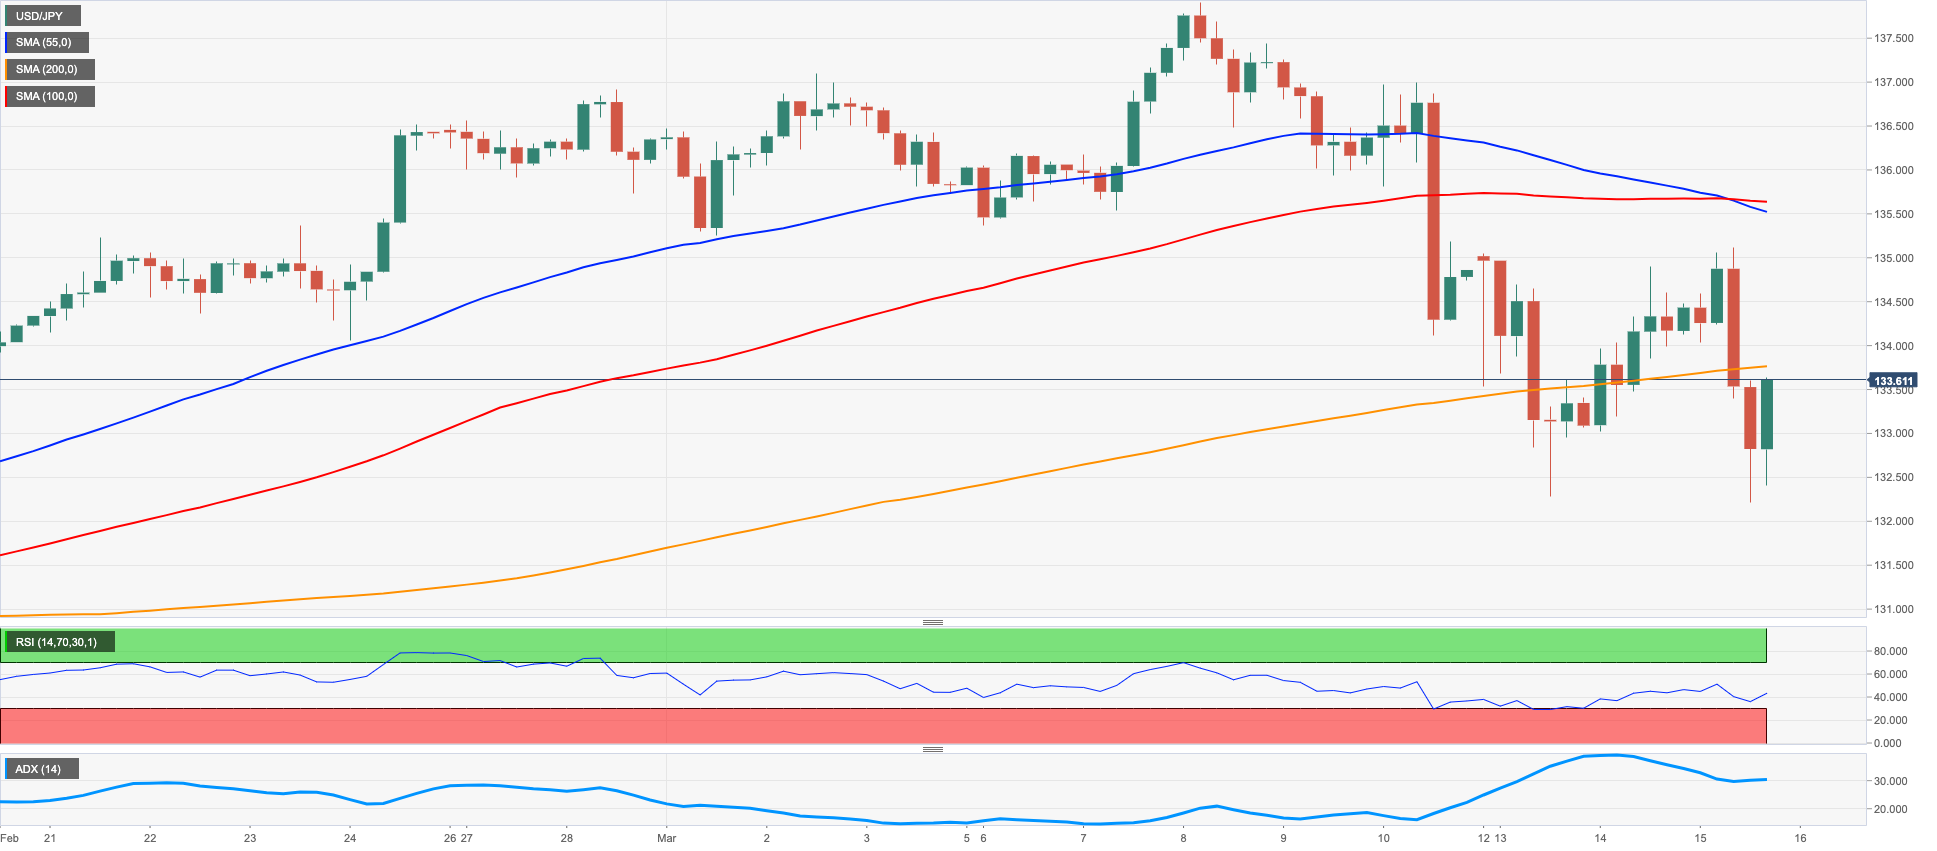
USDJPY
Increasing risk aversion lent legs to the safe haven Japanese yen and sponsored at the same time the resumption of the selling bias in USD/JPY, this time recording new multi-week lows near 132.20 region, although staging a moderate bounce towards the end of the NA session.
In combination with the persistent risk-off tone, US yields accelerated the decline across the curve in contrast to the second consecutive daily advance in the JGB 10-year yields, which approached the 0.37% zone.
In Japan, the BoJ published the Minutes from the March event, where members agreed that inflation should start to drop from the second half of the next fiscal year. In addition, many participants noted that more time is needed to evaluate the effects of the BoJ actions on the market function.
A drop below the March low at 132.21 (March 15) could motivate USD/JPY to head towards the key 130.00 zone prior to the weekly low at 129.79 (February 10). The breach of this level leaves the spot vulnerable to a deeper retracement to the February low at 128.08 (February 2) ahead of the 2023 low at 127.21 (January 16). In opposition, the 100-day SMA at 135.54 offers temporary resistance before the key 200-day SMA at 137.47 and the 2023 top at 137.91 (March 8). North from here aligns weekly peaks at 138.17 (December 15 2022) and 139.89 (November 30 2022) closely followed by the key round level at 140.00 and the weekly high at 142.25 (November 21 2022). The daily RSI dropped to the vicinity of the 45 area.
Resistance levels: 135.11 136.99 137.91 (4H chart)
Support levels: 132.21 129.79 128.08 (4H chart)
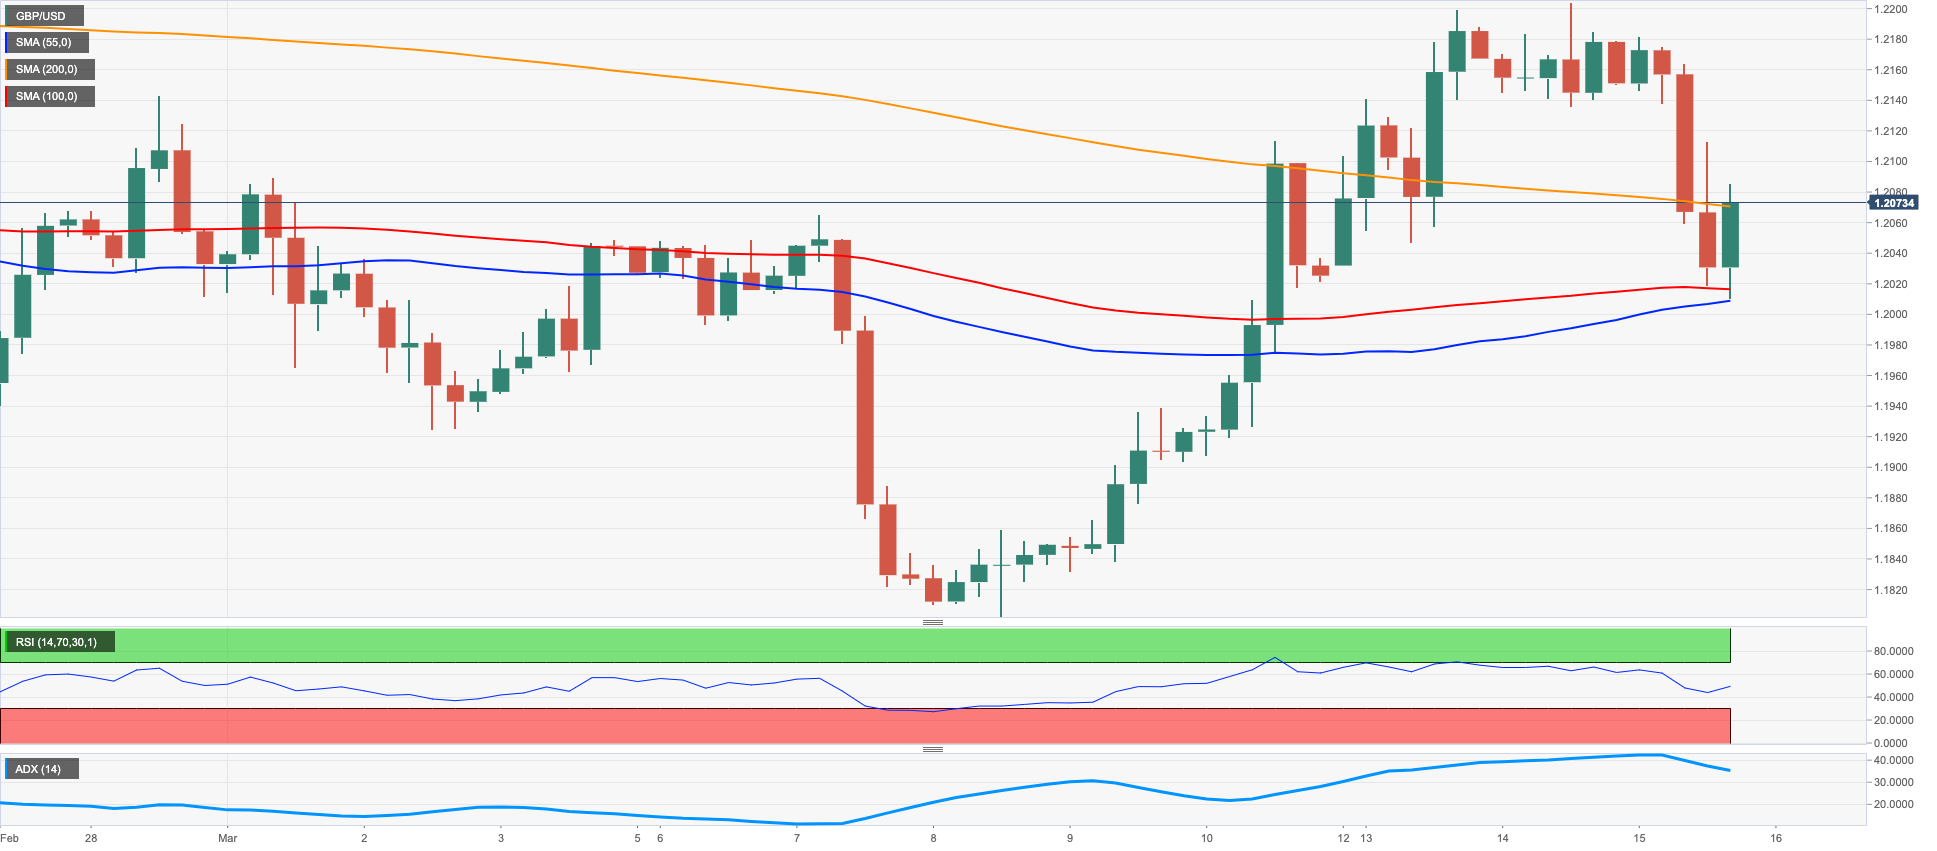
GBPUSD
GBP/USD intensified the weekly leg lower and flirted with the key 1.2000 neighbourhood on Wednesday, an area also coincident with the 100-day SMA, amidst increasing buying interest in the greenback, which was in turn bolstered by the strong pick-up in the risk aversion.
Indeed, negative headlines around the Swiss bank Credit Suisse ignited concerns among market participants and favoured the strong re-emergence of the risk-off trade, all forcing Cable to retreat to 3-day lows and extend further the rejection from monthly peaks in the 1.2200 zone seen earlier in the week.
In the UK, Chancellor Hunt announced the Spring Budget and now sees the domestic economy contracting just 0.2% this year vs. a projected expansion of 1.8% in 2024 and 2.5% in 2025. Regarding inflation, the OBR expects consumer prices to drop to 2.9% by the end of the current year. As already anticipated, the OBR noted that the economy will avoid entering a technical recession this year.
Next on the downside for GBP/USD comes the key 200-day SMA at 1.1891 ahead of the 2023 low at 1.1802 (March 8) and the November 2022 low at 1.1142 (November 4). Having said that, occasional bullish attempts should meet the initial barrier at the March high at 1.2203 (March 14) prior to the weekly top at 1.2269 (February 14) and the 2023 peak at 1.2447 (January 23). The surpass of the latter exposes the May 2022 high at 1.2666 (May 27) seconded by the 200-week SMA at 1.2873 and the psychological 1.3000 mark. The daily RSI retreated to the 51 region.
Resistance levels: 1.2203 1.2269 1.2401 (4H chart)
Support levels: 1.2010 1.1991 1.1802 (4H chart)
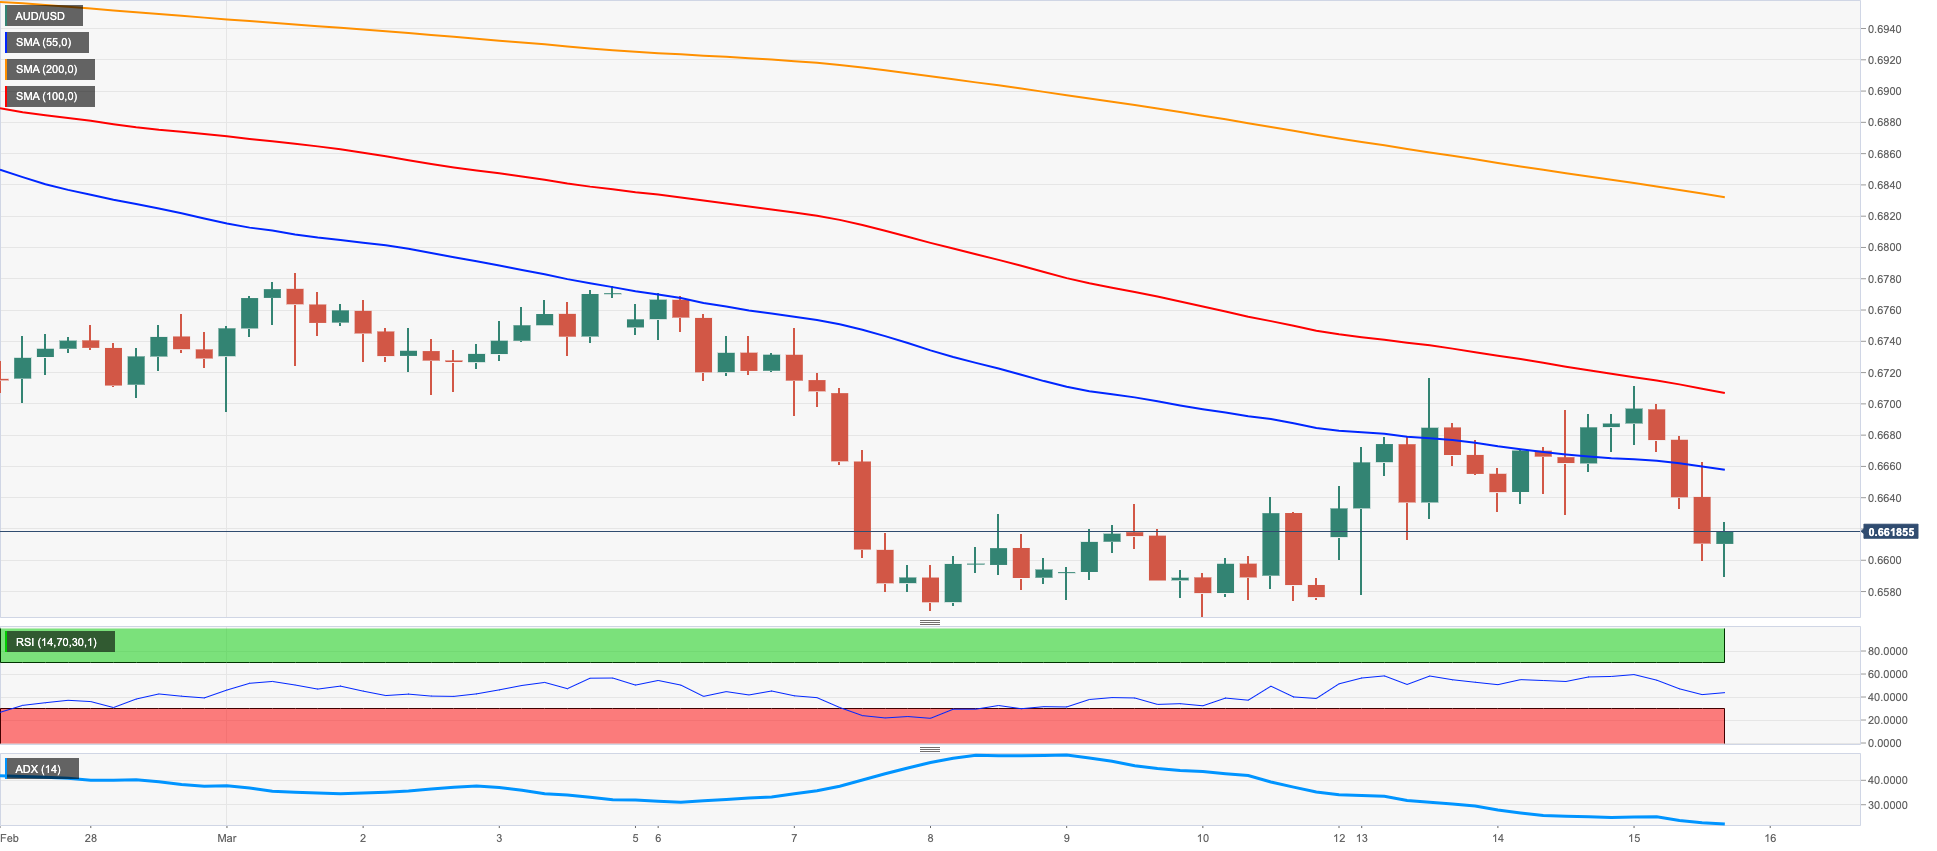
AUDUSD
Following the acute bounce in the greenback, AUD/USD gave away more than a cent and revisited the sub-0.6600 region on Wednesday.
The Aussie dollar, in the meantime, derived further weakness from the generalized negative performance in the commodity complex, always on the back of the strong comeback of the risk aversion in the global markets.
Absent data releases in Oz on Wednesday should leave all the attention to Thursday’s publication of Consumer Inflation Expectations for the month of March as well as the labour market report.
If bears push harder, AUD/USD could revisit the 2023 low at 0.6563 (March 10) prior to the weekly low at 0.6386 (November 10 2022) and the November 2022 low at 0.6272 (November 3). On the flip side, the weekly high at 0.6716 (March 13) emerges as the initial up-barrier seconded by the key 200-day SMA at 0.6770 and another weekly top at 0.6783 (March 1). Extra gains from here could revisit the temporary 55-day SMA at 0.6866 ahead of the weekly peak at 0.6920 (February 20) and key round level at 0.7000, which is closely followed by the weekly high at 0.7029 (February 14). The daily RSI made a U-turn and dropped to the 37 zone.
Resistance levels: 0.6716 0.6774 0.6855 (4H chart)
Support levels: 0.6589 0.6563 0.6386 (4H chart)
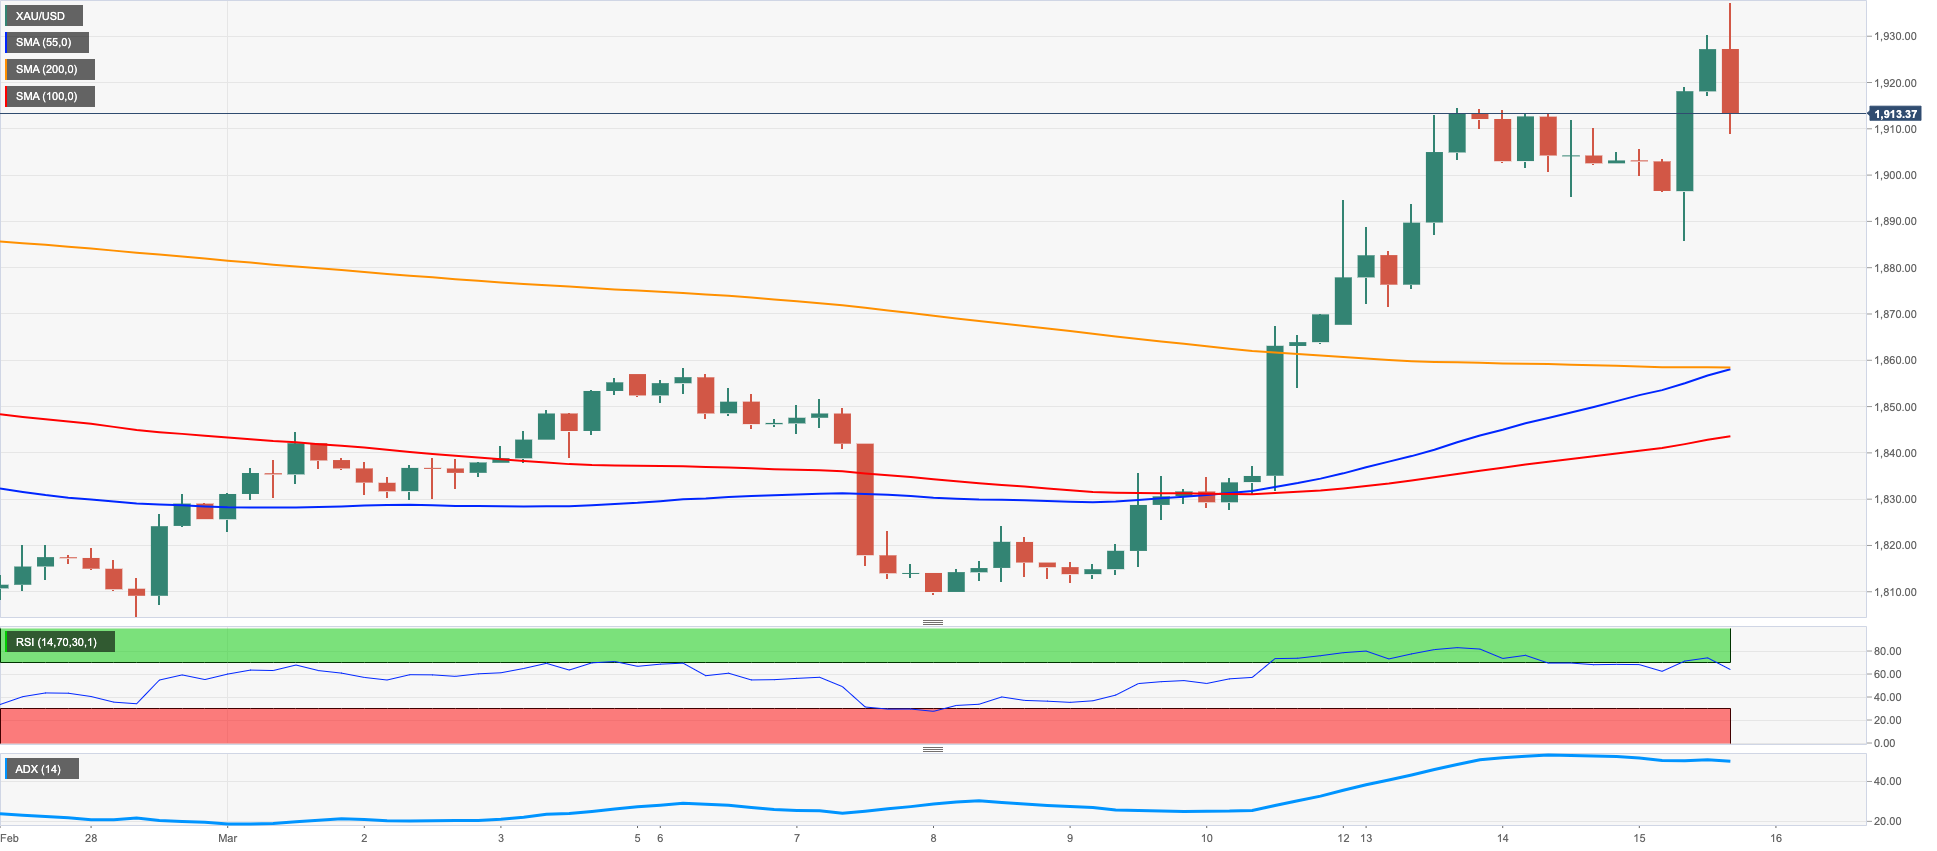
GOLD
Prices of the ounce troy of the yellow metal climbed to fresh 6-week highs near $1935 on Wednesday, adding to the ongoing sharp recovery from as low as the $1800 region seen during last week.
The re-emergence of the risk aversion on the back of mounting concerns around the banking sector on both sides of the ocean as well as the strong pullback in US yields across the curve, all collaborated with another positive session in the precious metal, which has almost fully recovered February’s decline.
Moving forward, price action around bullion should face the next risk event at the ECB interest rate decision on Thursday, while jitters following headlines around Credit Suisse and the banking sector in general are likely to add to the ongoing buying interest around gold.
In light of the ongoing needle-like rebound, gold now faces the next resistance level at the 2023 top at $1959 (February 2) prior to the April 2022 peak at $1998 (April 18) and the psychological $2000 mark. Just the opposite, the 55- and 100-day SMA at $1871 and $1815, respectively, should emerge as temporary contention levels ahead of the March low at $1809 (March 8), seconded by the 2023 low at $1804 (February 28) and the key $1800 region. Once the metal breaks below this level, it could put the key 200-day SMA at $1776 to the test prior to the weekly low at $1727 (November 23) and the November 2022 low at $1616 (November 3).
Resistance levels: $1937 $1959 $1998 (4H chart)
Support levels: $1885 $1860 $1842 (4H chart)
CRUDE WTI
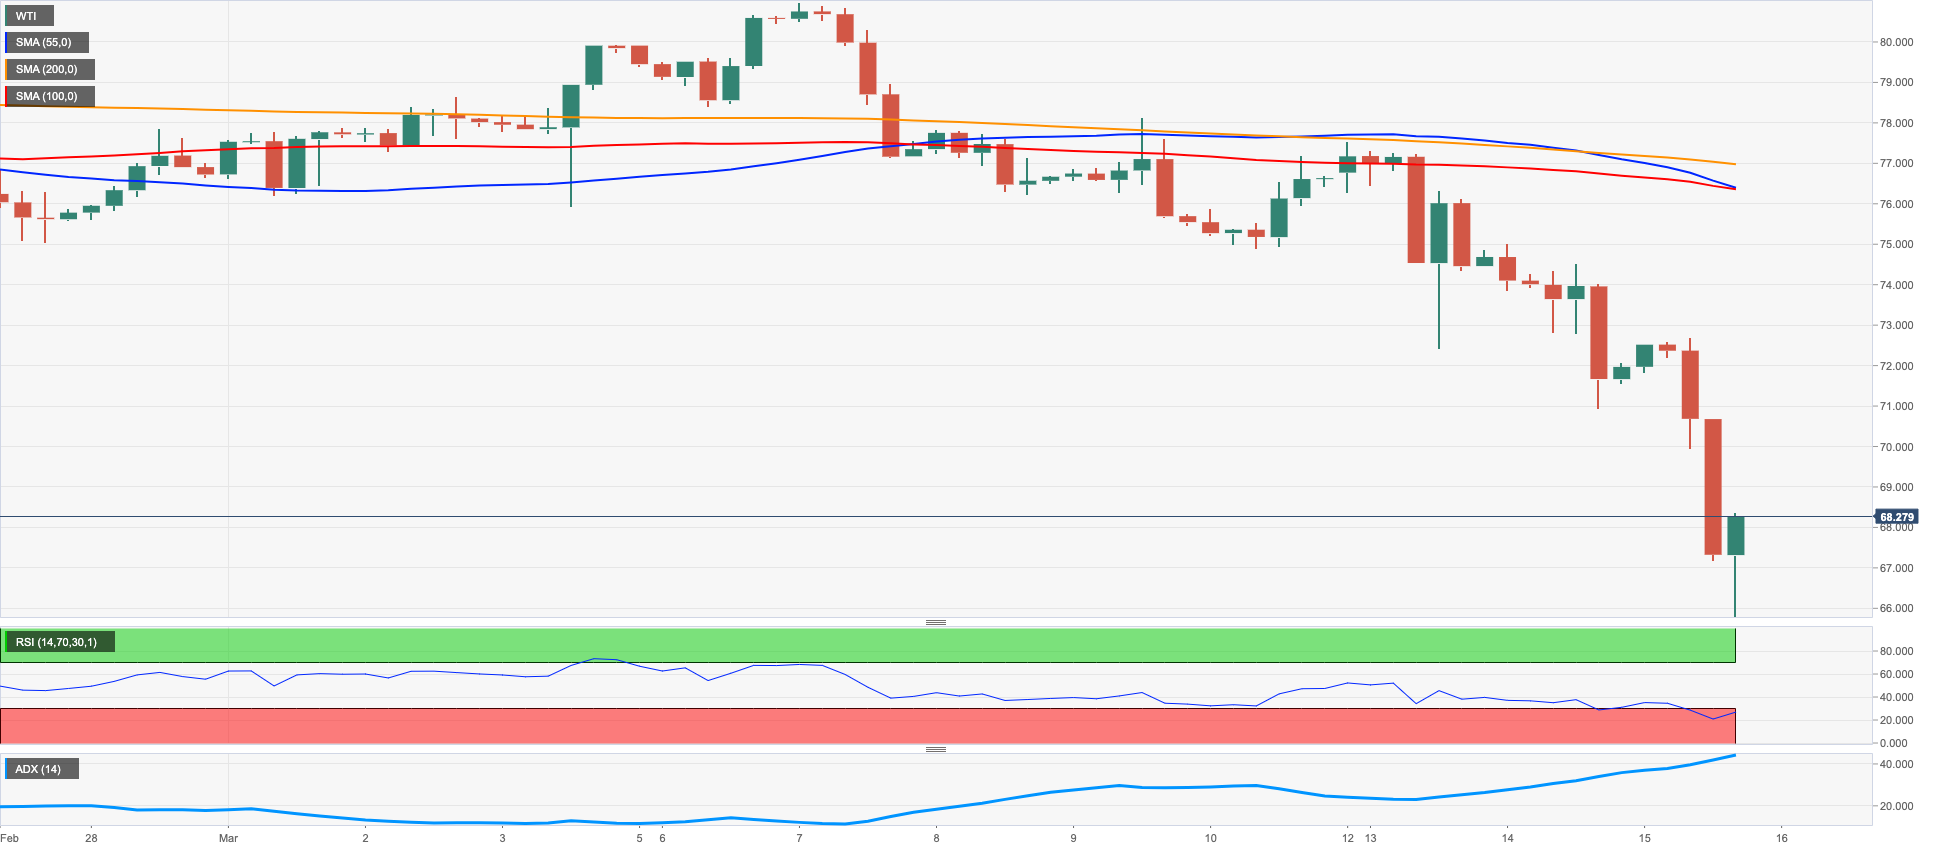
There was no respite for the decline in prices of the WTI on Wednesday either. Since January, prices of the barrel of the American reference for the sweet light crude oil retreated nearly 18%.
In fact, prices of the barrel of the WTI retreated to levels last traded back in December 2021 below the $66.00 mark following mounting concerns over a potential banking crisis that could now go global in response to worrying headlines from top European lender Credit Suisse and following the collapse of Silicon Valley Bank and the Signature Bank in the US in past days.
Adding fuel to the fire, the demand for the safe haven space kept the US dollar well bid and the EIA reported an unexpected 1.550M barrels build in US crude oil inventories in the week to March 10. In addition, supplies at Cushing shrank by 1.916M barrels, Weekly Distillate Stocks dropped by 2.537M barrels and gasoline stockpiles went down by 2.061M barrels.
In case sellers remain in control of the sentiment around the commodity, the WTI could revisit the December 2021 low at $62.46 (December 2) ahead of the August 2021 low at $61.76 (August 23). The other way around, bouts of strength could see the provisional 55- and 100-day SMAs at $77.31 and $79.10, respectively, revisited prior to the March peak at $80.90 (March 7) and the 2023 peak at $82.60 (January 23).
Resistance levels: $74.39 $76.93 $80.90 (4H chart)
Support levels: $65.72 $62.42 $61.72 (4H chart)
GER40
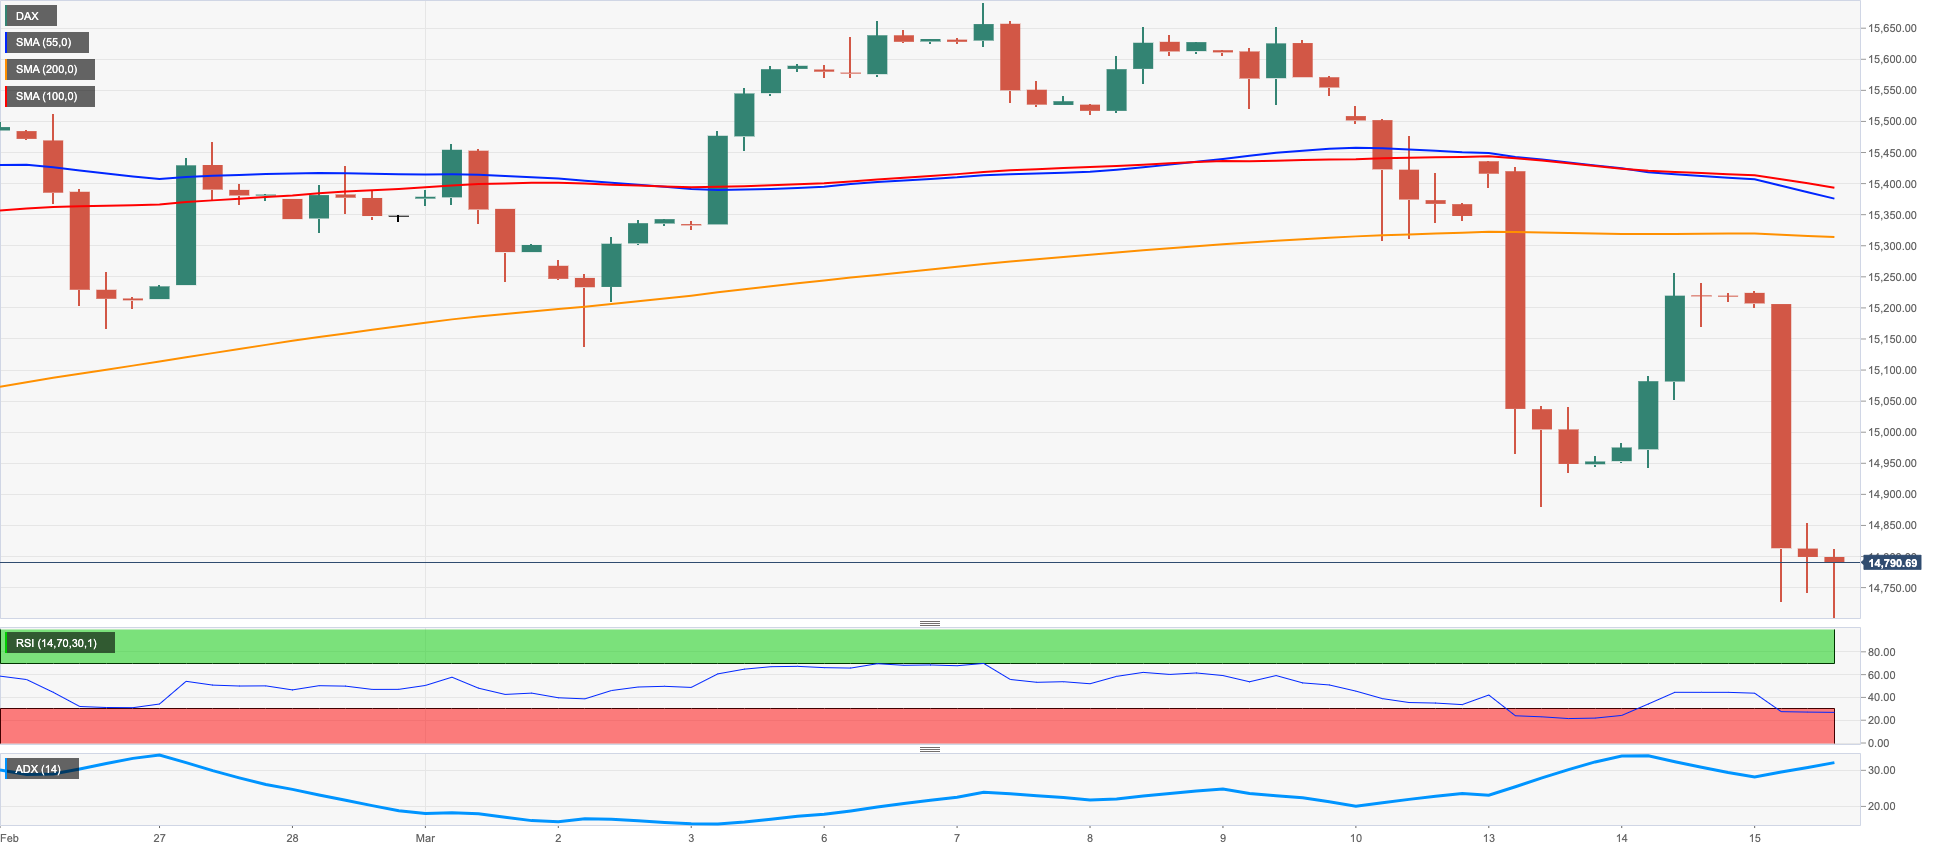
The German reference stock index DAX40 plummeted more than 3% and closed Wednesday’s session in fresh 2-month lows around the 14700 region.
Increasing fears around a potential contagion that could lead to a generalized crisis in the banking sector spooked investors and left the door wide open to sellers to return to the markets in a context dominated with unabated risk aversion.
In the money market, the German 10-year Bund yields resumed the downside and slipped back to multi-week lows near 2.10%, in line with the rest of their global peers.
In Germany, Wholesale Prices rose 0.1% MoM in February and 8.9% on a yearly basis. In addition, the Current Account surplus shrank to €16.2B in January.
The continuation of the downward bias in the DAX40 could see the temporary 100-day SMA at 14648 revisited in the near term ahead of the more significant 200-day SMA at 13829 and the December 2022 low at 13791 (December 13). For all that, the 2023 top at 15706 (March 6) remains as the immediate magnet for bulls before the February 2022 peak at 15736 (February 2 2022). The breakout of the latter could spark a potential test of the round level at 16000 prior to the 2022 high at 16285 (January 5). The daily RSI collapsed to the vicinity of 36.
Best Performers: Qiagen, E.ON SE, Deutsche Telekom AG
Worst Performers: Deutsche Bank AG, Commerzbank, Siemens Energy AG
Resistance levels: 15272 15706 15912 (4H chart)
Support levels: 14702 14388 13791 (4H chart)
NASDAQ
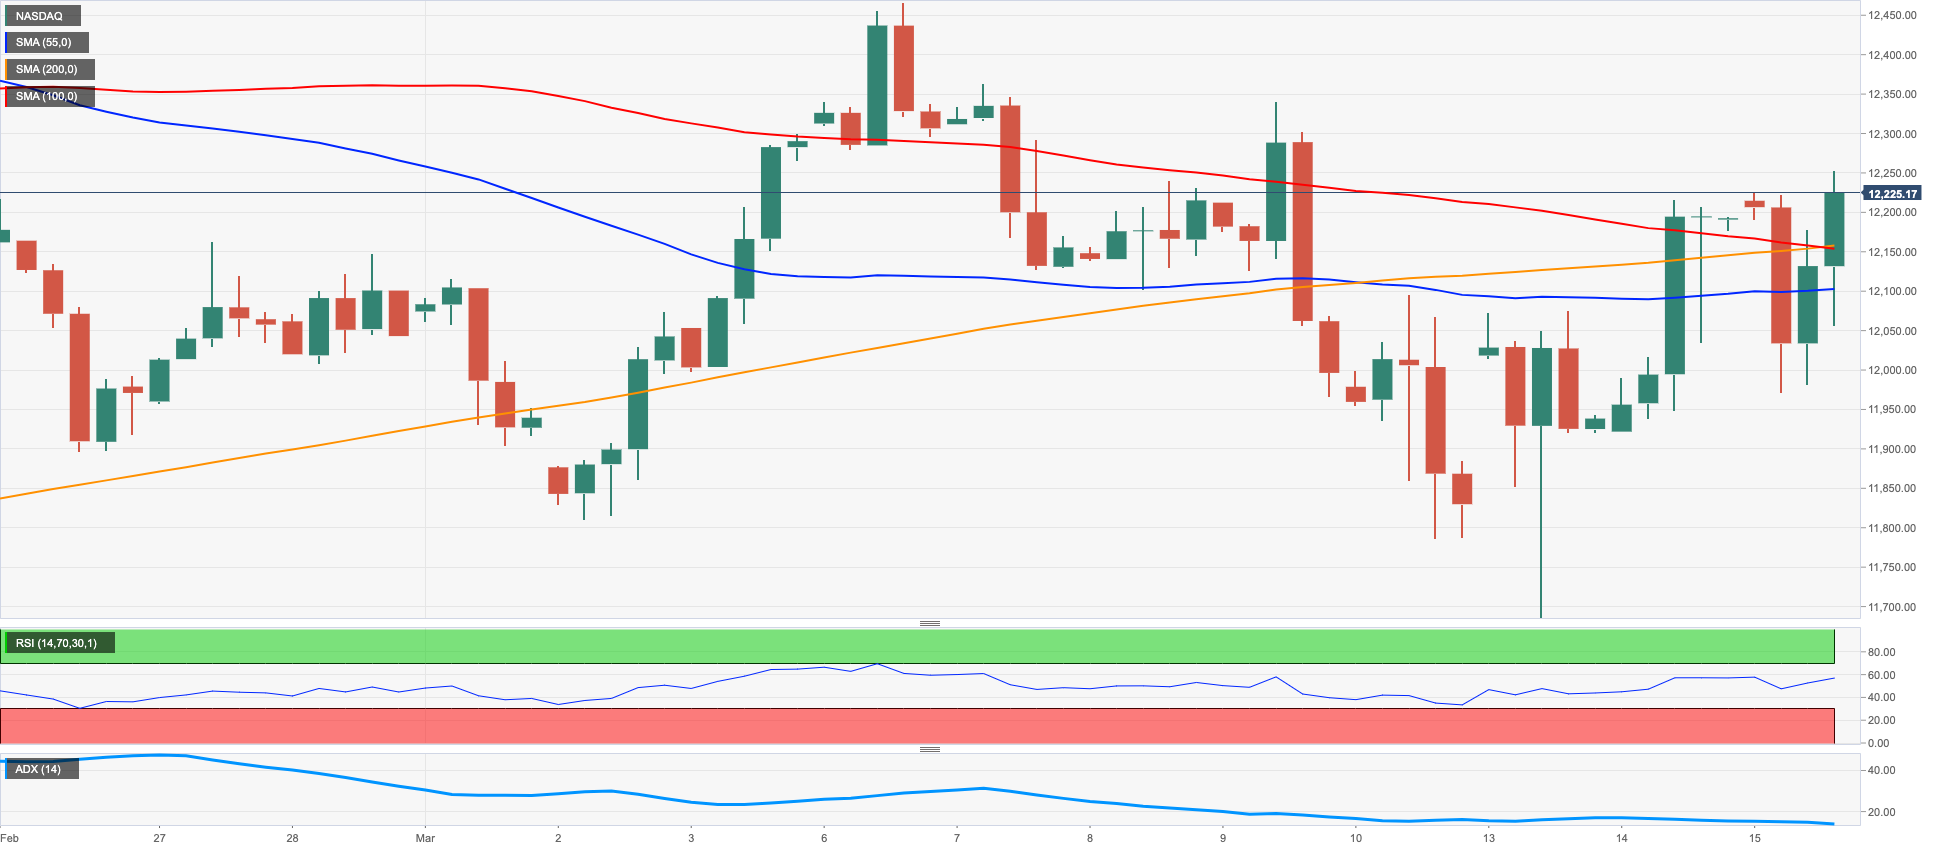
The tech benchmark index Nasdaq 100 managed to leave behind the initial pessimism and bounced off the proximity of the 11000 mark to clinch the third consecutive daily advance on Wednesday, as the greenback surrendered some gains and the risk aversion that prevailed throughout most of the session lost some momentum.
Jitters around a potential contagion effect in response to negative news from the Swill lender Credit Suisse weighed heavily on the risk-associated assets and kept the mood among investors depressed, although the sharp decline in US yields across the curve seem to have somehow limited the downside potential in the index.
The Nasdaq 100 now faces the next support at the 200-day SMA at 11904 prior to the March low at 11695 (March 13) and just ahead of the provisional 100-day SMA at 11683. South from here comes weekly lows at 11550 (January 25) and 11251 (January 19) prior to the 2023 low at 10696 (January 6) and the December 2022 low at 10671 (December 22). By contrast, the March peak at 12466 (March 6) aligns as the immediate up-barrier followed by the weekly high at 12689 (February 15) and the 2023 top at 12880 (February 2). Once the latter is cleared, the index could dispute the round level at 13000 before the weekly peak at 13175 (August 26 2022). The daily RSI receded to the proximity of 51.
Top Gainers: Sirius XM, Xcel Energy, Netflix
Top Losers: Diamondback, Enphase, Baker Hughes
Resistance levels: 12217 12466 12880 (4H chart)
Support levels: 11695 11251 11050 (4H chart)
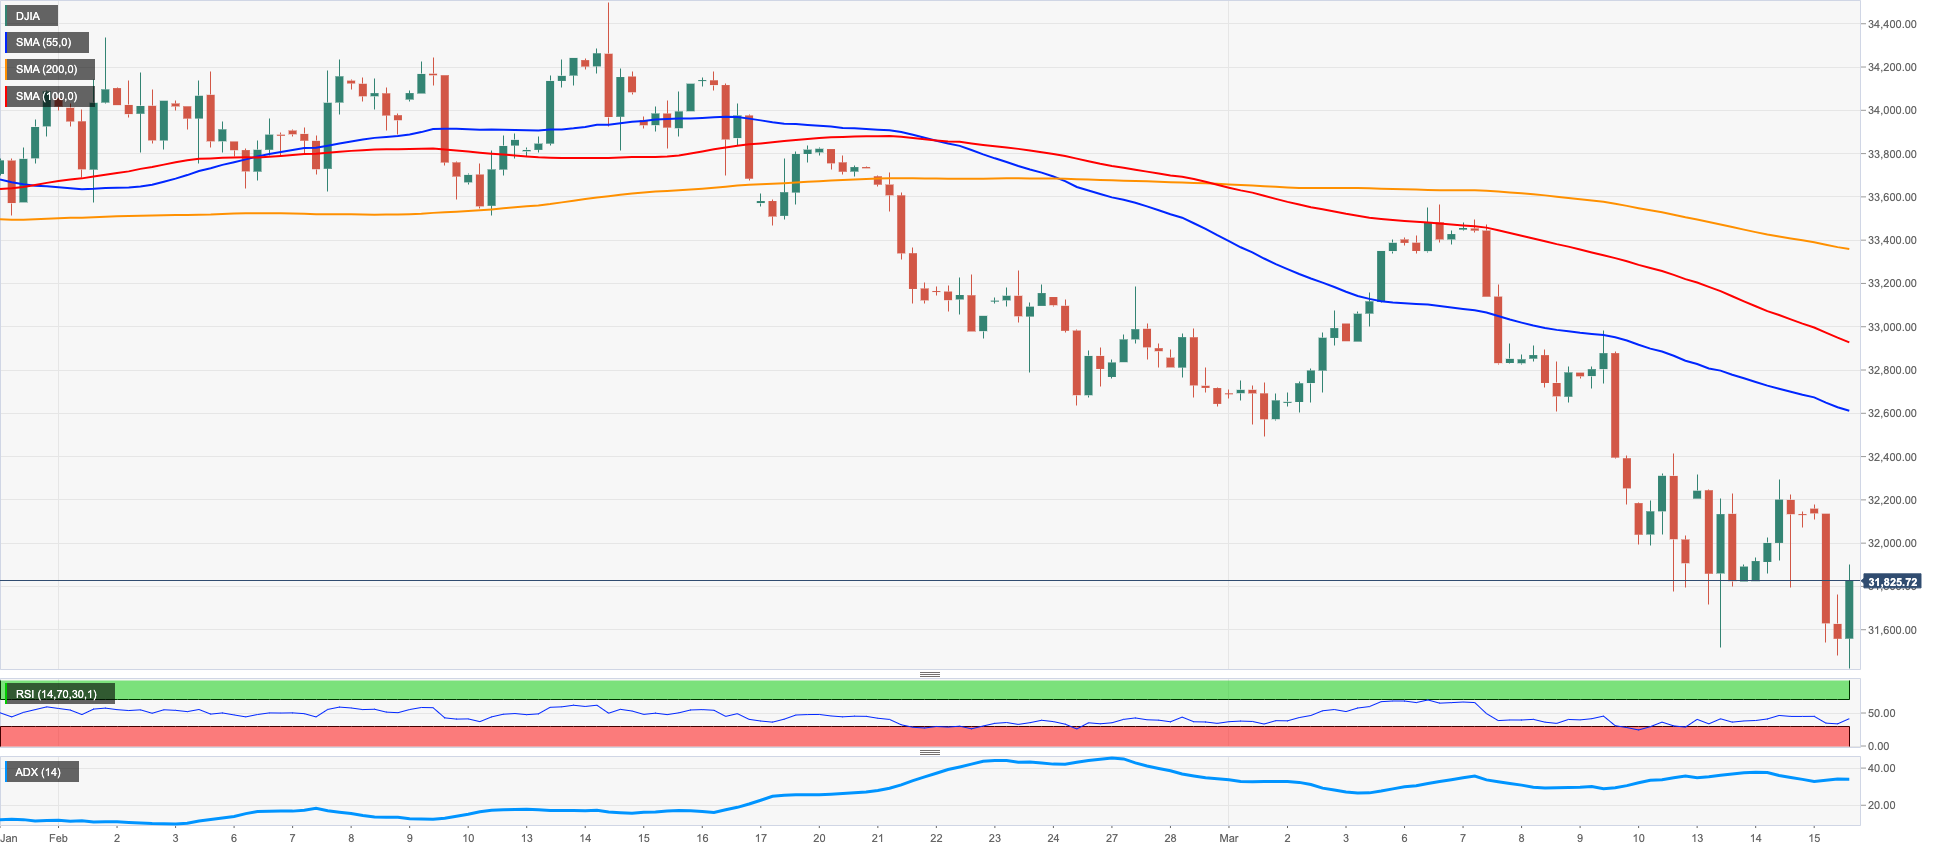
DOW JONES
Equities measured by the Dow Jones clocked new lows in levels last traded back in late October 2022 near 31400, as concerns over a potential crisis in the US and European banking systems fuelled a strong comeback of the risk aversion.
In fact, fears of a global crisis in the banking sector were reinforced following headlines from Credit Suisse, which saw its shares retreat to a record low of CHF 1.56 before closing at CHF 1.70, down nearly 25% for the day.
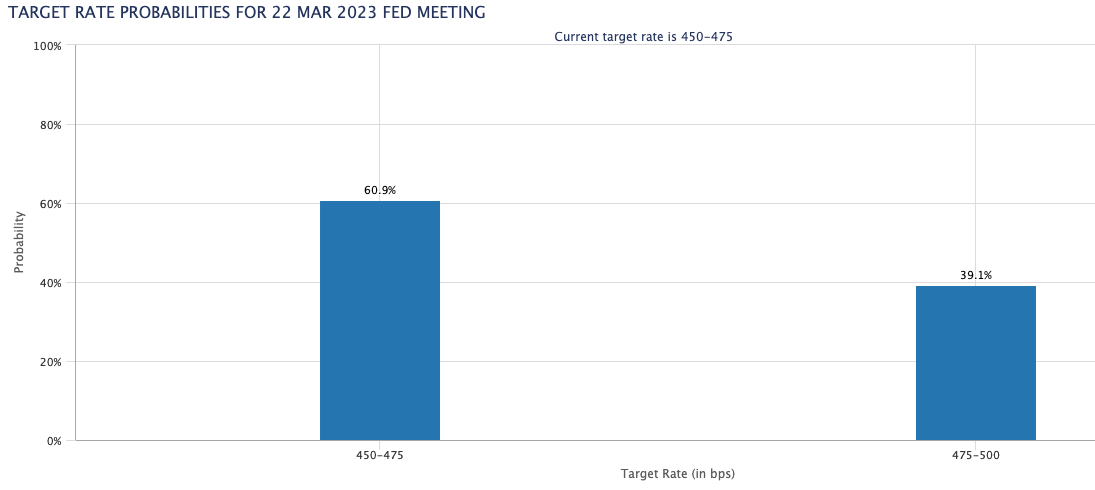
Around the Fed, CME Group’s FedWatch Tool now sees a 60% probability of a pause at the March gathering. This view now appears underpinned by the unexpected lower prints from US Producer Prices in February, which adds to the disinflation seen in the CPI over the last month.
All in all, the Dow Jones retreated 1.05% to 31818, the S&P500 dropped 0.84% to 3887 and the tech-heavy Nasdaq Composite held steady around 11417.
Next stop on the downside for the Dow Jones aligns the 2023 low at 31429 (March 15) ahead of the key 30000 mark and prior to the 2022 low at 28660 (October 13). On the opposite side, there is an initial hurdle at the key 200-day SMA at 32386 seconded by temporary resistance levels at the 100- and 55-day SMAs at 33294 and 33382, respectively, just before the March top at 33572 (March 6) and the 2023 peak at 34342 (January 13). The daily RSI grinded lower to the 32 neighbourhood.
Top Performers: Amgen, Microsoft, Merck&Co
Worst Performers: Boeing, JPMorgan, Goldman Sachs
Resistance levels: 32306 33255 33572 (4H chart)
Support levels: 31429 28660 26143 (4H chart)
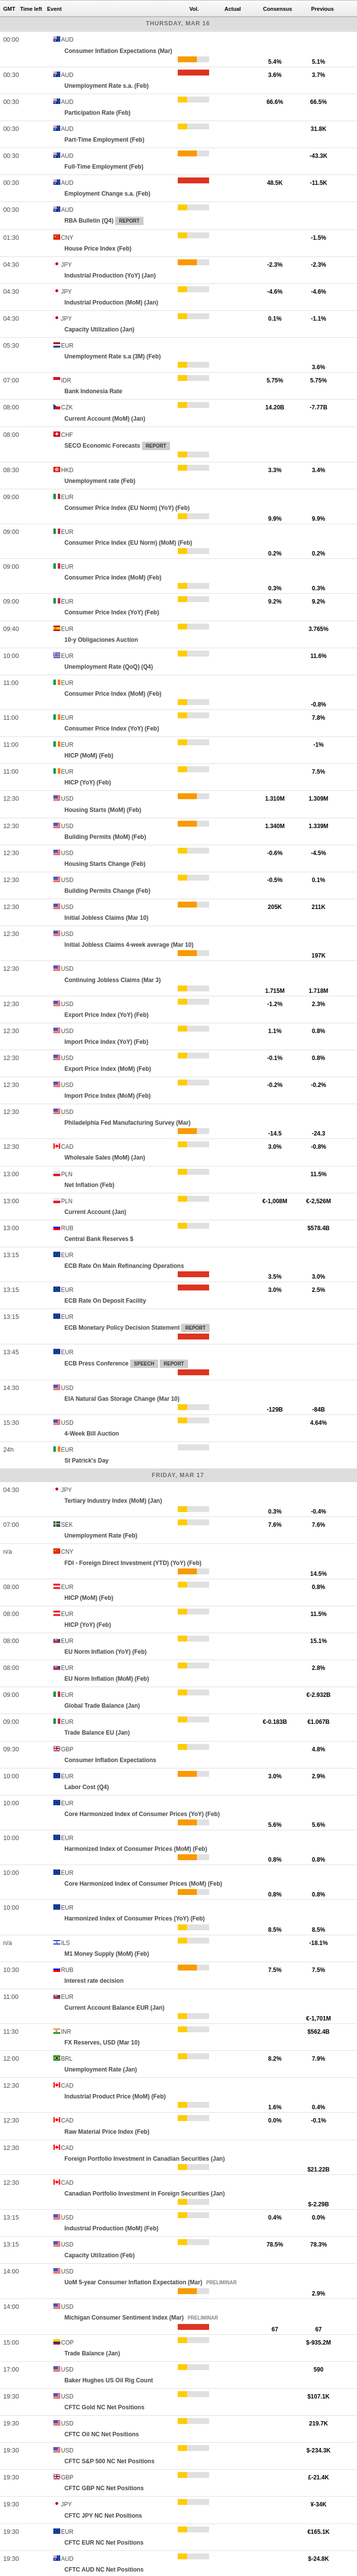
MACROECONOMIC EVENTS
All Information & Updates provided by:

All information relating to the financial markets available on this page has been prepared and issued by FXStreet (Forexstreet SL, Spain, Reg: B62498233) on the basis of publicly available information and all information believed to be reliable and does not conflict with Kuwaiti local laws, and all necessary care has been taken to before the company to ensure that the facts mentioned are correct from the source.
NCM Investment nor any of its directors or employees shall in any way be held responsible for the contents of this news, and the information contained on this page is intended only to provide clients with publicly available information and should not be construed as investment advice, report or analysis and/or constitute an offer or invitation to buy or sell financial instruments of any kind.
RISK WARNING: Forex and CFDs are highly risky leveraged products, as losses can exceed deposits. Please ensure you understand all the risks and take independent advice if necessary. NCM will segregate the clients based on the criteria of the regulator and its bylaws. NCM does not provide any advisory service; the material published does not constitute advice or a recommendation for a transaction in any financial instrument. NCM accepts no responsibility for any use of the content presented and any consequences of that use. Anyone acting on the information provided does so at their own risk.