
- Contact Us:
-

-

-

-


Daily Market Updates
17 Mar 2023
USDJPY
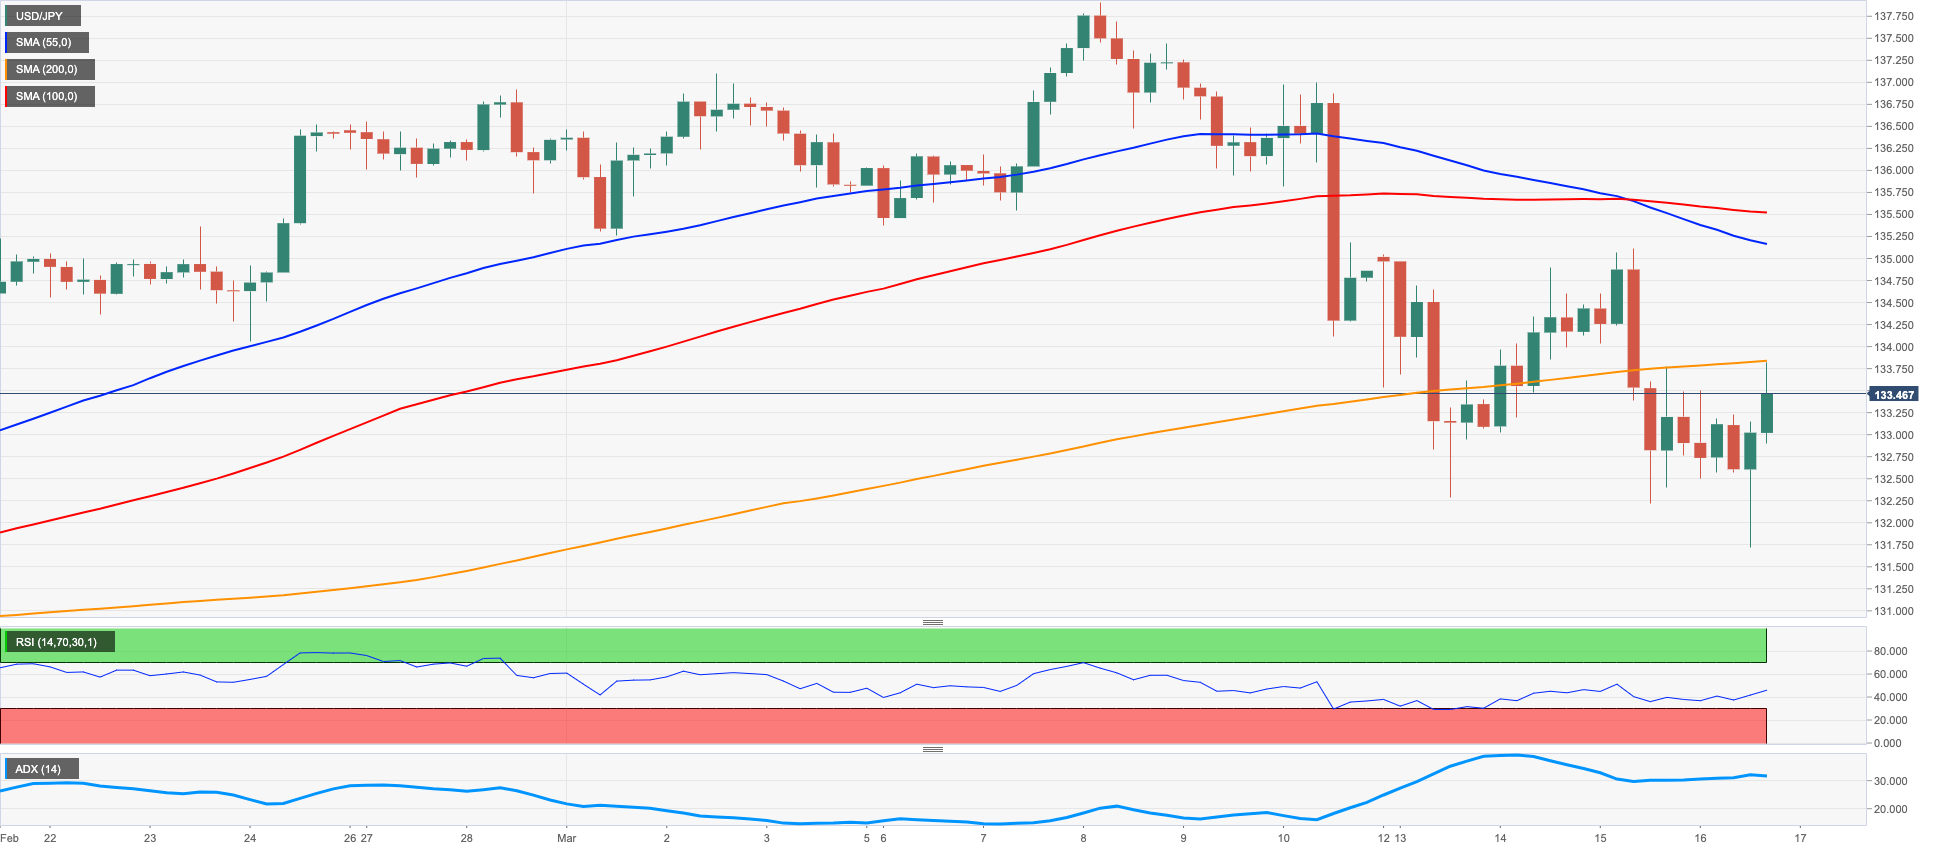
USD/JPY reversed an initial sharp drop to new 4-week lows near 131.70 and ended the session around Wednesday’s closing levels near 133.40 on Thursday.
In fact, the pair ignored the corrective decline in the greenback and appeared propped up by the generalized upward bias in US yields across the curve.
In addition, receding risk aversion – mainly on the back of now positive news around Credit Suisse - appeared to have also collaborated with the daily uptick in the pair.
In the Japanese calendar, Foreign Bond Investment rose to ¥909.5B in the week to March 11, while the trade deficit shrank to ¥897.7B in February and Machinery Orders expanded 4.5% in the year to January. Finally, Industrial Production contracted at an annualized 3.1% also in January.
If the selling pressure gathers impulse, then USD/JPY could challenge the key 130.00 zone closely followed by the weekly low at 129.79 (February 10). Down from here emerges the February low at 128.08 (February 2) seconded by the 2023 low at 127.21 (January 16). Having said that, there is a minor hurdle at the weekly top at 135.11 (March 15) just before the interim 100-day SMA at 135.41 and the key 200-day SMA at 137.47. Once the latter is cleared, the pair could advance to the 2023 peak at 137.91 (March 8) followed by weekly highs at 138.17 (December 15 2022) and 139.89 (November 30 2022), all ahead of the key round level at 140.00 and the weekly top at 142.25 (November 21 2022). The daily RSI looked unchanged around 45.
Resistance levels: 133.70 135.11 136.99 (4H chart)
Support levels: 131.71 129.79 128.08 (4H chart)
GBPUSD
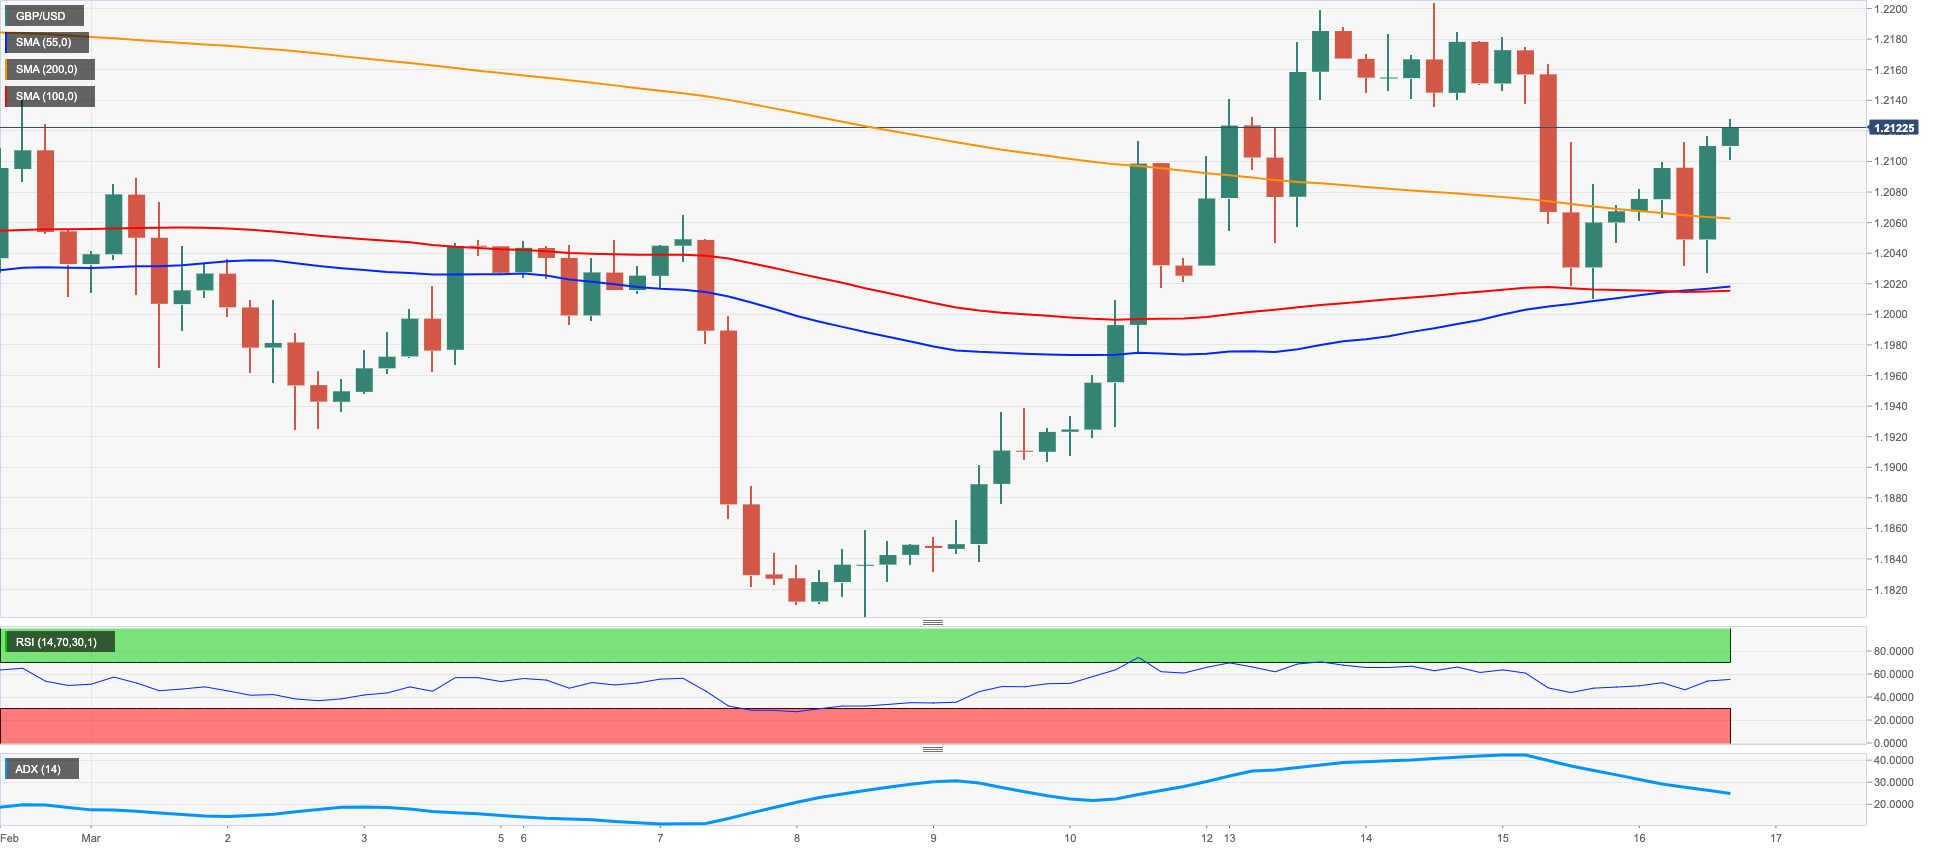
GBP/USD regained the smile and advanced markedly on Thursday, reversing at the same time two consecutive daily pullbacks.
The improvement in the Sterling came in line with the broad-based upbeat mood in the risk complex amidst dwindling risk aversion and the moderate selling impulse in the greenback.
Cable, in the meantime, managed to surpass the 1.2100 hurdle, where it also met some initial contention in an area where the 55-day SMA also converges.
There were no data releases scheduled across the Channel on Thursday.
Price action around GBP/USD appears unclear for the time being. Next on the upside comes the March top at 1.2203 (March 14) seconded by the weekly peak at 1.2269 (February 14) and ahead of the 2023 high at 1.2447 (January 23). If Cable surpasses this level it could then revisit the May 2022 top at 1.2666 (May 27) prior to the 200-week SMA at 1.2873 and the psychological 1.3000 yardstick. On the other hand, the key 200-day SMA at 1.1889 is expected to initially hold the downside before the 2023 low at 1.1802 (March 8) and the November 2022 low at 1.1142 (November 4). The daily RSI bounced past the 53 level.
Resistance levels: 1.2203 1.2269 1.2401 (4H chart)
Support levels: 1.2010 1.1991 1.1802 (4H chart)
AUDUSD
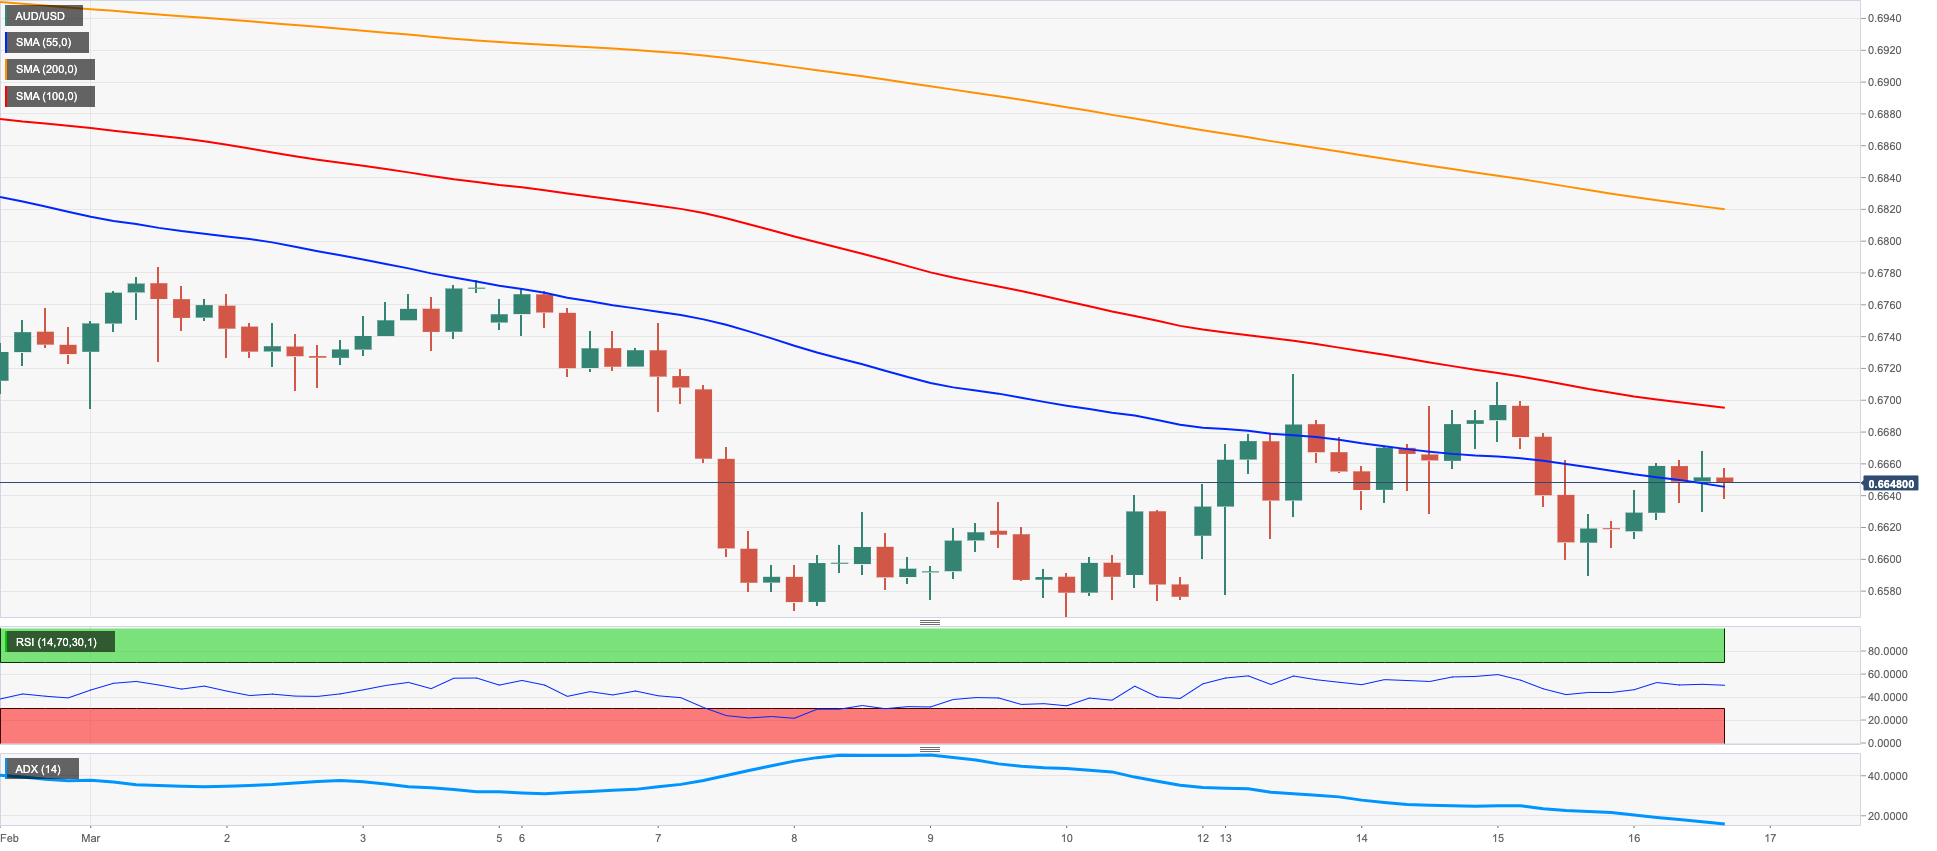
AUD/USD partially reversed Wednesday’s daily decline and clocked decent gains well north of 0.6600 the figure on Thursday.
The knee-jerk in the greenback helped the Aussie dollar recoup part of the ground lost in the previous session, while solid prints from the Australian jobs report also underpinned the bid bias in the currency.
On the latter, the Employment Change rose by 64.6K people in February and the Unemployment Rate ticked lower to 3.5% in the same month. In addition, Consumer Inflation Expectations edged a tad lower to 5% in March (from 5.1%).
Spot also derived extra strength from the mixed performance in the commodity complex after copper prices left behind two sessions in a row with losses and the iron ore advanced marginally.
Immediately to the upside in AUD/USD emerges the weekly top at 0.6716 (March 13) ahead of the key 200-day SMA at 0.6764 just before another weekly peak at 0.6783 (March 1). If the pair clears the latter, it could then confront the provisional 55-day SMA at 0.6864 prior to the weekly high at 0.6920 (February 20) and the key round level at 0.7000. In opposition, sellers should meet the next obstacle at the 2023 low at 0.6563 (March 10) ahead of the weekly low at 0.6386 (November 10 2022) and the November 2022 low at 0.6272 (November 3). The daily RSI rose to the boundaries of the 41 region.
Resistance levels: 0.6716 0.6774 0.6855 (4H chart)
Support levels: 0.6589 0.6563 0.6386 (4H chart)
GOLD
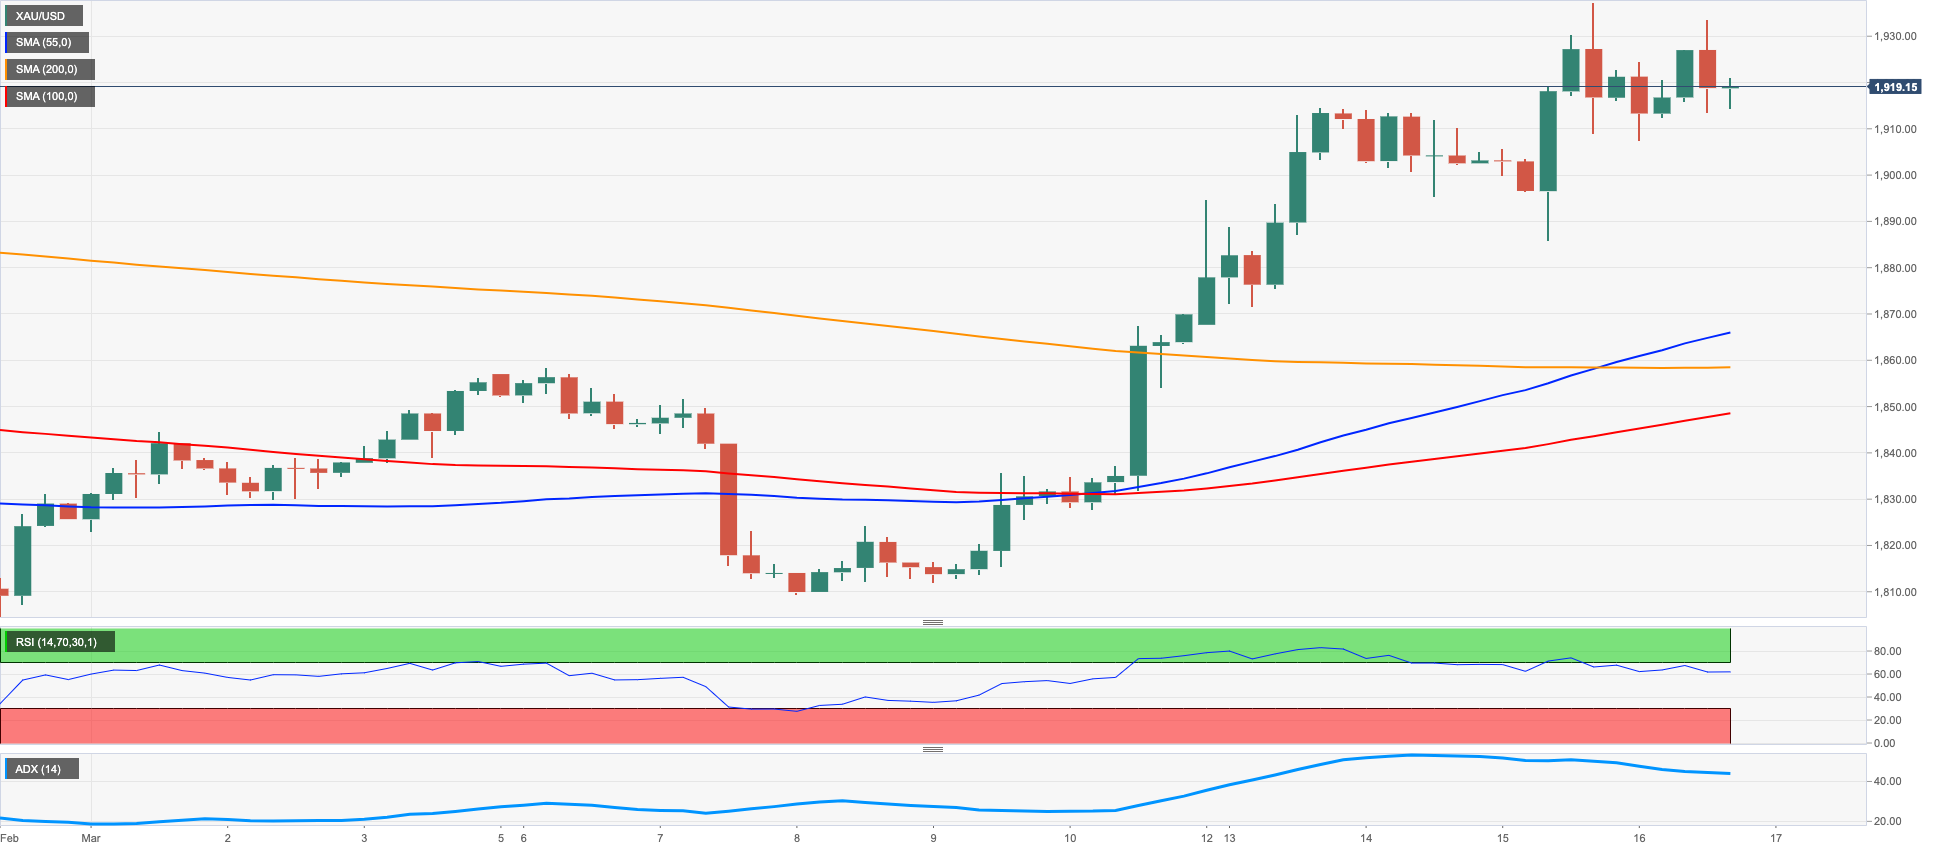
Gold prices navigated in an inconclusive session on Thursday, although it managed to keep business in the upper end of the recent range above the key $1900 mark per ounce troy.
Renewed weakness in the greenback emerged as supportive drivers for further upside in the yellow metal, while the small recovery in US yields across the curve and diminishing risk aversion limited the upside.
The next risk event for the precious metal now comes with the FOMC event on March 22, where the Committee is largely expected to raise the Fed Funds Target Range by 25 bps.
Immediately to the upside in gold now aligns the March top at $1937 (March 15) ahead of the 2023 peak at $1959 (February 2). Extra gains from here should retest the April 2022 high at $1998 (April 18) prior to the psychological $2000 mark. On the flip side, interim contention lines up at the 55- and 100-day SMA at $1872 and $1817, respectively, before the March low at $1809 (March 8) and the 2023 low at $1804 (February 28). The latter underpins the key $1800 region and precedes the key 200-day SMA at $1776. Further down comes the weekly low at $1727 (November 23) ahead of the November 2022 low at $1616 (November 3).
Resistance levels: $1937 $1959 $1998 (4H chart)
Support levels: $1885 $1860 $1847 (4H chart)
CRUDE WTI
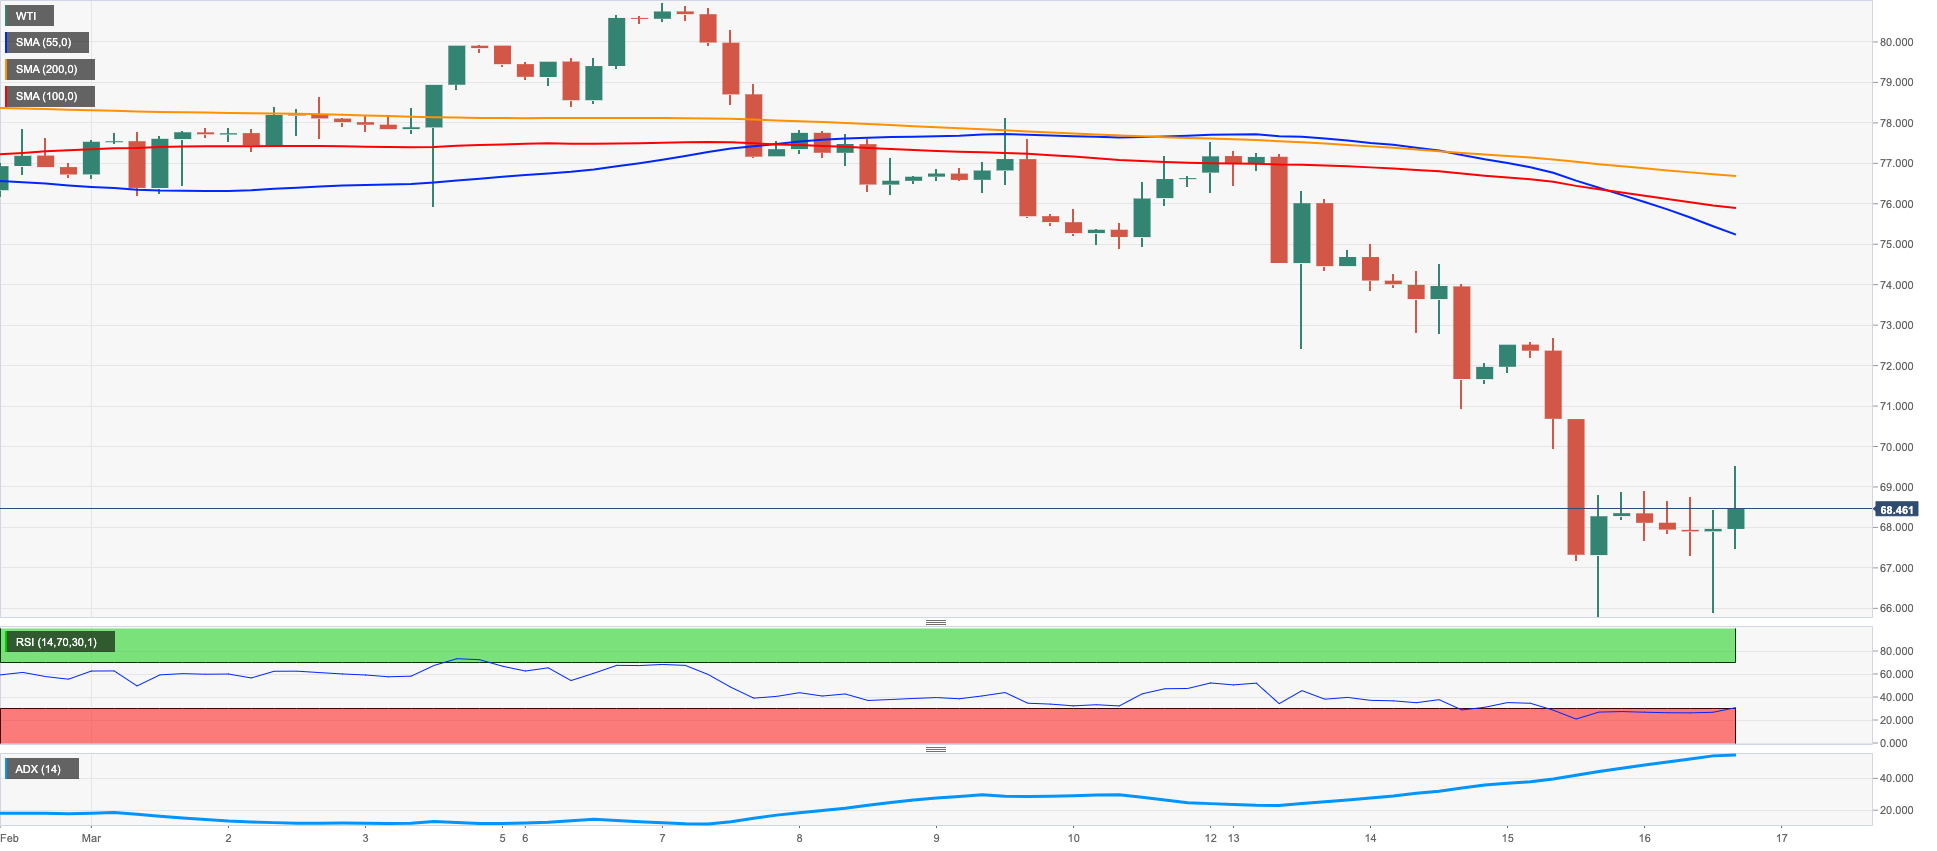
Prices of the WTI remained under pressure and alternated gains with losses after bottoming out in the area of recent 16-month lows near $65.60 on Thursday.
Despite fears of some kind of financial crisis were mitigated following positive news from the Swiss National Bank (SNB) and Credit Suisse, traders remained concerned over the probability of a recession in the next months that could severely impact the demand for crude oil, all in response to the persistent tightening bias from major central banks.
Also weighing on the sentiment emerged the unexpected weekly build in US crude oil inventories (+1.550M barrels), as reported by the EIA on Wednesday.
On the positive side, the commodity appeared somewhat supported by the meeting between Saudi Arabia and Russia, where the market’s stability was in the centre of the debate.
Prices of the WTI face the next contention at the so far 2023 low at $65.72. The breakdown of this level carries the potential to spark a deeper move to the December 2021 low at $62.46 (December 2) prior to the August 2021 low at $61.76 (August 23). On the contrary, the 55- and 100-day SMAs at $77.16 and $78.95 offer temporary resistance, respectively, ahead of the March high at $80.90 (March 7) and followed by the 2023 high at $82.60 (January 23).
Resistance levels: $74.39 $76.57 $80.90 (4H chart)
Support levels: $65.64 $62.42 $61.72 (4H chart)
GER40
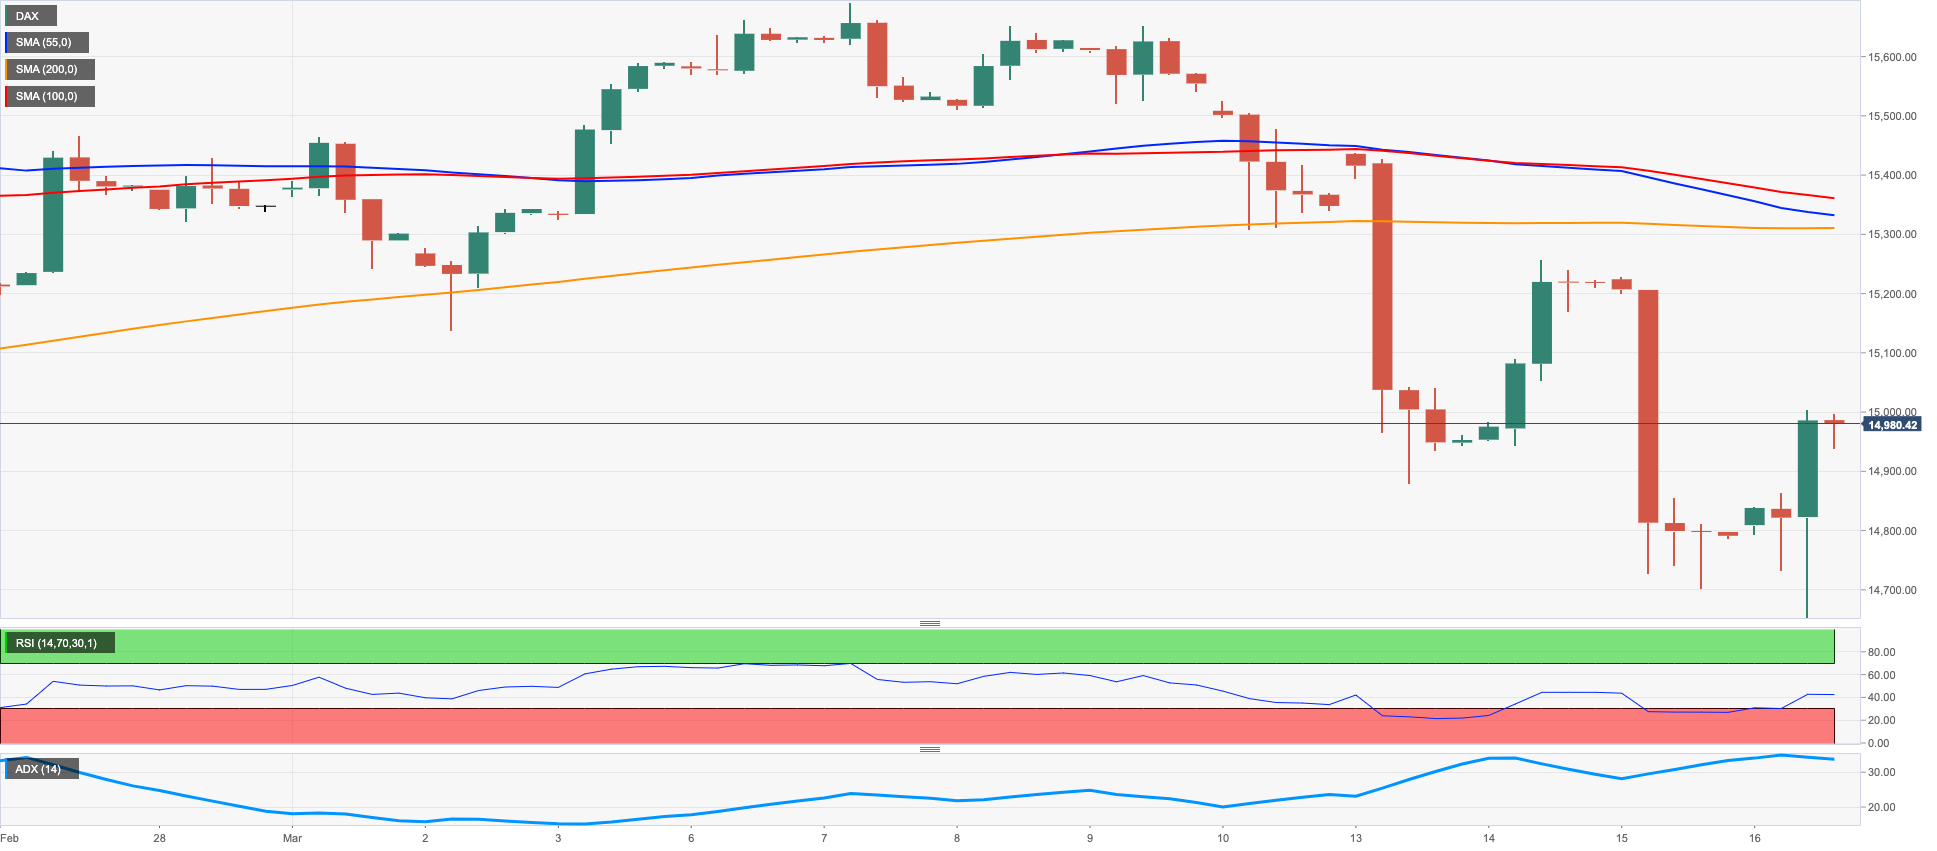
Following an earlier drop to new multi-week lows near 14600, the German stock reference DAX40 ended Thursday’s session with decent gains in the boundaries of the 15000 mark.
Indeed, German equities traded in a positive foot and followed the rest of their European peers in response to alleviate concerns around a potential contagion effect in the banking sector, all after Credit Suisse announced it will lend CHF50B from the Swiss National Bank (SNB).
Also bolstering the daily uptick, the ECB declined to give any hint on future decisions on the interest rate after hiking rates by 50 bps at its meeting earlier in the session, as broadly expected.
The optimism among investors echoed in the German money market, where the 10-year Bund yields rebounded to the 2.30% region.
The German Economy minister noted that a technical recession can now no longer be ruled out, although an occasional downturn is expected to be limited and transitory following recent auspicious economic and leading indicators.
In case the DAX40 breaks below the March low at 14664 (March 16), an area coincident with the interim 100-day SMA, it could then extend the drop to the key 200-day SMA at 13832 prior to the December 2022 low at 13791 (December 13). On the opposite side, the 55-day SMA emerges as a provisional resistance level at 15158 ahead of the 2023 peak at 15706 (March 6) and seconded by the February 2022 high at 15736 (February 2 2022). The breakout of this level could prompt the round level at 16000 to emerge on the horizon before the 2022 top at 16285 (January 5). The daily RSI bounced past the 62 yardstick.
Best Performers: Siemens Energy AG, E.ON SE, Deutsche Boerse
Worst Performers: Vonovia, Deutsche Bank AG, Continental AG
Resistance levels: 15272 15706 15912 (4H chart)
Support levels: 14664 14388 13791 (4H chart)
NASDAQ
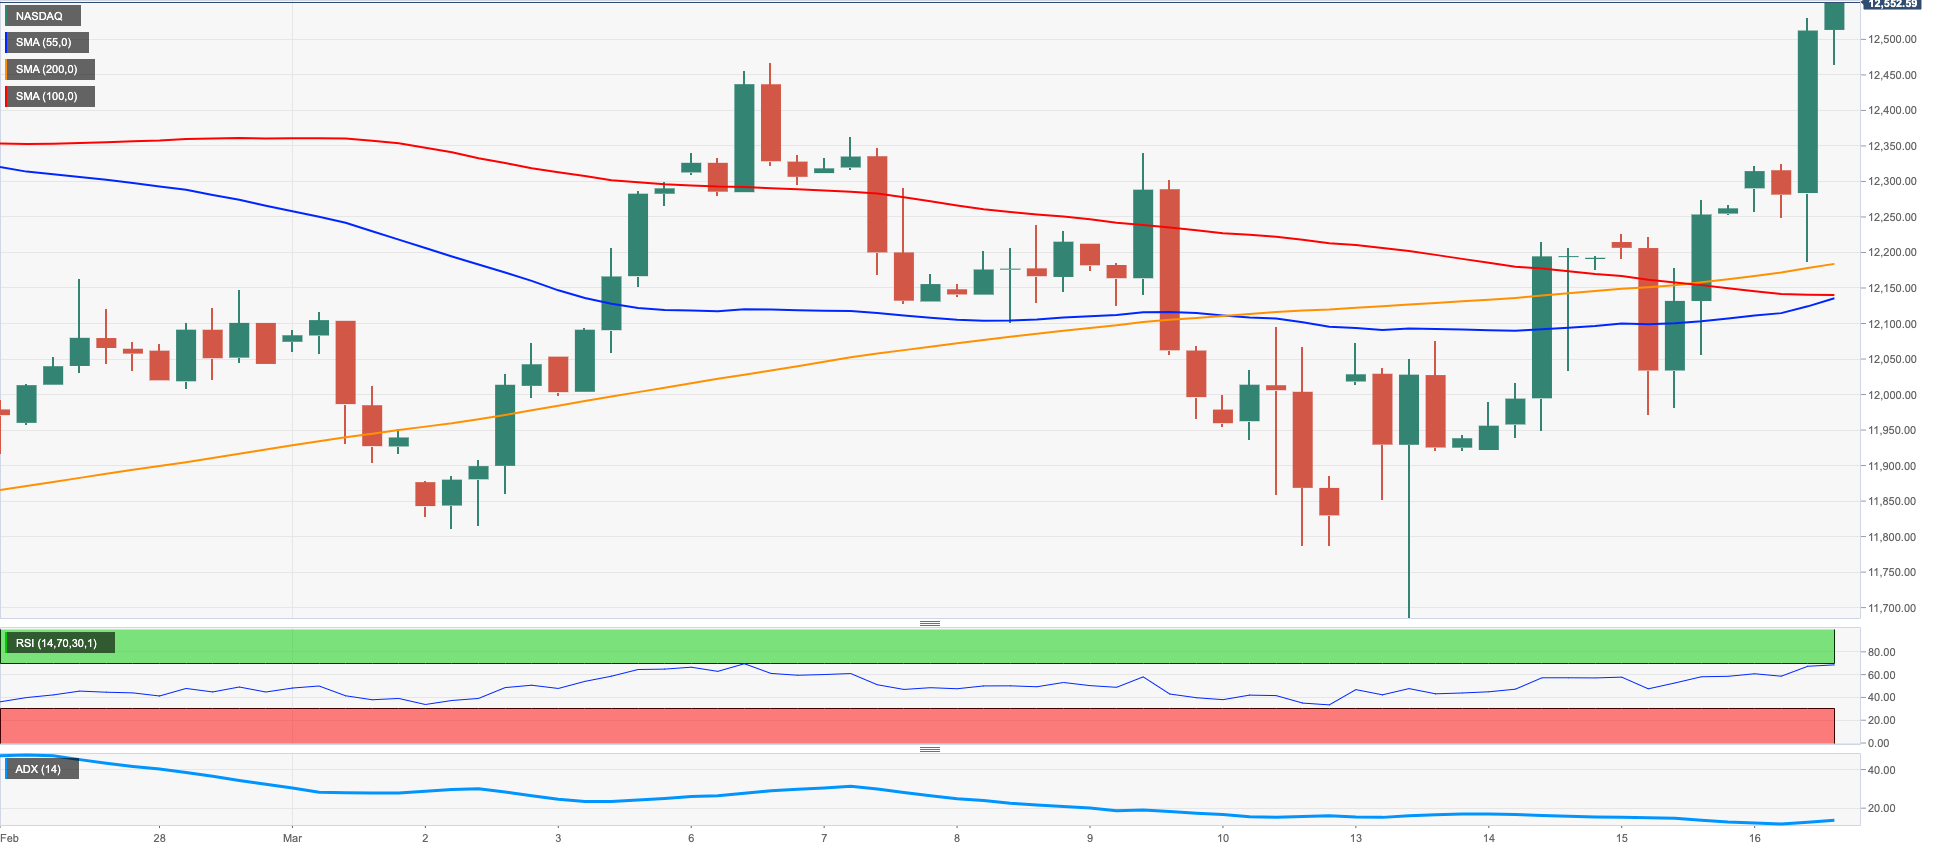
Tech equities measured by the Nasdaq 100 added to Wednesday’s uptick and rose to 4-week highs past the 12500 level on Thursday. It is worth noting that the index closed with gains uninterruptedly since Monday.
The continuation of the bullish mood in the tech sector followed the generalized optimism among market participants after some positive news from the European and US banking sectors brought in some relief and helped mitigate contagion fears.
Next on the upside for the Nasdaq 100 now appears the new March high at 12550 (March 16) ahead of the weekly top at 12689 (February 15) and the 2023 peak at 12880 (February 2). The surpass of this level could pave the way for a move to the round level at 13000 seconded by the weekly high at 13175 (August 26 2022). For all that, the key 200-day SMA at 11904 still offers decent support before the March low at 11695 (March 13), which is propped up by the temporary 100-day SMA. Once this region is cleared, the weekly lows at 11550 (January 25) and 11251 (January 19) are expected to come next ahead of the 2023 low at 10696 (January 6) and the December 2022 low at 10671 (December 22). The daily RSI advanced further and flirted with 60.
Top Gainers: Marvell, AMD, Intel
Top Losers: Enphase, Regeneron Pharma, T-Mobile US
Resistance levels: 12550 12689 12880 (4H chart)
Support levels: 11695 11251 11050 (4H chart)
DOW JONES
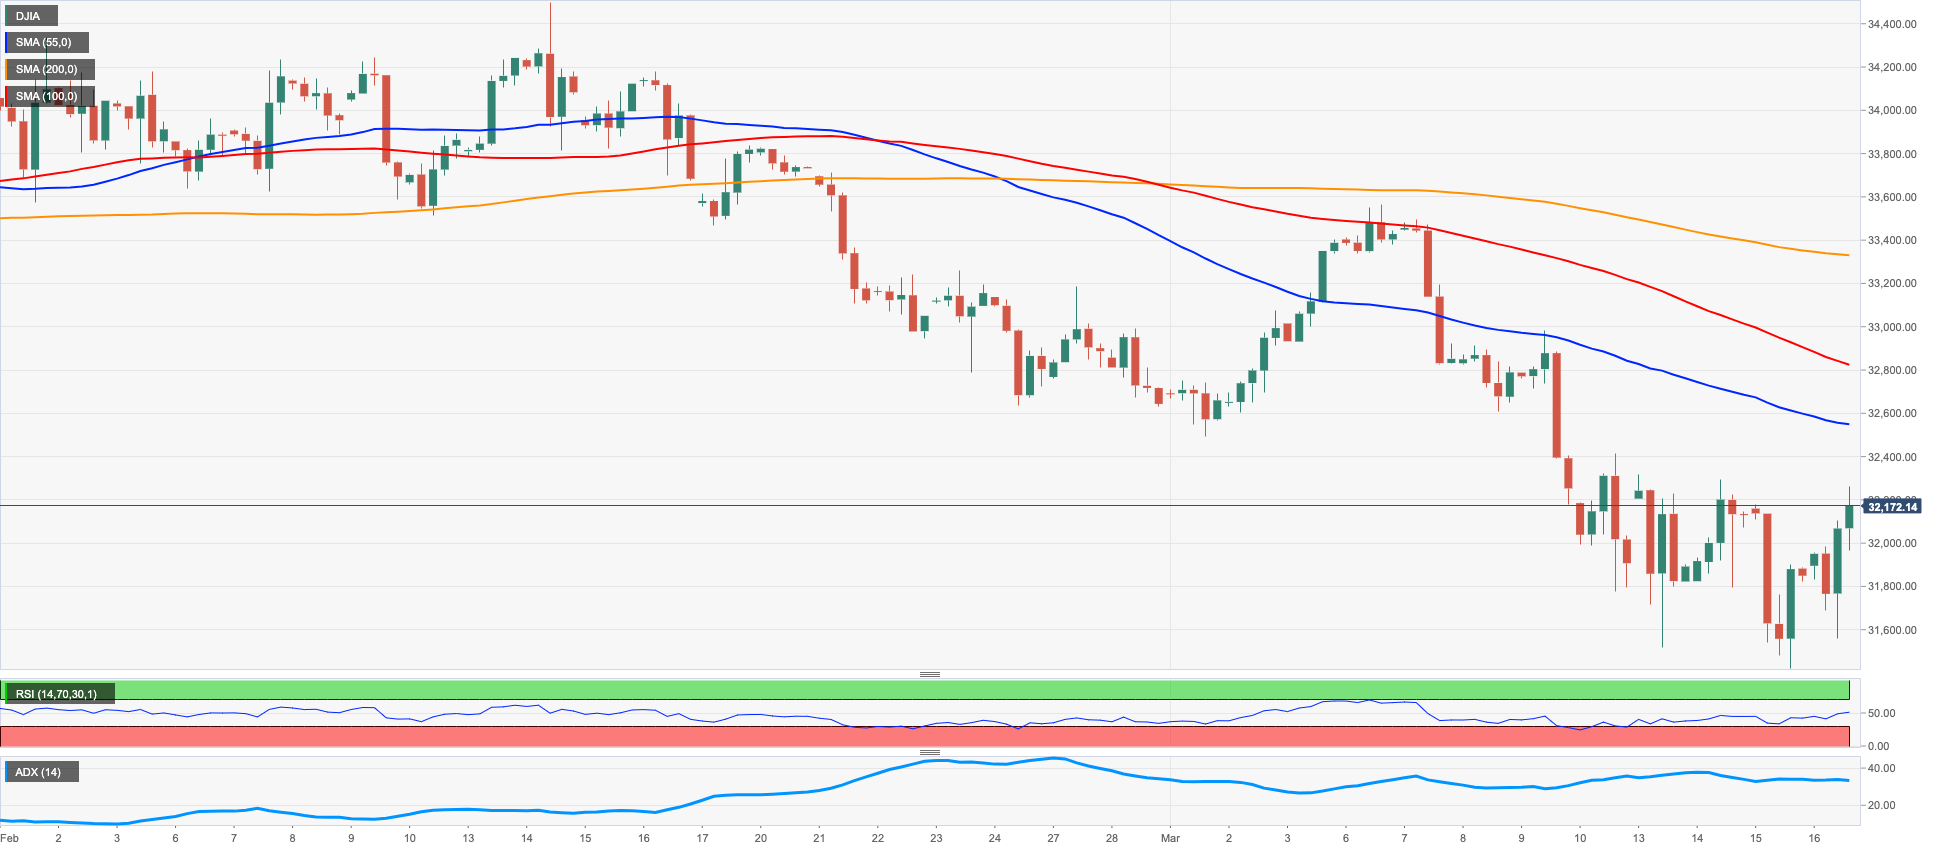
Equities tracked by the three major US stock indices rebounded markedly on Thursday and managed to leave behind part of the steep sell-off that hurt stocks earlier in the week.
Indeed, positive news around the banking sector involving some major US lenders and troubled First Republic Bank in combination with supportive comments from J.Yellen boosted the optimism among investors and underpinned the rebound in stocks.
Adding to the upbeat mood, recent lower-than-expected results from some US fundamentals seem to have reinforced the case for a 25 bps rate hike by the Fed at the March 22 gathering.
On the whole, the Dow Jones gained 0.85% to 32146, the S&P500 advanced 1.45% to 3948 and the tech-benchmark Nasdaq Composite rose 2.17% to 11681.
Further recovery in the Dow Jones targets the 200-day SMA at 32383 ahead of interim hurdles at the 100- and 55-day SMAs at 33315 and 33368, respectively, followed by the March peak at 33572 (March 6) and the 2023 high at 34342 (January 13). The other way around, initial support comes at the 2023 low at 31429 (March 15) seconded by the key 30000 mark and ahead of the 2022 low at 28660 (October 13). The daily RSI bounced to the proximity of the 40 region.
Top Performers: Intel, Microsoft, Travelers
Worst Performers: Visa A, Verizon, Home Depot
Resistance levels: 32990 33281 33572 (4H chart)
Support levels: 31429 28660 26143 (4H chart)
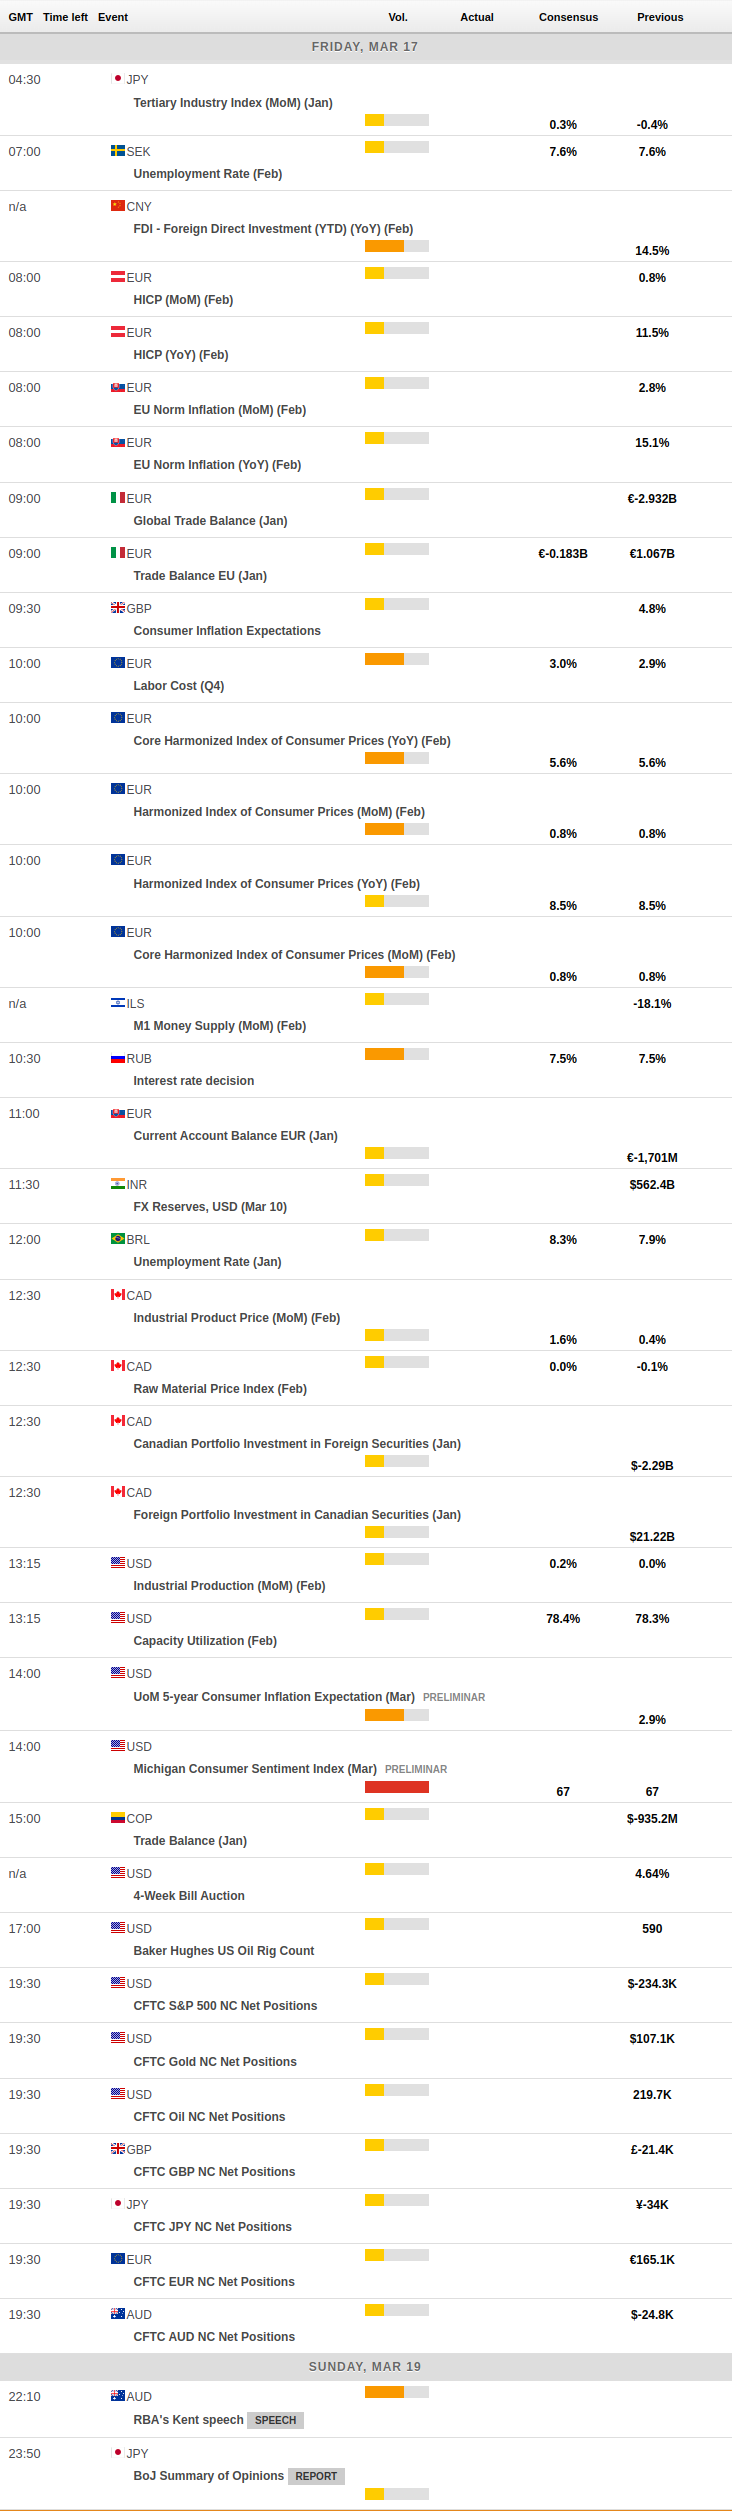
MACROECONOMIC EVENTS
All Information & Updates provided by:

All information relating to the financial markets available on this page has been prepared and issued by FXStreet (Forexstreet SL, Spain, Reg: B62498233) on the basis of publicly available information and all information believed to be reliable and does not conflict with Kuwaiti local laws, and all necessary care has been taken to before the company to ensure that the facts mentioned are correct from the source.
NCM Investment nor any of its directors or employees shall in any way be held responsible for the contents of this news, and the information contained on this page is intended only to provide clients with publicly available information and should not be construed as investment advice, report or analysis and/or constitute an offer or invitation to buy or sell financial instruments of any kind.
RISK WARNING: Forex and CFDs are highly risky leveraged products, as losses can exceed deposits. Please ensure you understand all the risks and take independent advice if necessary. NCM will segregate the clients based on the criteria of the regulator and its bylaws. NCM does not provide any advisory service; the material published does not constitute advice or a recommendation for a transaction in any financial instrument. NCM accepts no responsibility for any use of the content presented and any consequences of that use. Anyone acting on the information provided does so at their own risk.