
- Contact Us:
-

-

-

-


Daily Market Updates
20 Mar 2023
USDJPY
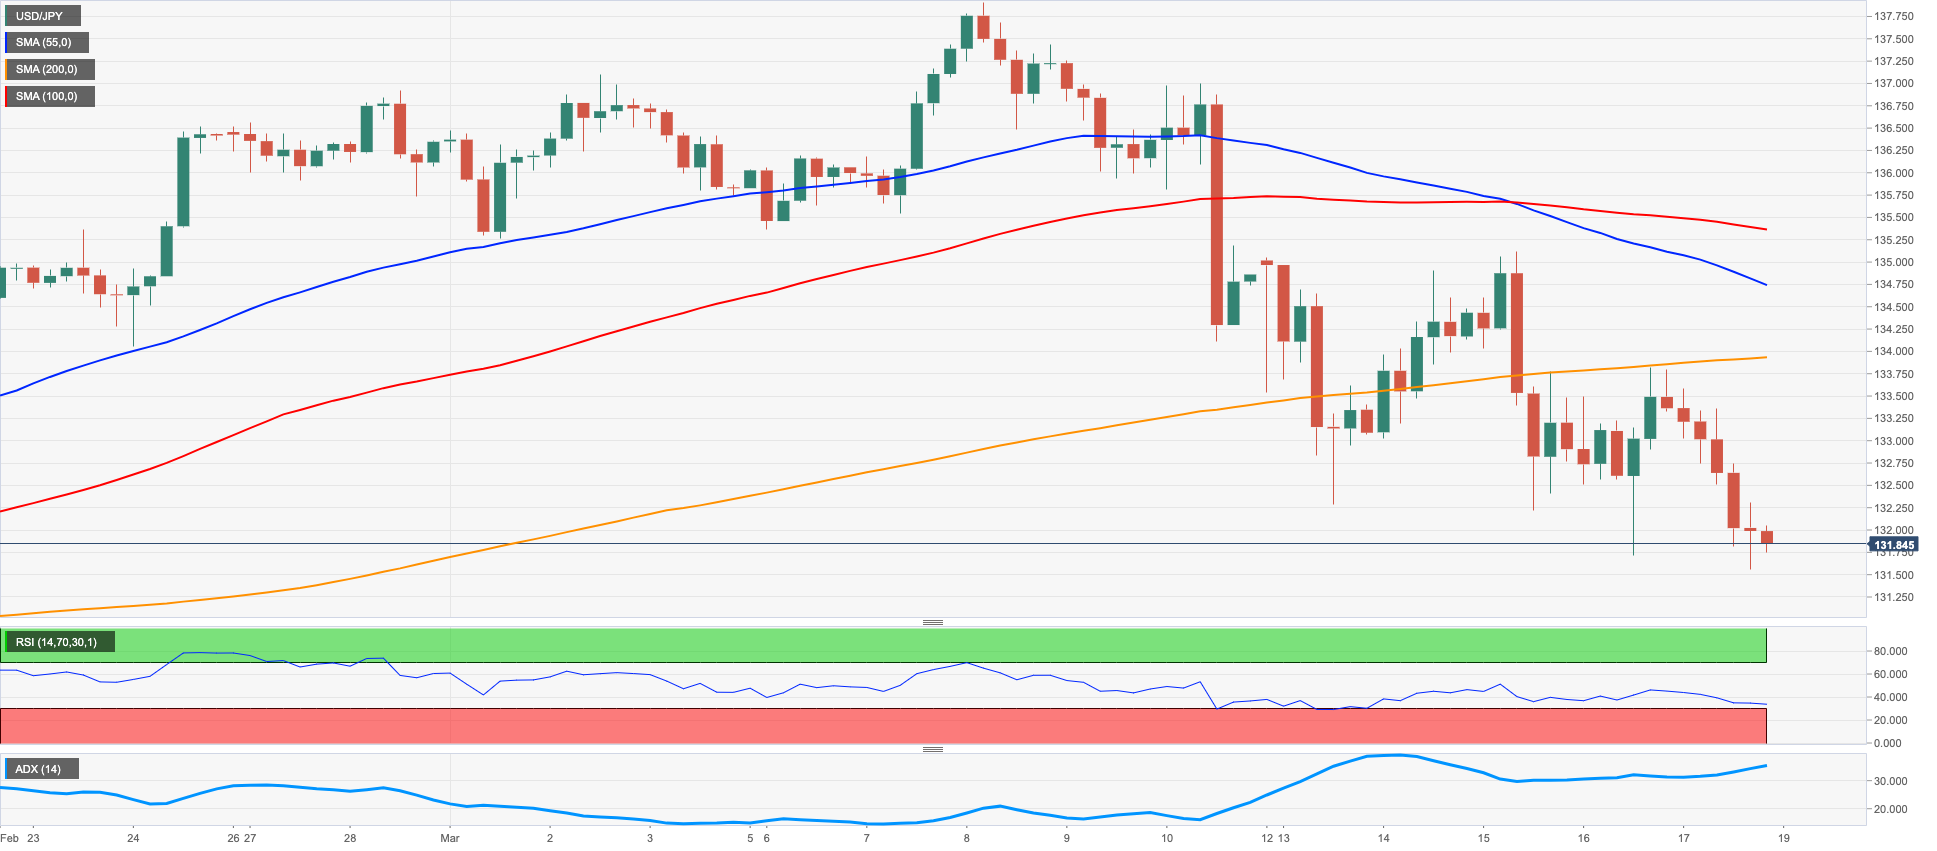
The weaker greenback and declining US yields across the curve were more than enough to spark the resumption of the leg lower in USD/JPY, which this time revisited 4-week lows in the mid-131.00s at the end of the week.
Indeed, the selling bias around the greenback accelerated and dragged the USD Index (DXY) back to the sub-104.00 region, while yields in the short end of the curve closed below the 4% mark once again and the belly ended the session near 3.40%.
In the Japanese money market, the JGB 10-year yields reversed three consecutive daily upticks and retreated to the area below the 0.30%.
Data wise, the Tertiary Industry Index expanded at a monthly 0.9% in January in what was the sole release in the Land of the Rising Sun.
If the weakness intensifies, USD/JPY could see the critical support at 130.00 revisited in the short term closely followed by the weekly low at 129.79 (February 10). South from here comes the February low at 128.08 (February 2) seconded by the 2023 low at 127.21 (January 16). On the other hand, the weekly peak at 135.11 (March 15) is expected to offer minor resistance just ahead of the temporary 100-day SMA at 135.26 and the key 200-day SMA at 137.46. Beyond this level, a probable move to the 2023 high at 137.91 (March 8) could emerge on the horizon ahead of weekly tops at 138.17 (December 15 2022) and 139.89 (November 30 2022). Further up aligns the key round level at 140.00 seconded by the weekly peak at 142.25 (November 21 2022). The daily RSI lost the grip and breached 40.
Resistance levels: 133.80 135.11 136.99 (4H chart)
Support levels: 131.55 129.79 128.08 (4H chart)
GBPUSD
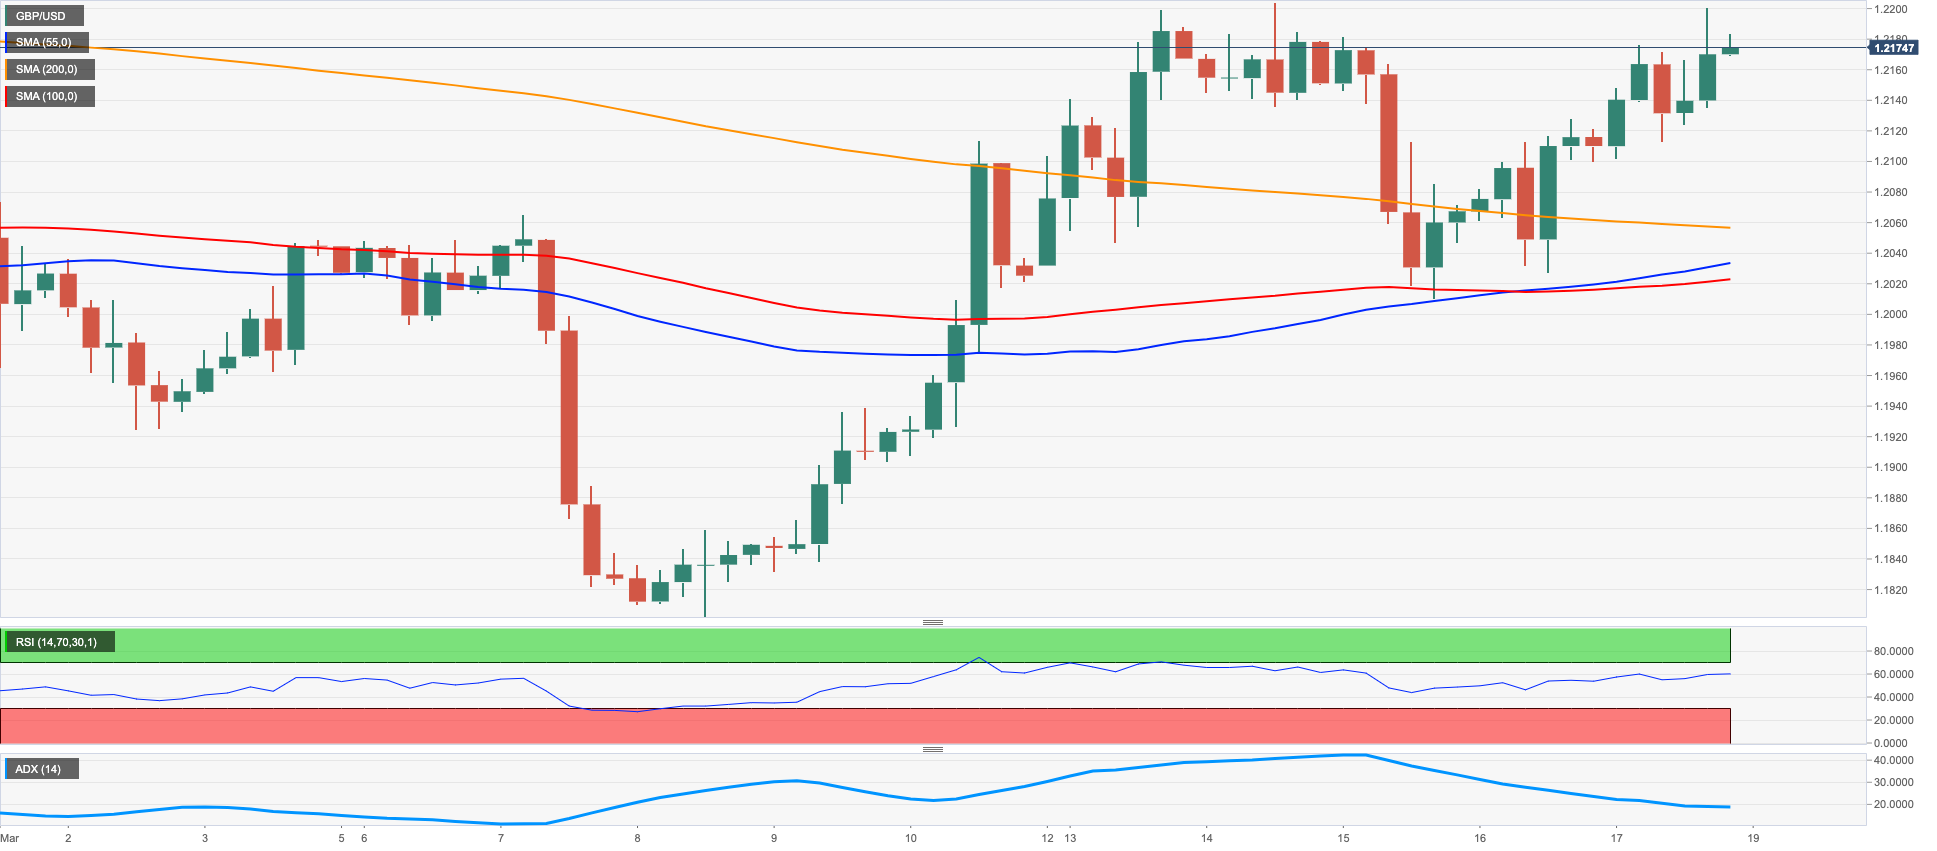
GBP/USD added to Thursday’s gains and briefly retested the area of weekly tops around the 1.2200 neighbourhood on Friday.
Once again, another negative session in the greenback in response to further improvement in the risk complex sustained the late optimism around Cable and encouraged it to leave behind losses seen in the previous week.
In line with their global peers, the 10-year Gilt yields retreated to multi-week lows around the 3.20% zone.
The UK docket remained empty at the end of the week.
The March peak at 1.2203 (March 14) emerges as the next big magnet for GBP/USD bulls. Once this level is cleared, a potential visit to the weekly high at 1.2269 (February 14) could start shaping up prior to the 2023 top at 1.2447 (January 23) and the May 2022 peak at 1.2666 (May 27). North from here emerges the 200-week SMA at 1.2873 just ahead of the psychological 1.3000 mark. By contrast, initial support lines up at the key 200-day SMA at 1.1889, while the breakdown of this region should pave the way for a deeper drop to the 2023 low at 1.1802 (March 8) prior to the November 2022 low at 1.1142 (November 4). The daily RSI gathered pace and approached 56.
Resistance levels: 1.2203 1.2269 1.2401 (4H chart)
Support levels: 1.2065 1.2010 1.1802 (4H chart)
AUDUSD
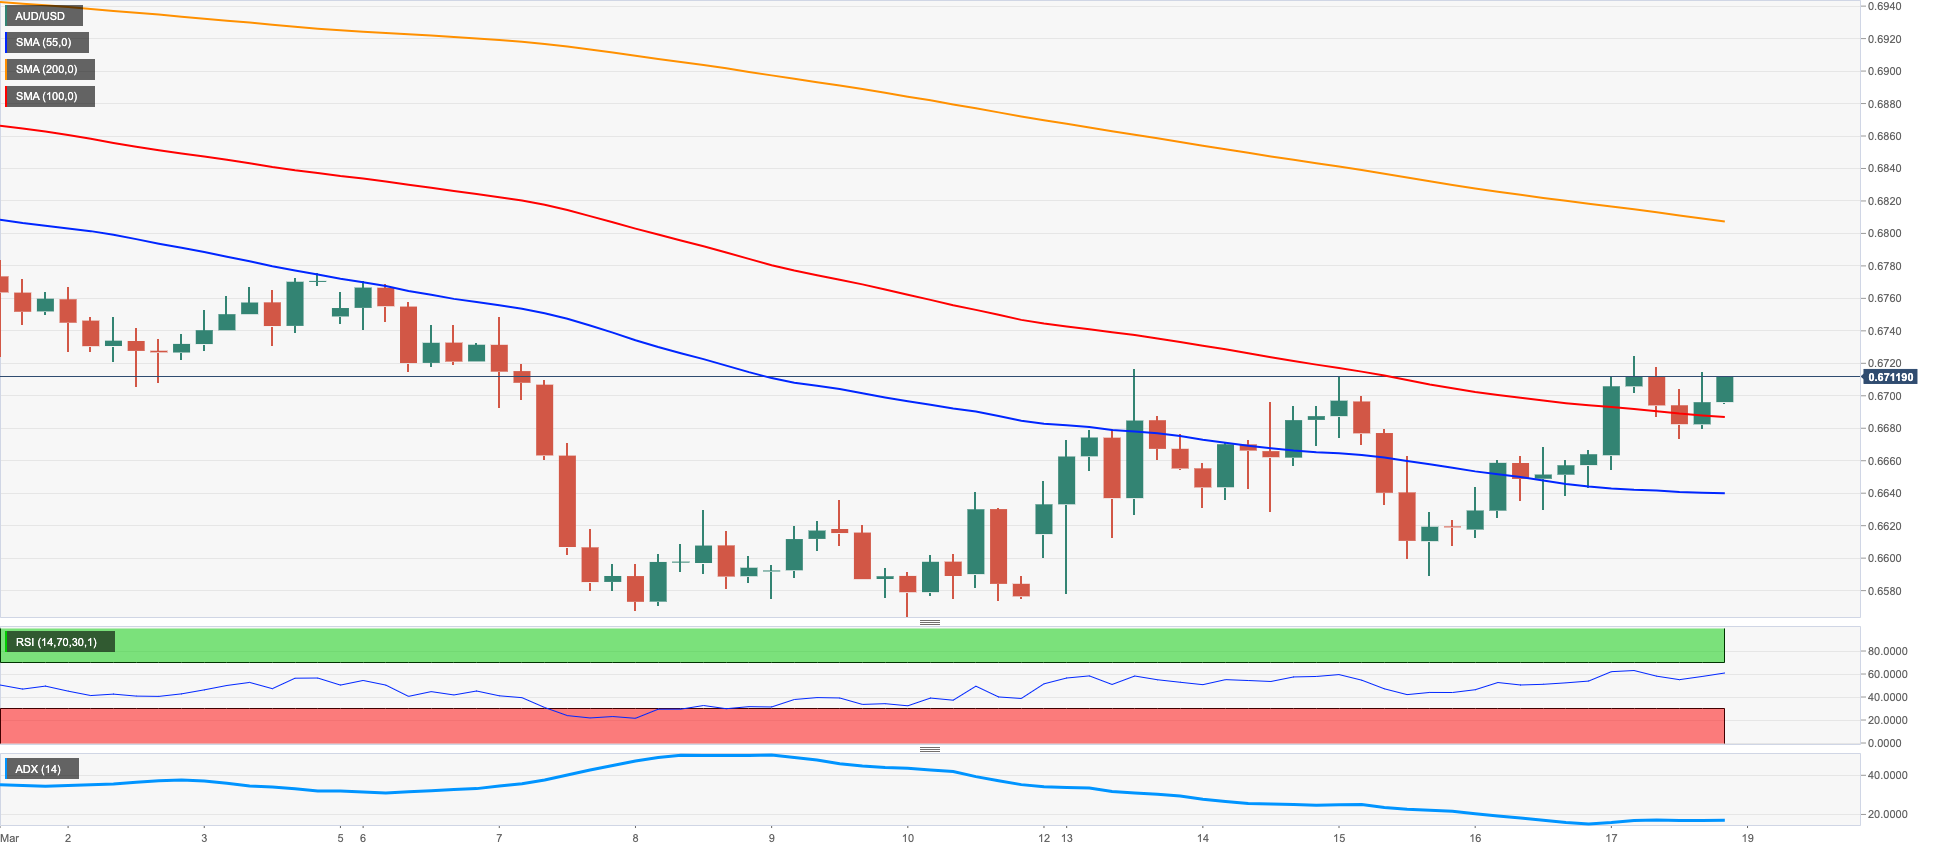
Further weakness in the greenback opened the door to AUD/USD to extend the rebound in the second half of the week, this time briefly trespassing the 0.6700 barrier to clock fresh weekly tops despite receding a tad towards the end of the session.
In addition, the broad-based recovery in the commodity complex also collaborated with the uptick in spot after copper prices and the iron ore picked up further upside traction, extending the rebound from earlier weekly lows at the same time.
The next release of note in Oz will be the publication of the RBA Minutes of the March event on Tuesday.
In case bulls push harder, AUD/USD should meet the next up-barrier at the weekly top at 0.6724 (March 17) prior to the key 200-day SMA at 0.6763 and ahead of another weekly high at 0.6783 (March 1). The surpass of the latter could put the interim 55-day SMA at 0.6862 back on the radar before the weekly top at 0.6920 (February 20) and the key round level at 0.7000. Having said that, the immediate contention aligns at the 2023 low at 0.6563 (March 10) seconded by the weekly low at 0.6386 (November 10 2022) and the November 2022 low at 0.6272 (November 3). The daily RSI advanced to the proximity of 46.
Resistance levels: 0.6724 0.6774 0.6815 (4H chart)
Support levels: 0.6641 0.6589 0.6563 (4H chart)
GOLD
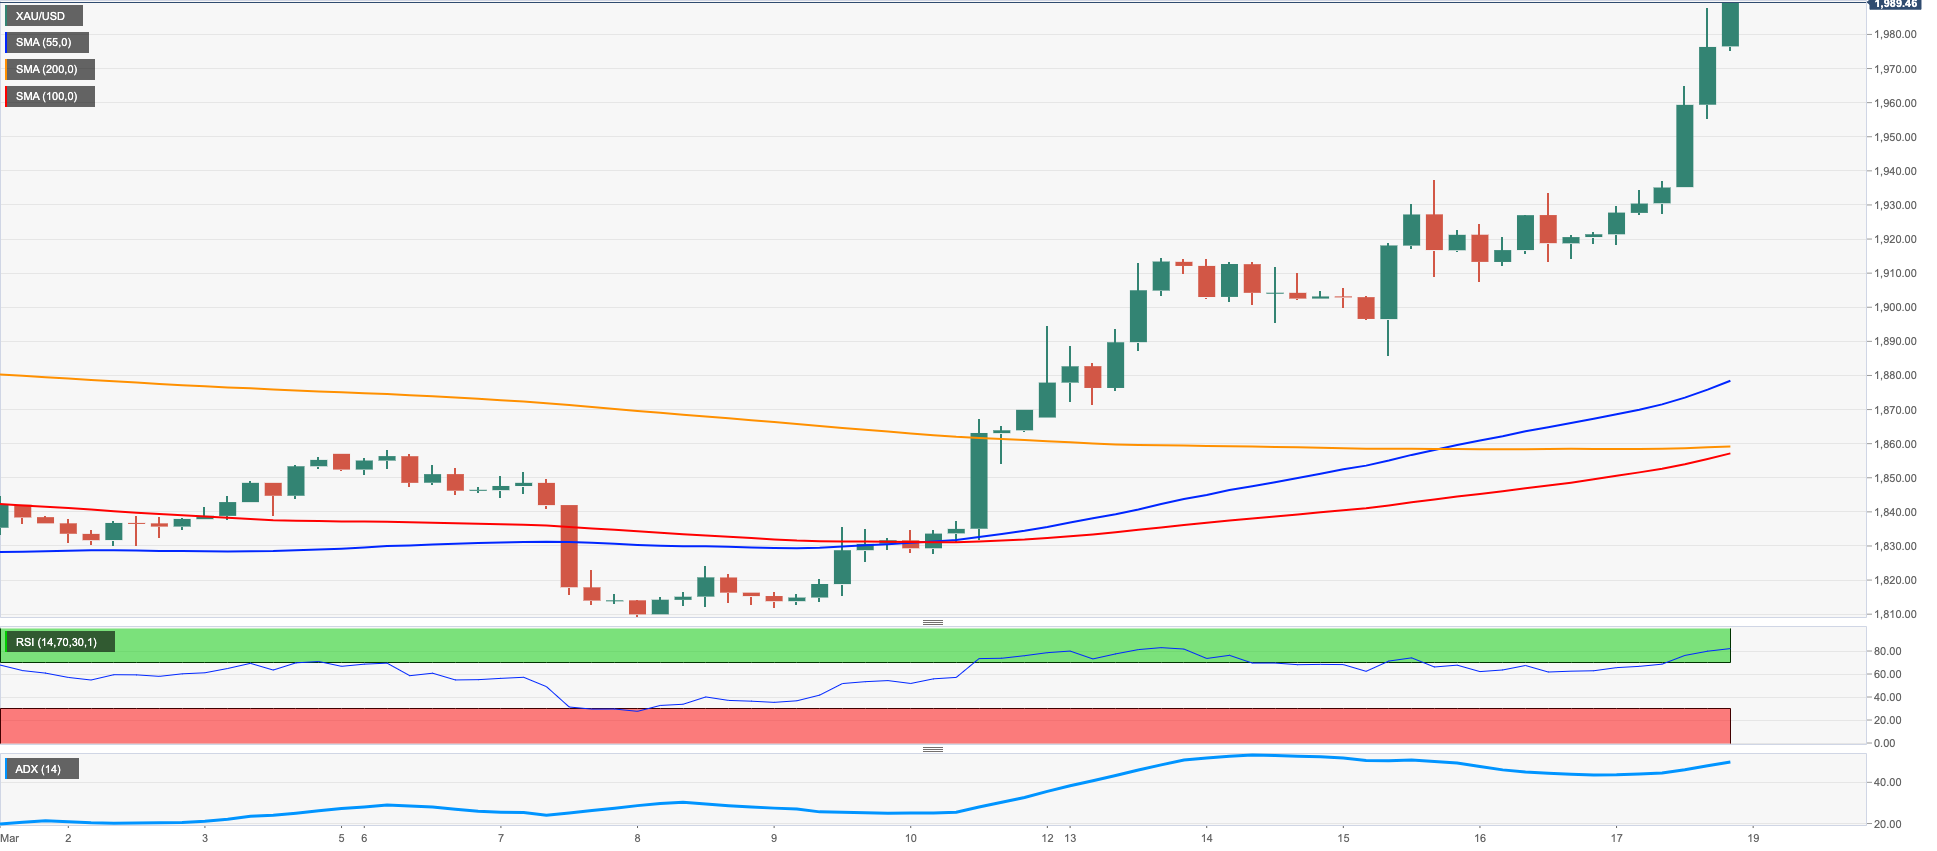
Prices of the ounce troy of gold rallied to 11-month peaks and flirted with $1990 at the end of the week.
The jump in the yellow metal came on the back of another negative performance in the greenback pari passu with diminishing US yields across the curve.
Also adding to the improvement in the precious metal, speculation that the Fed might pause its tightening cycle in the relatively near term remained on the rise, particularly following another set of disheartening results in some US fundamentals.
Considering Friday’s sharp uptick, the immediate hurdle for gold now appears at the April 2022 top at $1998 (April 18) just before the psychological $2000 yardstick and the 2022 peak at $2070 (March 8). In opposition, there are interim support levels at the 55- and 100-day SMA at $1876 and $1821, respectively, ahead of a probable drop to the March low at $1809 (March 8). Further down emerges the 2023 low at $1804 (February 28) seconded by the key $1800 region and the always-relevant 200-day SMA at $1777.
Resistance levels: $1988 $1998 $2070 (4H chart)
Support levels: $1885 $1861 $1847 (4H chart)
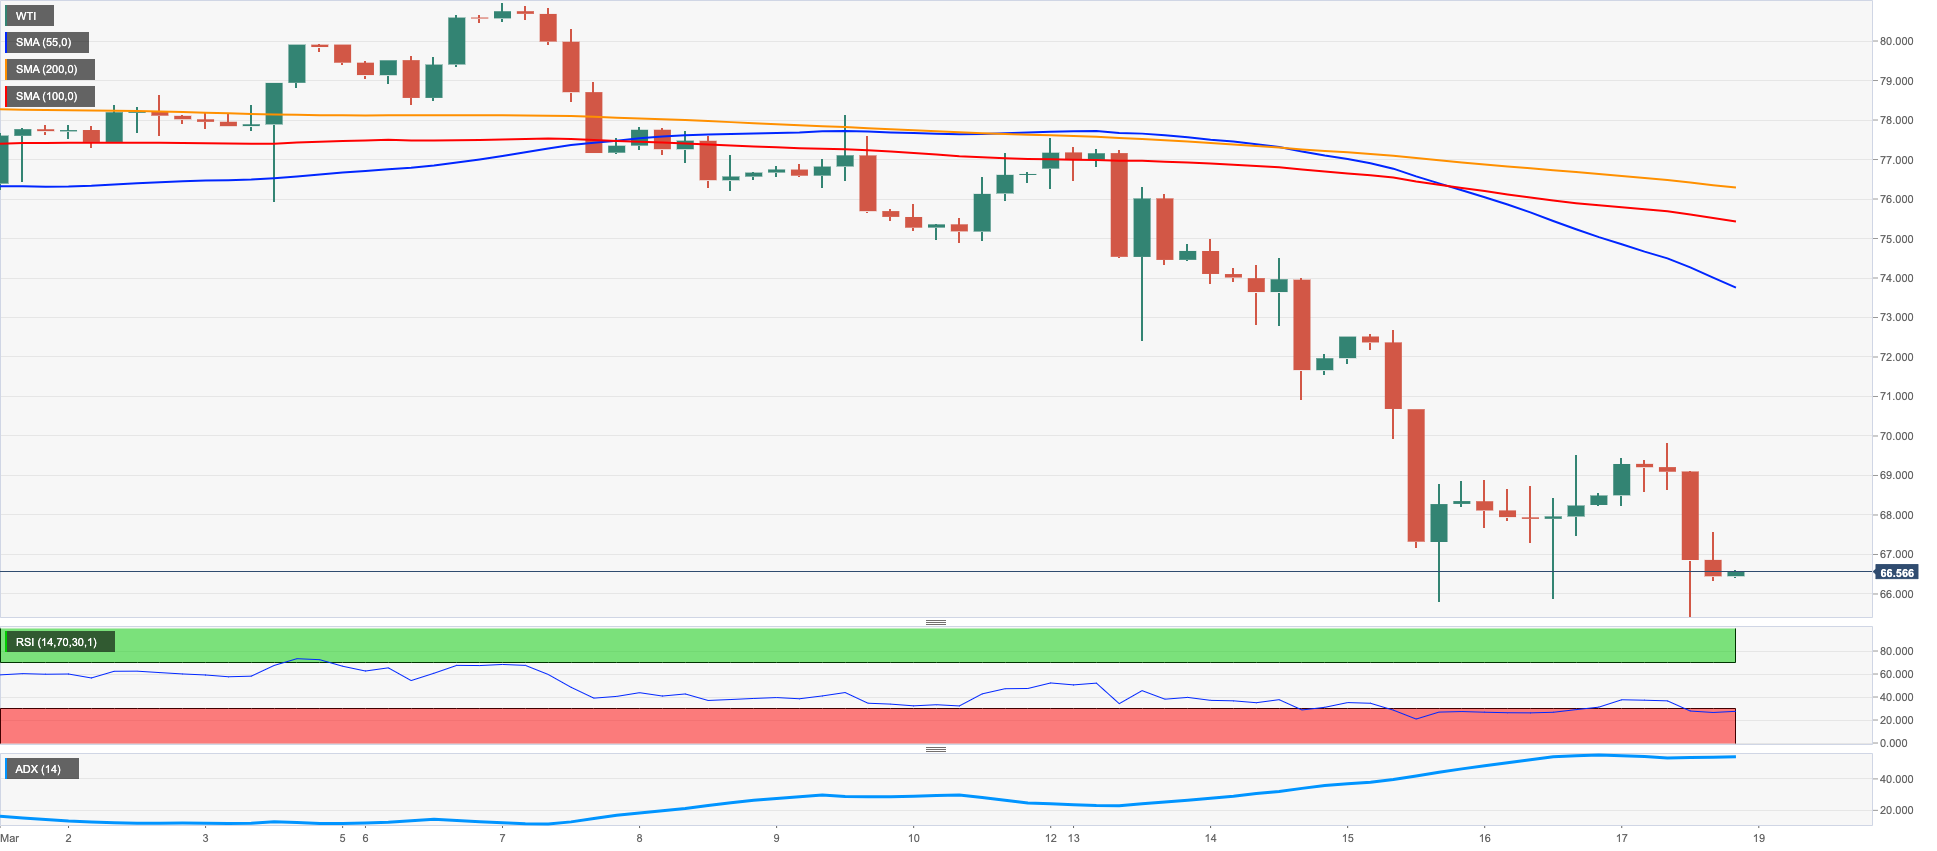
CRUDE WTI
Another day, another decline in prices of the WTI.
Indeed, the barrel of the American reference for the sweet light crude oil recorded the worst week since the onset of the coronavirus pandemic back to March 2020, losing more than 13% and retreating for the second week in a row.
As has been the case since Monday, fears around a potential banking crisis weighed once again on traders and forced the barrel of the West Texas Intermediate (WTI) to trade at shouting distance from the $65.00 mark, an area last traded in December 2021.
In addition, the loss of momentum in some key gauges in the US economy also agitated the spectre of a recession, which should keep prices under extra downside pressure going forward.
In the calendar, driller Baker Hughes reported that the total US active oil rigs went down by 1 to 589 in the week to March 17.
Further decline in prices of the WTI could see the 2023 low at $65.28 (March 17) revisited sooner rather than later. The breach of this region should not see the next contention zone until the December 2021 low at $62.46 (December 2) ahead of the August 2021 low at $61.76 (August 23). Just the opposite, there are provisional up-barriers at the 55- and 100-day SMAs at $76.93 and $78.73 prior to the March top at $80.90 (March 7) and the 2023 peak at $82.60 (January 23).
Resistance levels: $69.61 $74.39 $76.23 (4H chart)
Support levels: $65.19 $62.42 $61.72 (4H chart)
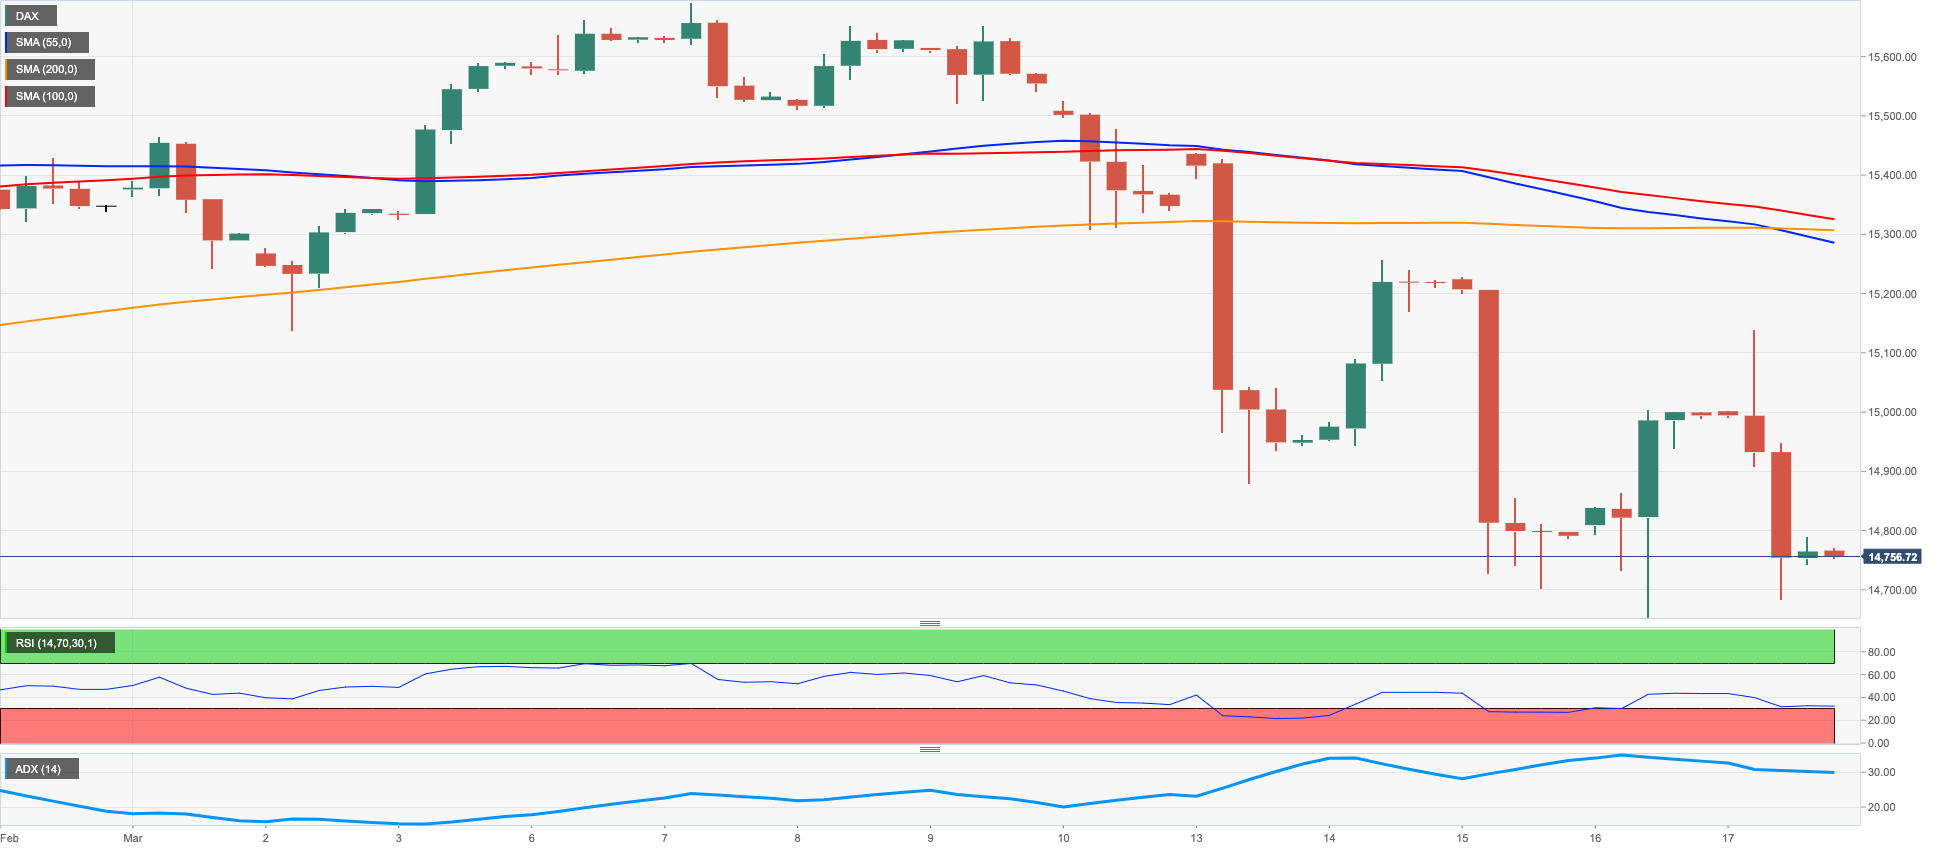
GER40
Equities tracked by the DAX40 ended Friday’s session in the lower end of the weekly range and in the area of 2-month lows near 14600.
Persistent jitters around the European banking sector, fears of contagion and the likelihood of further tightening by the ECB in the next months all kept the mood among investors depressed and dragged the main European indices back to the negative territory for the second straight week.
In the domestic bond market, the 10-year Bund yields dropped to multi-week lows near 2.07%, just to bounce a tad afterwards.
There were no data releases in Germany on Friday.
The loss of the March low at 14664 (March 16) could motivate the DAX40 to dispute the key 200-day SMA at 13835 ahead of the December 2022 low at 13791 (December 13). The other way around, the next target of note aligns at the 2023 high at 15706 (March 6) prior to the February 2022 top at 15736 (February 2 2022) and the round level at 16000, all ahead of the 2022 peak at 16285 (January 5). The daily RSI deflated to the sub-40 zone.
Best Performers: Infineon, Covestro, Siemens Healthineers
Worst Performers: Siemens Energy AG, Commerzbank, Munich Re Group
Resistance levels: 15153 15272 15706 4H chart)
Support levels: 14664 14388 13791 (4H chart)
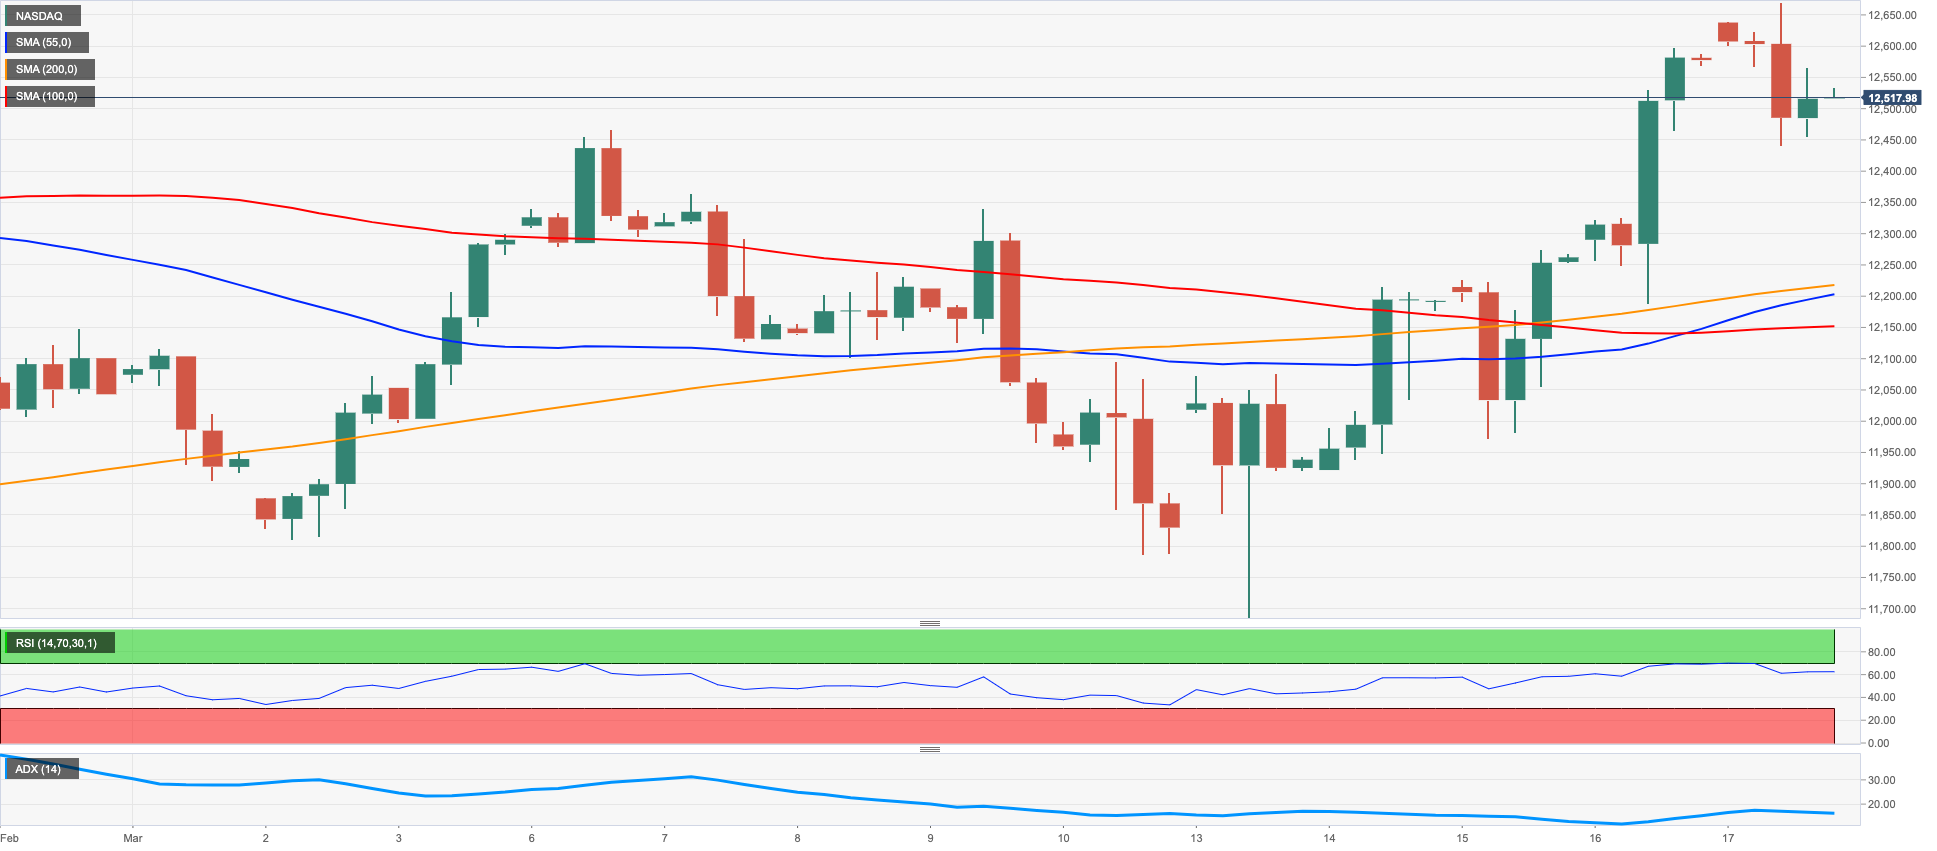
NASDAQ
The Nasdaq 100 saw its weekly strong advance trimmed on Friday after retreating to the 12500 region, although not before hitting fresh 4-week peaks near the 12700 area.
Persevering concerns around the health of the US banking system and reignited recession fears hurt the investors’ sentiment and sponsored the first daily drop in the tech index after four daily gains.
Once the Nasdaq 100 leaves behind the March top at 12674 (March 17) it could then prompt the weekly peak at 12689 (February 15) to emerge on the horizon ahead of the 2023 high at 12880 (February 2). Above the latter lines up the round level at 13000 followed by the weekly top at 13175 (August 26 2022). On the opposite side, the key 200-day SMA at 11904 precedes the March low at 11695 (March 13) prior to weekly lows at 11550 (January 25) and 11251 (January 19). Down from here comes the 2023 low at 10696 (January 6) before the December 2022 low at 10671 (December 22). The daily RSI ticked lower to the 59 zone.
Top Gainers: eBay, Alphabet C, Adobe
Top Losers: Enphase, Meta Platforms, Rivian Automotive
Resistance levels: 12674 12880 13175 (4H chart)
Support levels: 11695 11251 11050 (4H chart)
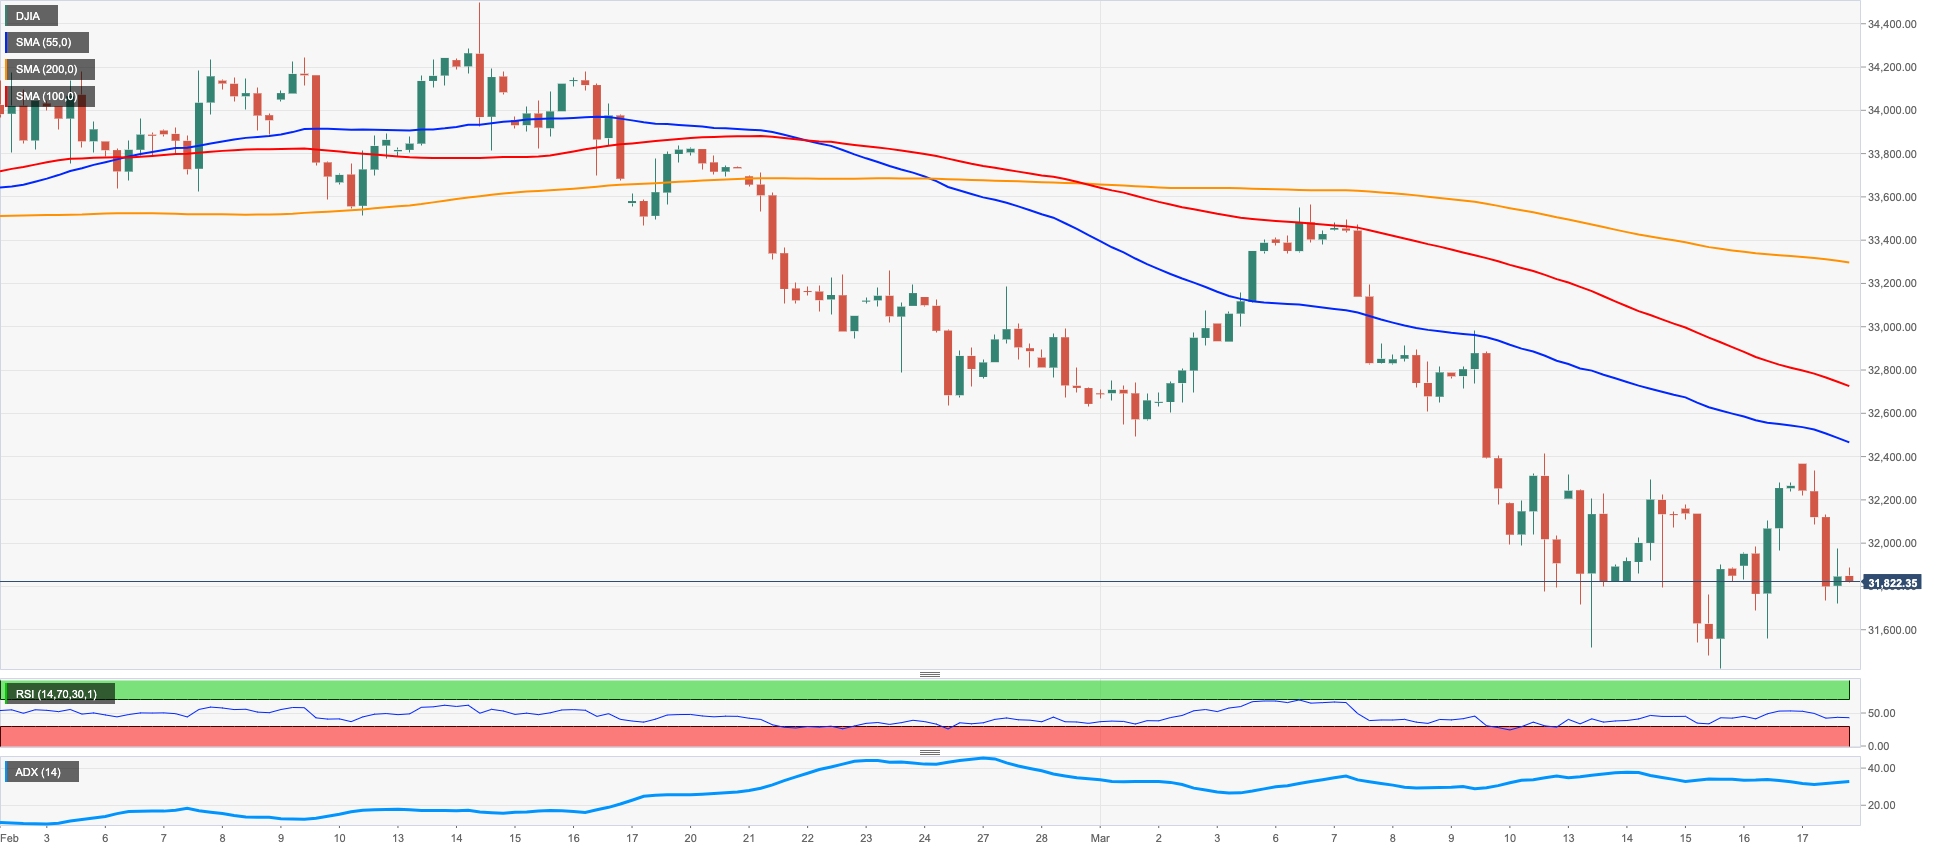
DOW JONES
US stocks measured by the Dow Jones faded Thursday’s gains and kept the pessimism well in place at the end of the week. Considering the weekly performance, the index retreated marginally and added to the previous strong pullback.
The explosive cocktail of fears surrounding the US banking sector and recession concerns were far too much for market participants this past week amidst rising cautiousness ahead of the FOMC event on March 22 and firm prospects of a 25 bps rate hike.
All in all, the Dow Jones deflated 1.19% to 31861, the S&P500 retreated 1.10% to 3916 and the tech-heavy Nasdaq Composite dropped 0.74% to 11630.
A deeper decline could prompt the Dow Jones to confront the 2023 low at 31429 (March 15) before the key 30000 mark and seconded by the 2022 low at 28660 (October 13). On the contrary, the immediate hurdle emerges at the 200-day SMA at 32377 prior to the March high at 33572 (March 6) and the 2023 top at 34342 (January 13). Once the latter is cleared, the next hurdle comes at the December 2022 peak at 34712 (December 13) followed by the April 2022 high at 35492 (April 21). The daily RSI lost the grip and eased below 37.
Top Performers: Microsoft, Walmart, Home Depot
Worst Performers: Travelers, JPMorgan, Goldman Sachs
Resistance levels: 32281 32990 33294 (4H chart)
Support levels: 31429 28660 26143 (4H chart)
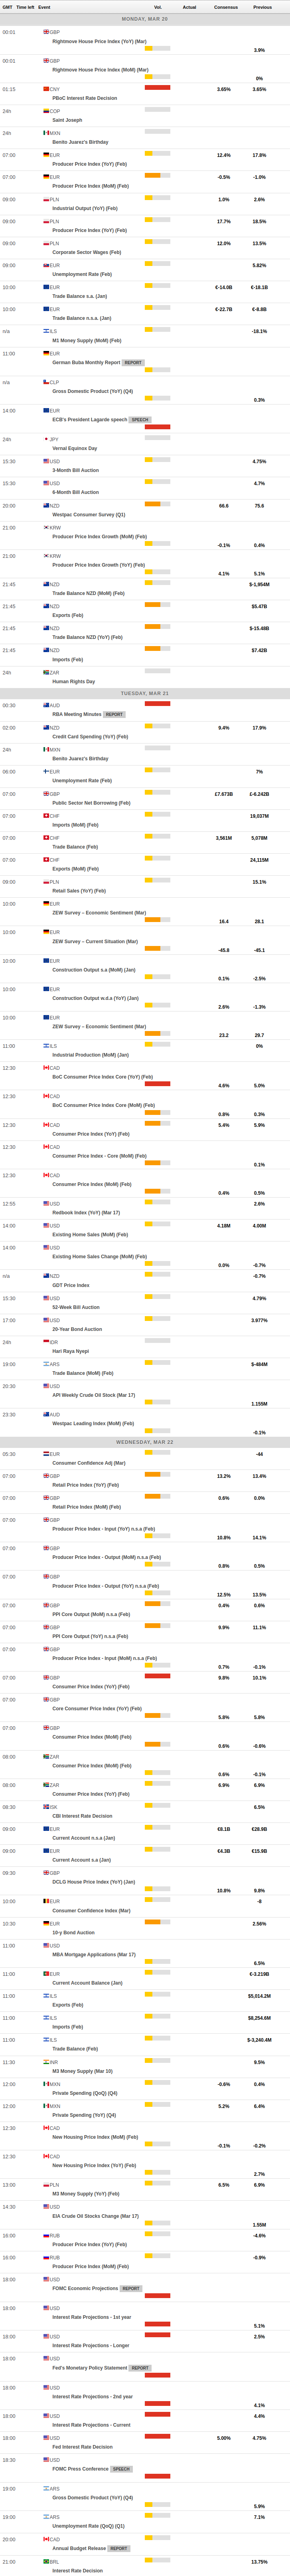
MACROECONOMIC EVENTS
All Information & Updates provided by:

All information relating to the financial markets available on this page has been prepared and issued by FXStreet (Forexstreet SL, Spain, Reg: B62498233) on the basis of publicly available information and all information believed to be reliable and does not conflict with Kuwaiti local laws, and all necessary care has been taken to before the company to ensure that the facts mentioned are correct from the source.
NCM Investment nor any of its directors or employees shall in any way be held responsible for the contents of this news, and the information contained on this page is intended only to provide clients with publicly available information and should not be construed as investment advice, report or analysis and/or constitute an offer or invitation to buy or sell financial instruments of any kind.
RISK WARNING: Forex and CFDs are highly risky leveraged products, as losses can exceed deposits. Please ensure you understand all the risks and take independent advice if necessary. NCM will segregate the clients based on the criteria of the regulator and its bylaws. NCM does not provide any advisory service; the material published does not constitute advice or a recommendation for a transaction in any financial instrument. NCM accepts no responsibility for any use of the content presented and any consequences of that use. Anyone acting on the information provided does so at their own risk.