Daily Market Updates
21 Mar 2023
USDJPY
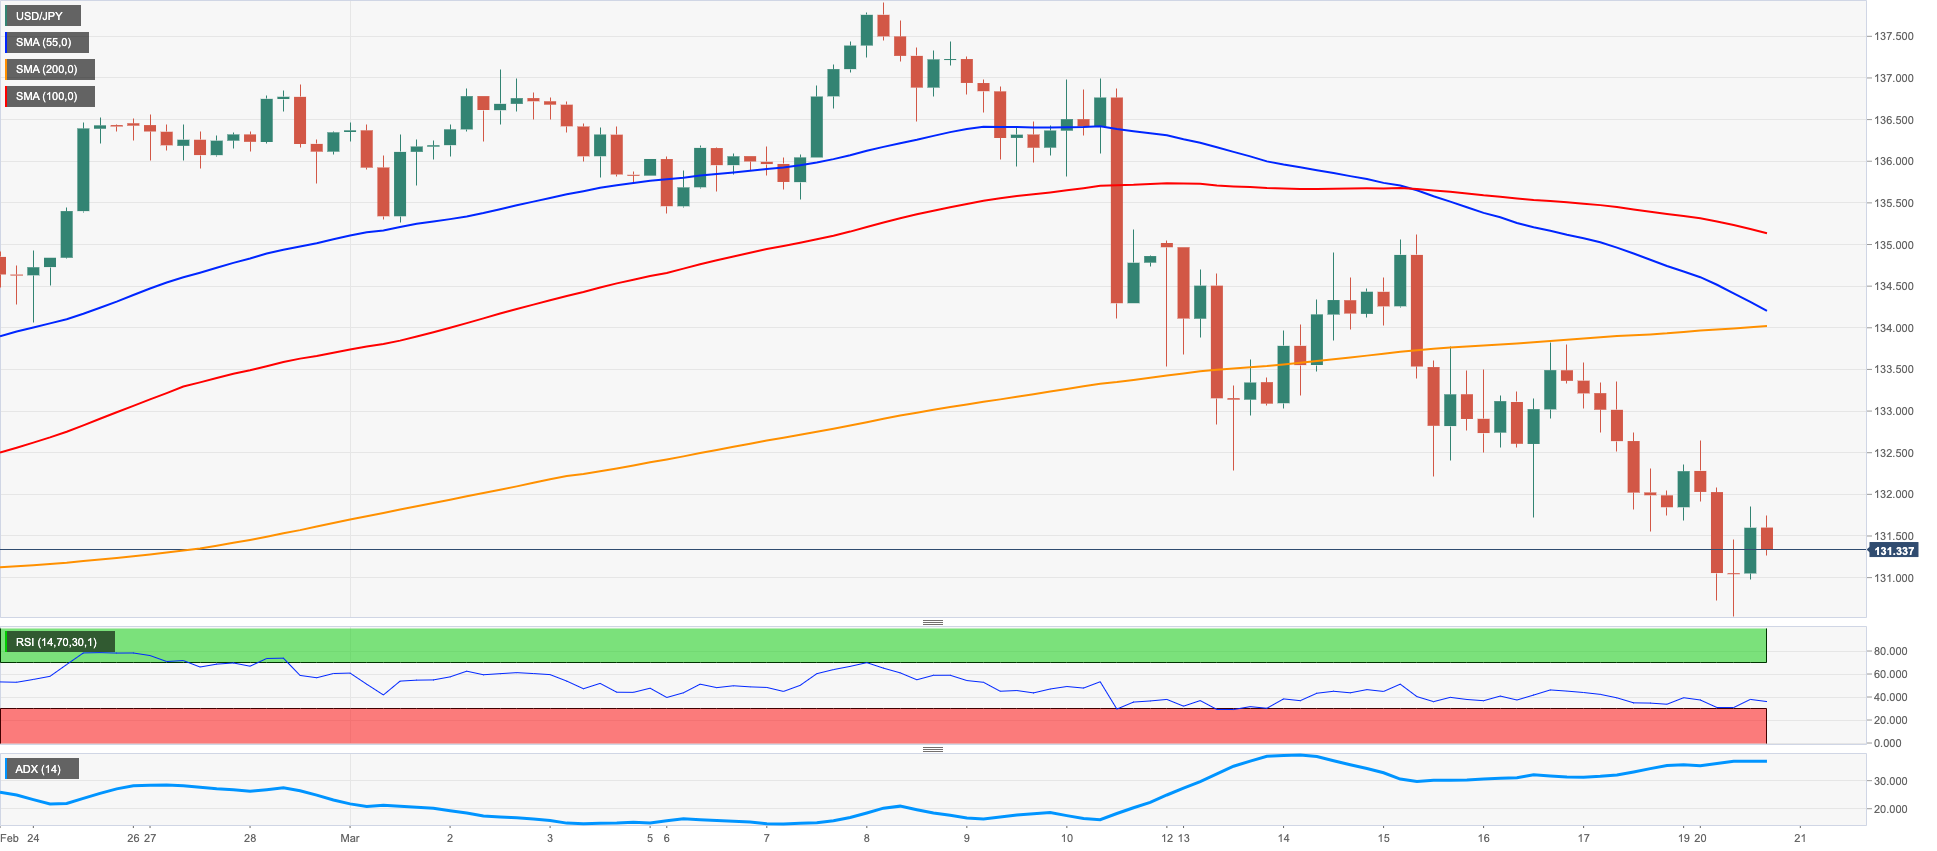
USD/JPY started the week on the back foot and broke below the 131.00 mark to clinch new 6-week lows near 130.50 on Monday, just to regain some balance afterwards.
Further downside in the pair came in tandem with another bearish performance of the dollar, with the USD Index (DXY) retreating to the 103.30/25 band for the first time since mid-February.
Extra selling pressure also came from the inconclusive performance of US yields across the curve, while the JGB 10-year yields remained depressed near the 0.20% region.
In the Japanese docket, the BoJ published its Summary of Opinions, where a member warned of upside risks to inflation and another participant suggested that elevated inflation may persist. In addition, members agreed that inflation is expected to drop below the 2% level in H2 2023, while the economy is showing signs of improvement and any changes to the monetary policy stance must be carefully considered.
Persistent downside pressure could force USD/JPY to revisit the key 130.00 region ahead of the weekly low at 129.79 (February 10). Down from here, spot could dispute the February low at 128.08 (February 2) prior to the 2023 low at 127.21 (January 16). By contrast, initial hurdle lines up at the weekly high at 135.11 (March 15), which appears reinforced by the proximity of the interim 100-day SMA and precedes the key 200-day SMA at 137.44. The surpass of the latter could open the door to the 2023 top at 137.91 (March 8) before weekly peaks at 138.17 (December 15 2022) and 139.89 (November 30 2022) ahead of the key round level at 140.00 and the weekly high at 142.25 (November 21 2022). The daily RSI eased to the proximity of 38.
Resistance levels: 133.84 135.11 136.99 (4H chart)
Support levels: 130.53 129.79 128.08 (4H chart)
GBPUSD
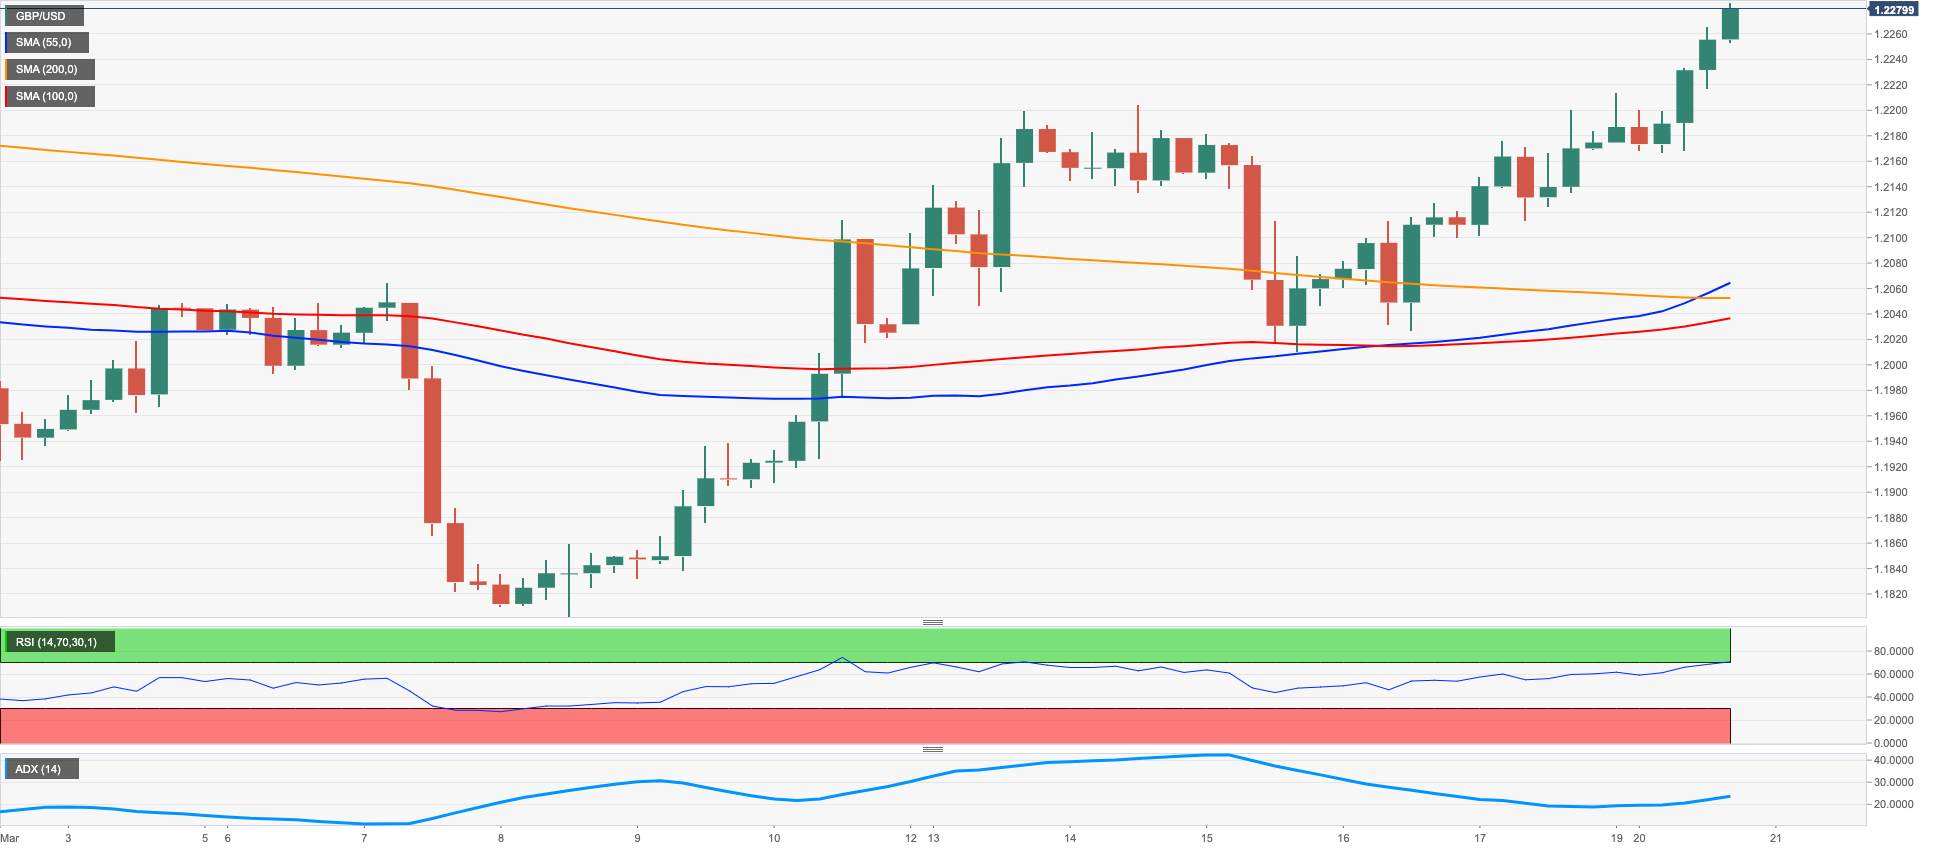
The persistent selling pressure around the greenback allowed GBP/USD to extend the monthly rebound and reclaim the area well above the 1.2200 barrier, or new 8-week tops, on Monday.
Indeed, the British pound advanced for the third straight session, in line with further improvement in the risk complex and amidst divided opinions regarding a 25 bps rate hike at the BoE’s meeting due later in the week.
There were no data releases in the UK docket on Monday, leaving all the attention to Tuesday’s publication of the public sector finances.
Further gains are likely to encourage GBP/USD to confront the March top at 1.2285 (March 20) ahead of the 2023 peak at 1.2447 (January 23) and the May 2022 high at 1.2666 (May 27). The breakout of the latter could prompt the 200-week SMA at 1.2871 to emerge on the horizon before the psychological 1.3000 mark. For all that, the key 200-day SMA at 1.1889is expected to offer decent contention prior to the 2023 low at 1.1802 (March 8) and the November 2022 low at 1.1142 (November 4). The daily RSI improved past the 60 yardstick.
Resistance levels: 1.2285 1.2401 1.2447 (4H chart)
Support levels: 1.2062 1.2010 1.1802 (4H chart)
AUDUSD
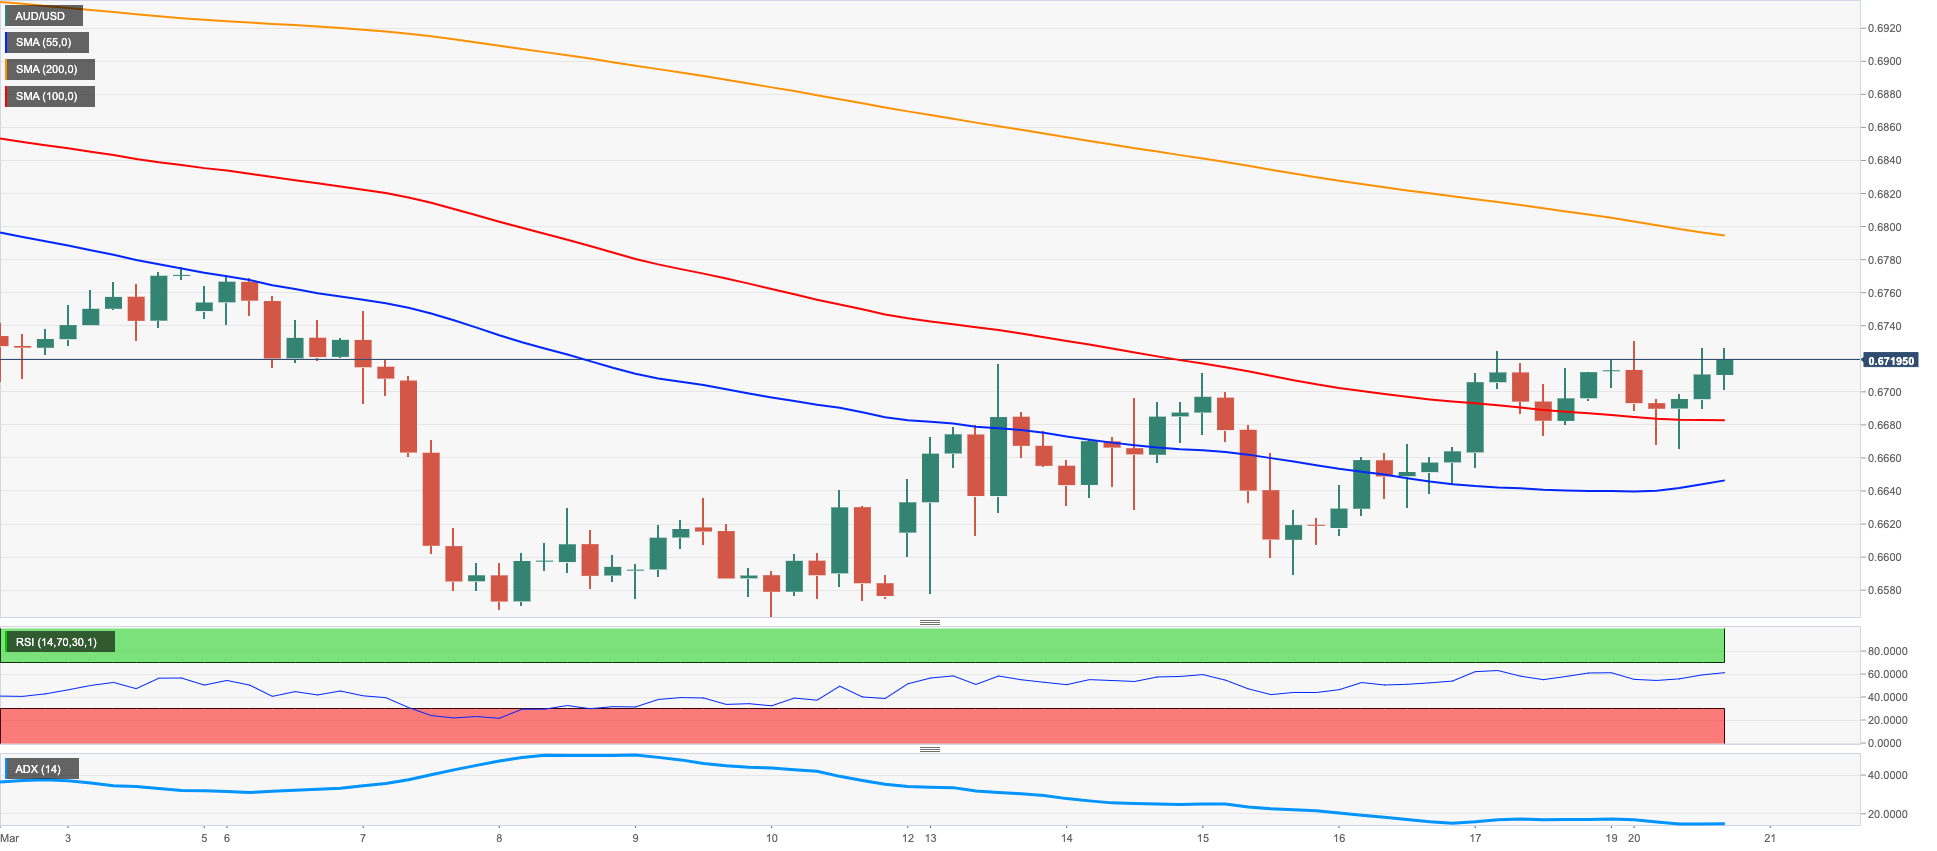
Considering the upbeat tone in the risk-linked galaxy, AUD/USD climbed to new 2-week highs around 0.6730 in a context of further weakness around the US dollar.
Indeed, the Aussie dollar started the week on a promising note and added to the ongoing recovery, this time also underpinned by the positive performance from copper prices and the iron ore amidst the mixed activity in the commodity universe.
From the RBA, Deputy Governor Kent stressed the “unquestionable” strength of the domestic banking system, at a time when he added that banks’ issuance “will continue to benefit from the strength of their balance sheets”.
AUD/USD now faces the immediate hurdle at the key 200-day SMA at 0.6762 prior to the weekly top at 0.6783 (March 1) and the interim 100-day SMA at 0.6779. If this level is cleared, then a test of the provisional 55-day SMA at 0.6860 could start shaping up prior to the weekly peak at 0.6920 (February 20) and the key round level at 0.7000. On the other hand, there are no support levels of note before the 2023 low at 0.6563 (March 10) ahead of the weekly low at 0.6386 (November 10 2022) and the November 2022 low at 0.6272 (November 3). The daily RSI climbed north of the 47 level.
Resistance levels: 0.6730 0.6774 0.6815 (4H chart)
Support levels: 0.6641 0.6589 0.6563 (4H chart)
GOLD
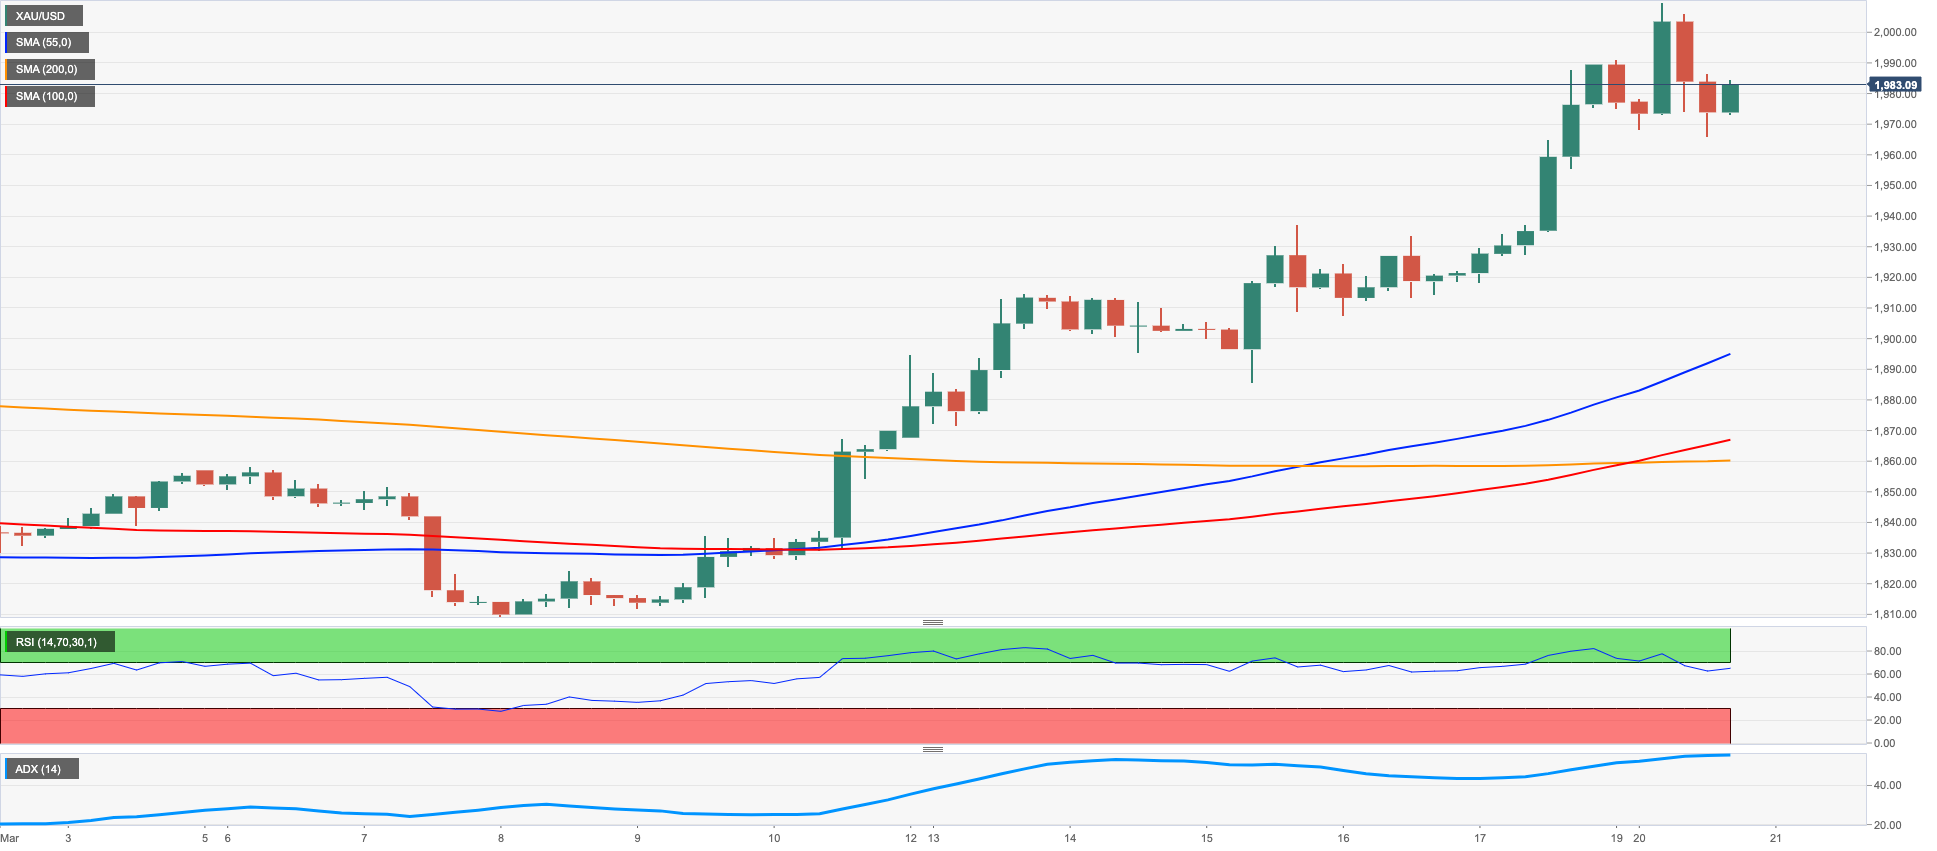
Gold prices advanced to new highs in level last seen a year ago beyond the key $2000 mark per ounce troy before triggering a knee-jerk at the beginning of the week. The current overbought conditions of the metal could have also been behind the corrective drop.
Indeed, the precious metal edged higher earlier in the session, as it remained underpinned by another poor day in the greenback. However, the rebound in US yields coupled with the loss of momentum in volatility across the board sparked some selling pressure in bullion and forced the metal to abandon that area of earlier peaks.
Moving forward, the yellow metal should keep the cautious note ahead of the key FOMC event later in the week, when investors largely anticipate a 25 bps rate hike by the Committee.
In light of the ongoing price action, if gold leaves behind the 2023 peak at $2009, it could then challenge the 2022 high at $2070 (March 8) ahead of the all-time top at $2075 (August 72020). Having said that, the 55- and 100-day SMA at $1878 and $1824, respectively, are expected to offer interim contention prior to the March low at $1809 (March 8) and the 2023 low at $1804 (February 28), all preceding the key $1800 region and the always-relevant 200-day SMA at $1778.
Resistance levels: $2009 $2070 $2075 (4H chart)
Support levels: $1885 $1862 $1847 (4H chart)
CRUDE WTI
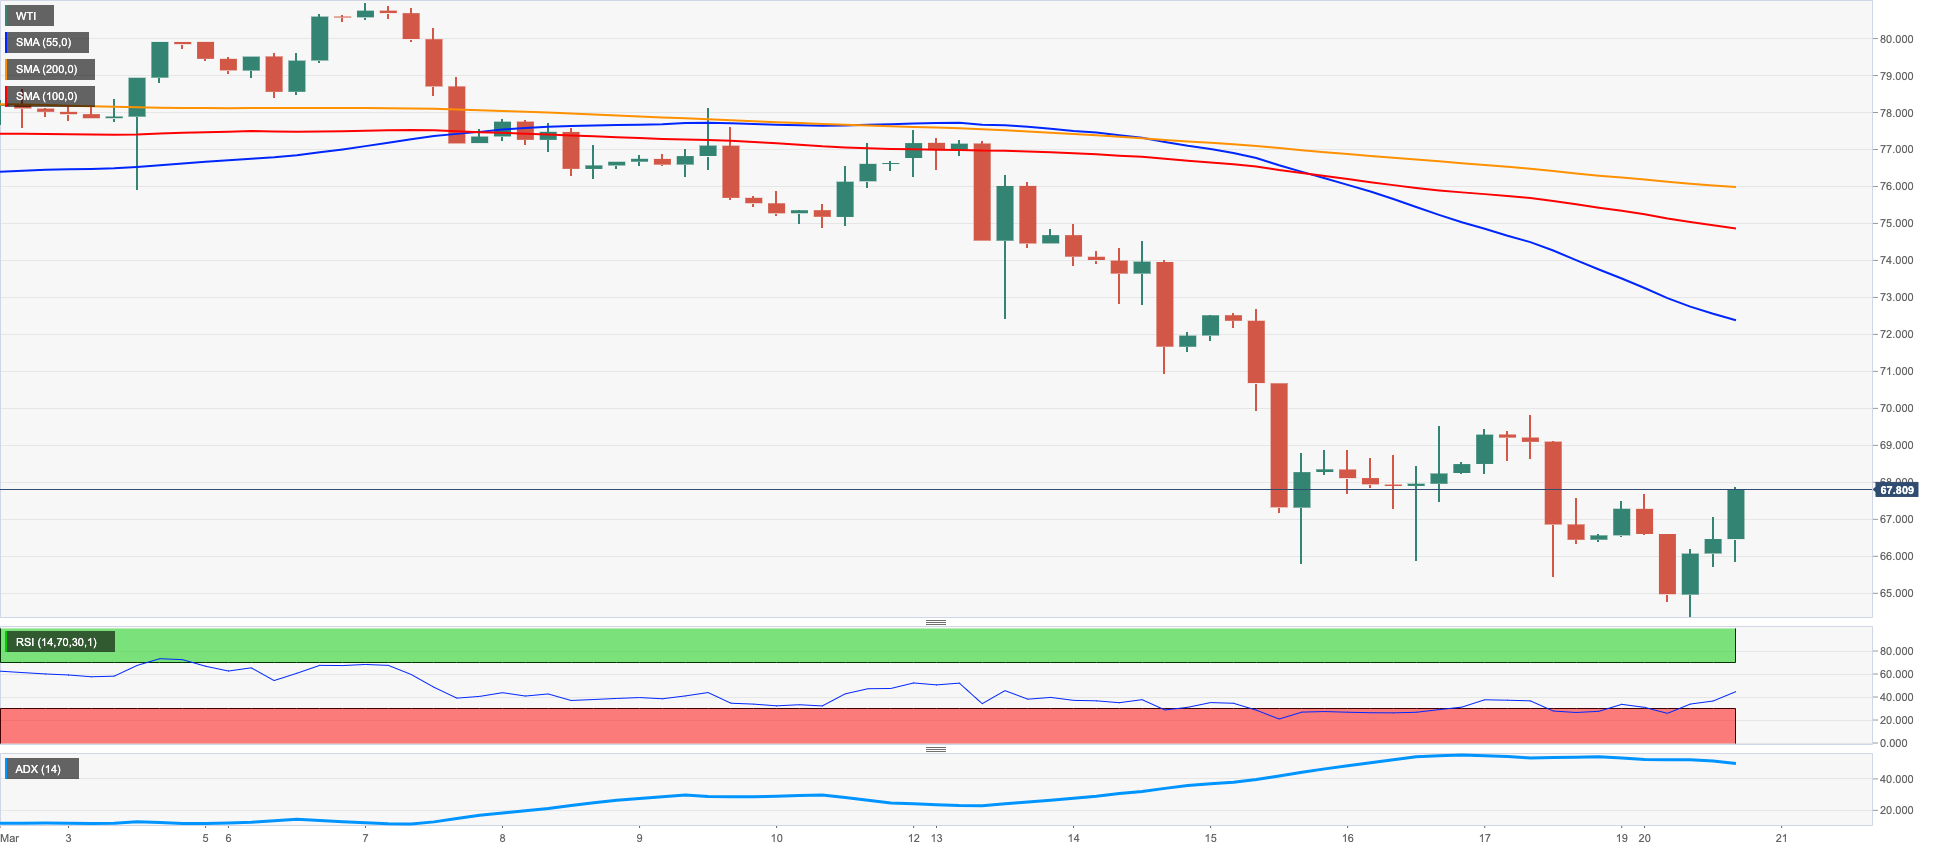
There seemed to be no respite for the downtrend in prices of the WTI for yet another session on Monday. This time, prices of the barrel of the West Texas Intermediate dropped to levels last traded back in August 2021 near the $64.00 mark just to attempt a moderate bounce towards the end of the NA session.
In fact, unabated fears surrounding the banking sector and its direct association with a potential recession continued to weigh on traders’ sentiment at the beginning of a new trading week, keeping the price action around the commodity well depressed.
In the meantime, crude oil should remain at the mercy of the expected broad volatility in the global markets ahead of the key FOMC gathering on March 22.
In addition, the API and the EIA will report on US crude oil inventories in the week to March 17 on Tuesday and Wednesday, respectively.
A drop below the 2023 low at $64.41 (March 20) could force WTI to confront the December 2021 low at $62.46 (December 2) prior to the August 2021 low at $61.76 (August 23). On the flip side, temporary resistance levels emerge at the 55- and 100-day SMAs at $76.68 and $78.51, respectively, before the March peak at $80.90 (March 7) and the 2023 high at $82.60 (January 23).
Resistance levels: $69.61 $72.51 $75.91 (4H chart)
Support levels: $64.41 $62.42 $61.72 (4H chart)
GER40
European stocks kicked in the new trading week in a positive fashion in response to dwindling concerns surrounding the European banking system, particularly following the UBS purchase of its Swiss problematic peer Credit Suisse.
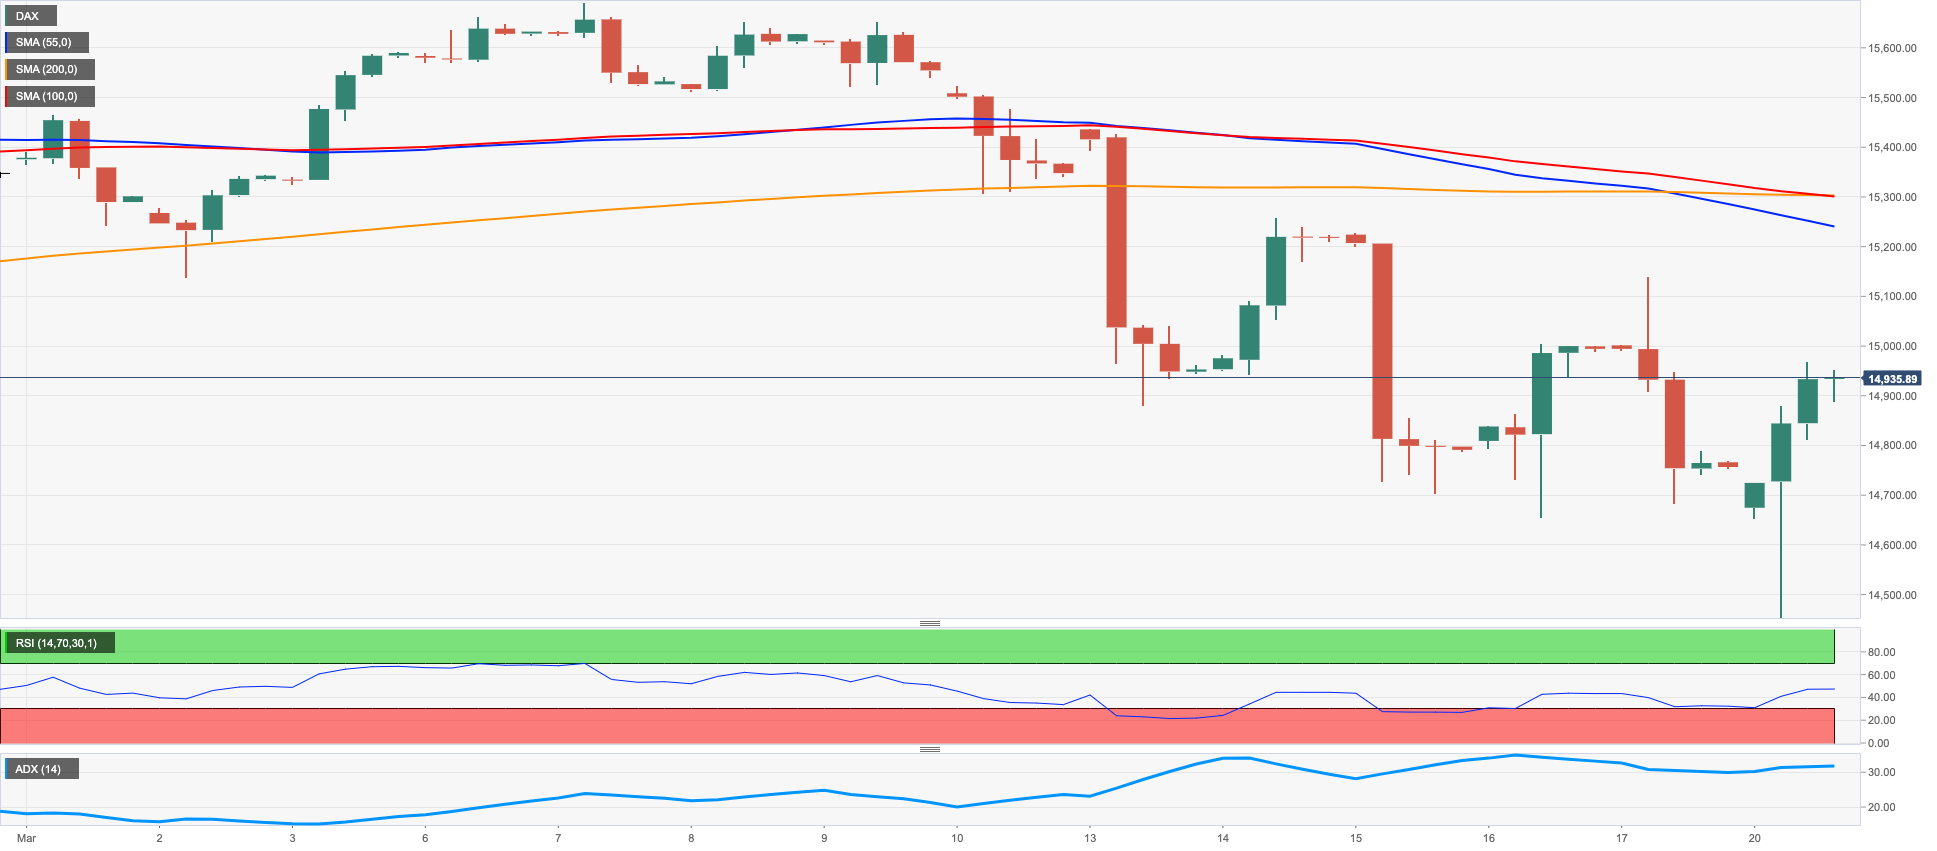
That said, the German benchmark index DAX40 managed to reverse an early drop to fresh 2-month lows near 14400 and ended up flirting with the key 15000 barrier amidst the broad-based and renewed optimism among investors.
In the money market, the 10-year Bund yields extended the drop and broke below the key 2% level and approached the 1.90 region for the first time since mid-January, an area also coincident with the 200-day SMA.
In Germany, Producer Prices dropped 0.3% in February vs. the previous month and rose 15.8% from a year earlier in what was the sole release in the docket on Monday.
In case the recovery gathers extra impulse, the DAX40 is expected to revisit the provisional barrier at the 55-day SMA at 15189 ahead of the 2023 top at 15706 (March 6) and the February 2022 peak at 15736 (February 2 2022). North from here aligns the round level at 16000 before the 2022 high at 16285 (January 5). On the contrary, the immediate contention comes at the March low at 14458 (March 20) seconded by the key 200-day SMA at 13841 and the December 2022 low at 13791 (December 13). The daily RSI picked up traction and trespassed the 43 yardstick.
Best Performers: Rheinmetall AG, Munich Re Group, Siemens Energy AG
Worst Performers: Qiagen, Dr Ing hc F Porsche AG Pfd, Zalando SE
Resistance levels: 15153 15272 15706 4H chart)
Support levels: 14458 14388 13791 (4H chart)
NASDAQ
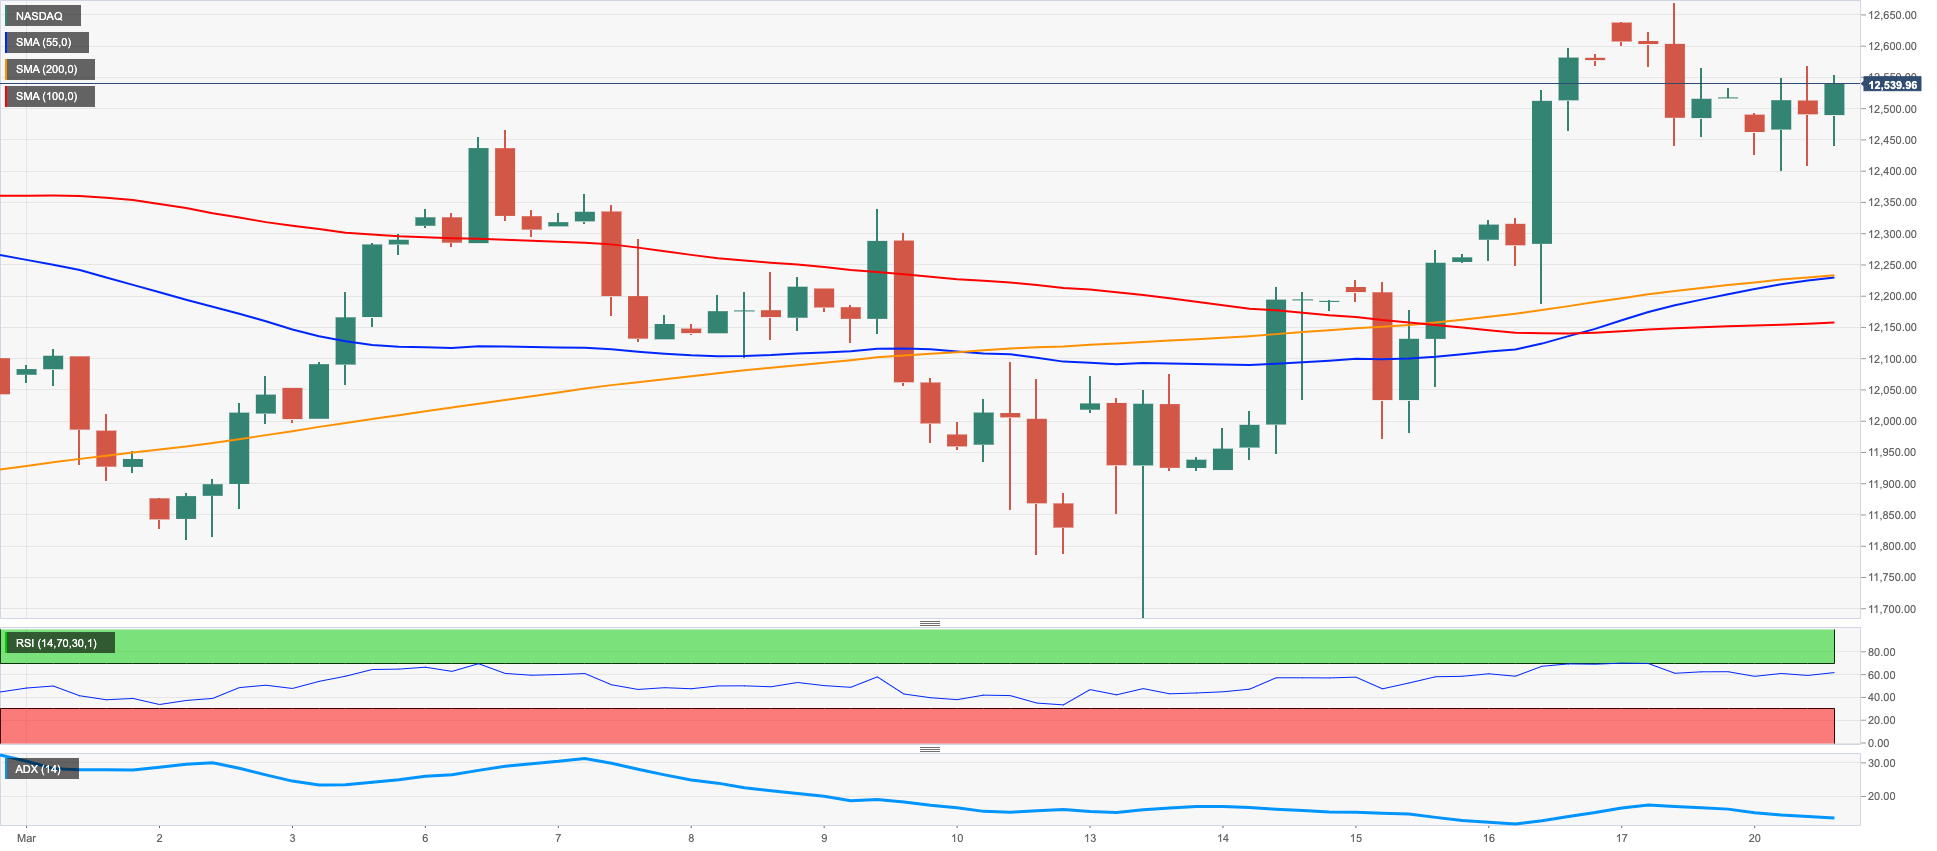
The Nasdaq 100 alternated gains with losses in the area below Friday’s multi-week highs and kept hovering around the 12500 region at the beginning of the week.
Easing concerns around a contagion in the banking sector and the lower dollar emerged as supportive factors for a better tone in the US tech benchmark, although the late bounce in US yields and the poor performance of megacaps Microsoft, Amazon and Alphabet kind of limited the upside potential in the index.
If the Nasdaq 100 breaks above the March peak at 12674 (March 17) it should open the door to a probable test of the 2023 high at 12880 (February 2) prior to the round level at 13000 and the weekly top at 13175 (August 26 2022). The other way around, there is an immediate support at the key 200-day SMA at 11904, while the loss of this region carries the potential to put the March low at 11695 (March 13) to the test before weekly lows at 11550 (January 25) and 11251 (January 19). A drop below the latter exposes the 2023 low at 10696 (January 6) prior to the December 2022 low at 10671 (December 22). The daily RSI advanced marginally to the 60 region.
Top Gainers: Enphase, Moderna, Diamondback
Top Losers: PDD Holdings DRC, Atlassian Corp Plc, Datadog
Resistance levels: 12674 12880 13175 (4H chart)
Support levels: 11695 11251 11050 (4H chart)
DOW JONES
US equities tracked by the three major US stock indices had an auspicious start of the trading week and left behind part of the weakness seen earlier in the month.
As a matter of fact, optimism among market participants resurfaced on Monday in response to mitigated contagion fears after top Swiss lender UBS said it will acquire the troubled Credit Suisse in an operation involving CHF 3B.
Also bolstering the mood among investors emerged the firm speculation that the Federal Reserve might pause its hiking cycle in the near term, although a 25 bps rate hike appears largely priced in at the FOMC event on March 22.
Overall, the Dow Jones rose 1.24% to 32256, the S&P500 advanced 0.90% to 3951 and the tech-reference Nasdaq Composite gained 0.26% to 11660.
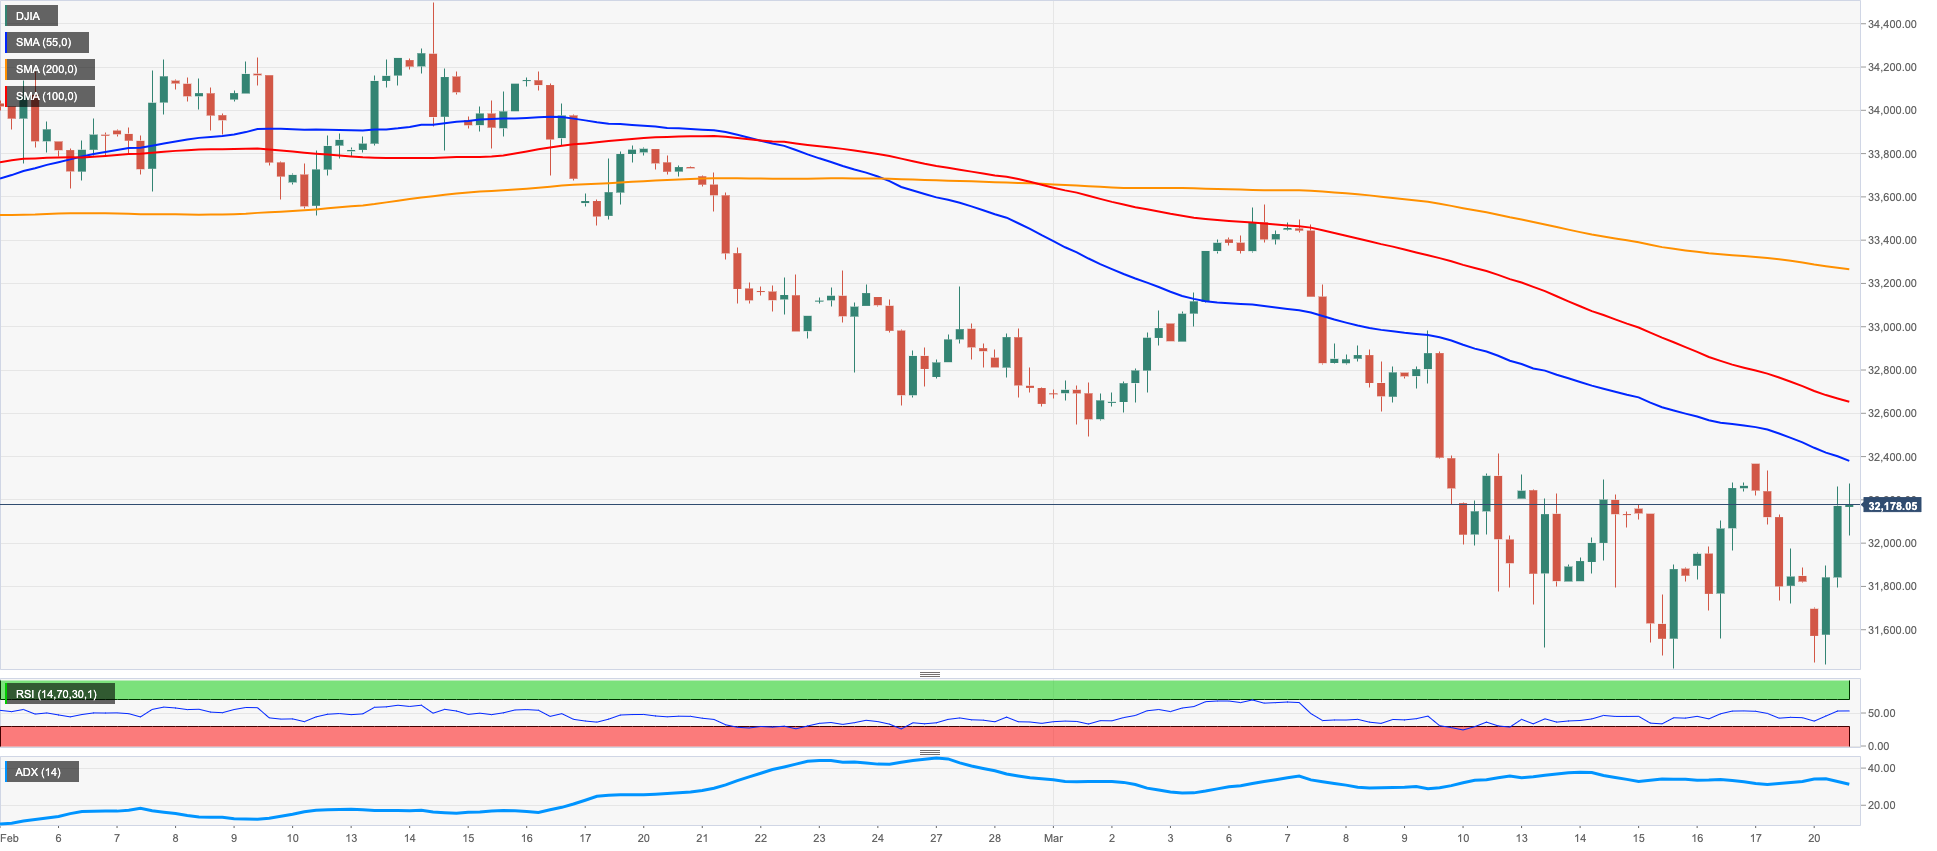
The Dow Jones seems within a range bound theme for the time being. That said, occasional bullish attempts are expected to meet the immediate hurdle at the key 200-day SMA at 32374 ahead of the March top at 33572 (March 6) and the 2023 peak at 34342 (January 13). The surpass of this level could spark a potential move to the December 2022 high at 34712 (December 13) seconded by the April 2022 top at 35492 (April 21). Just the opposite,the next support aligns at the 2023 low at 31429 (March 15) ahead of the key 30000 mark and prior to the 2022 low at 28660 (October 13). The daily RSI regained upside traction and approached 43.
Top Performers: Caterpillar, Honeywell, Goldman Sachs
Worst Performers: Microsoft, Intel, Salesforce Inc
Resistance levels: 32306 32990 33304 (4H chart)
Support levels: 31429 28660 26143 (4H chart)
MACROECONOMIC EVENTS


