
- Contact Us:
-

-

-

-


Daily Market Updates
23 Mar 2023
USDJPY
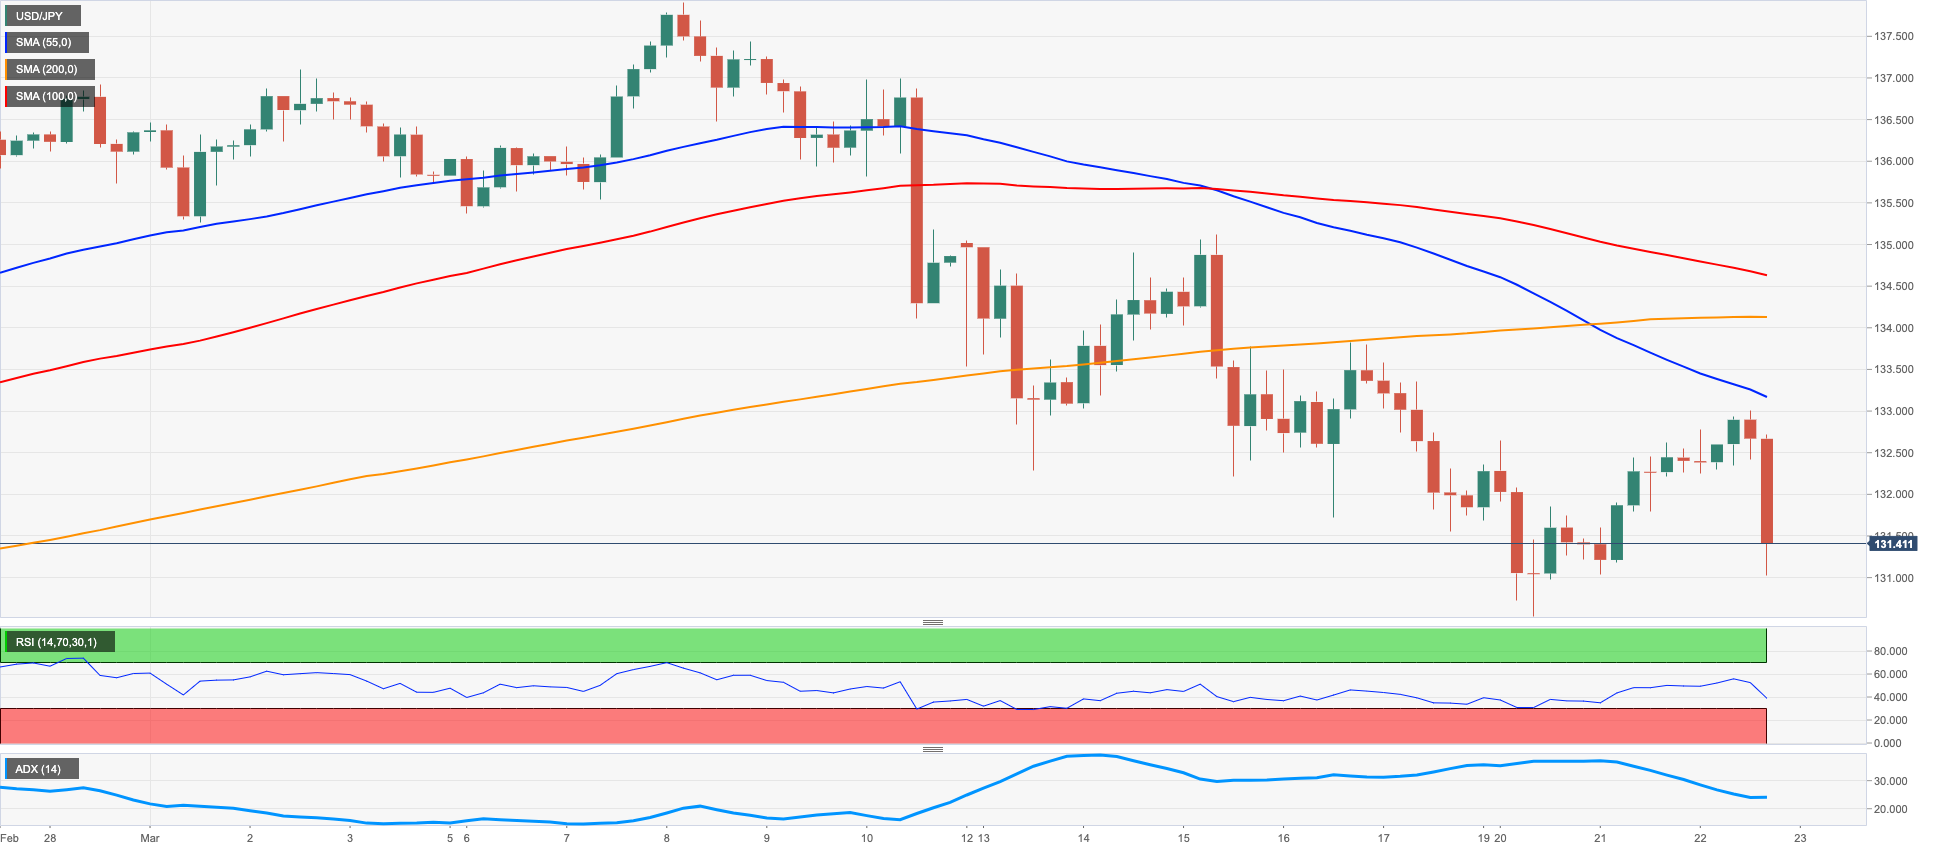
USD/JPY fully faded Tuesday’s advance and traded with marked losses midweek. The surpass of the 133.00 mark, however, remained elusive as the pair’s upside momentum faltered just ahead of that key barrier and triggered a sharp move south to the 131.00 neighbourhood following the Fed’s interest rate decision.
The downtick in US yields weighed on the dollar and sustained the move lower in spot, which was in turn bolstered by the persistent risk aversion, particularly exacerbated following the FOMC event.
In the Japanese money market, and in line with their US peers, the JGB 10-year yields left behind part of the recent decline and flirted with the 0.37% zone.
On another front, Finance Minister Suzuki warned against the rapid expansion of credit issues around the world, while reiterating that FX moves must move steadily and in line with fundamentals and stressing that the government is closely monitoring movements in the FX space.
The Japanese calendar was empty on Wednesday.
If the upside momentum runs out of steam, USD/JPY could revisit the March low at 130.53 (March 20) ahead of a potential drop to the key 130.00 zone. Down from here emerges the weekly low at 129.79 (February 10) seconded by the February low at 128.08 (February 2) and the 2023 low at 127.21 (January 16). On the opposite side, the 100-day SMA at 134.78 offers a provisional hurdle prior to the weekly peak at 135.11 (March 15). The breakout of this level could prompt the key 200-day SMA at 137.42 to resurface on the horizon ahead of the 2023 high at 137.91 (March 8) and before weekly tops at 138.17 (December 15 2022) and 139.89 (November 30 2022), all closely followed by the key round level at 140.00. The daily RSI deflated markedly to the sub-40 zone.
Resistance levels: 133.00 133.82 135.11 (4H chart)
Support levels: 131.01 130.53 129.79 (4H chart)
GBPUSD
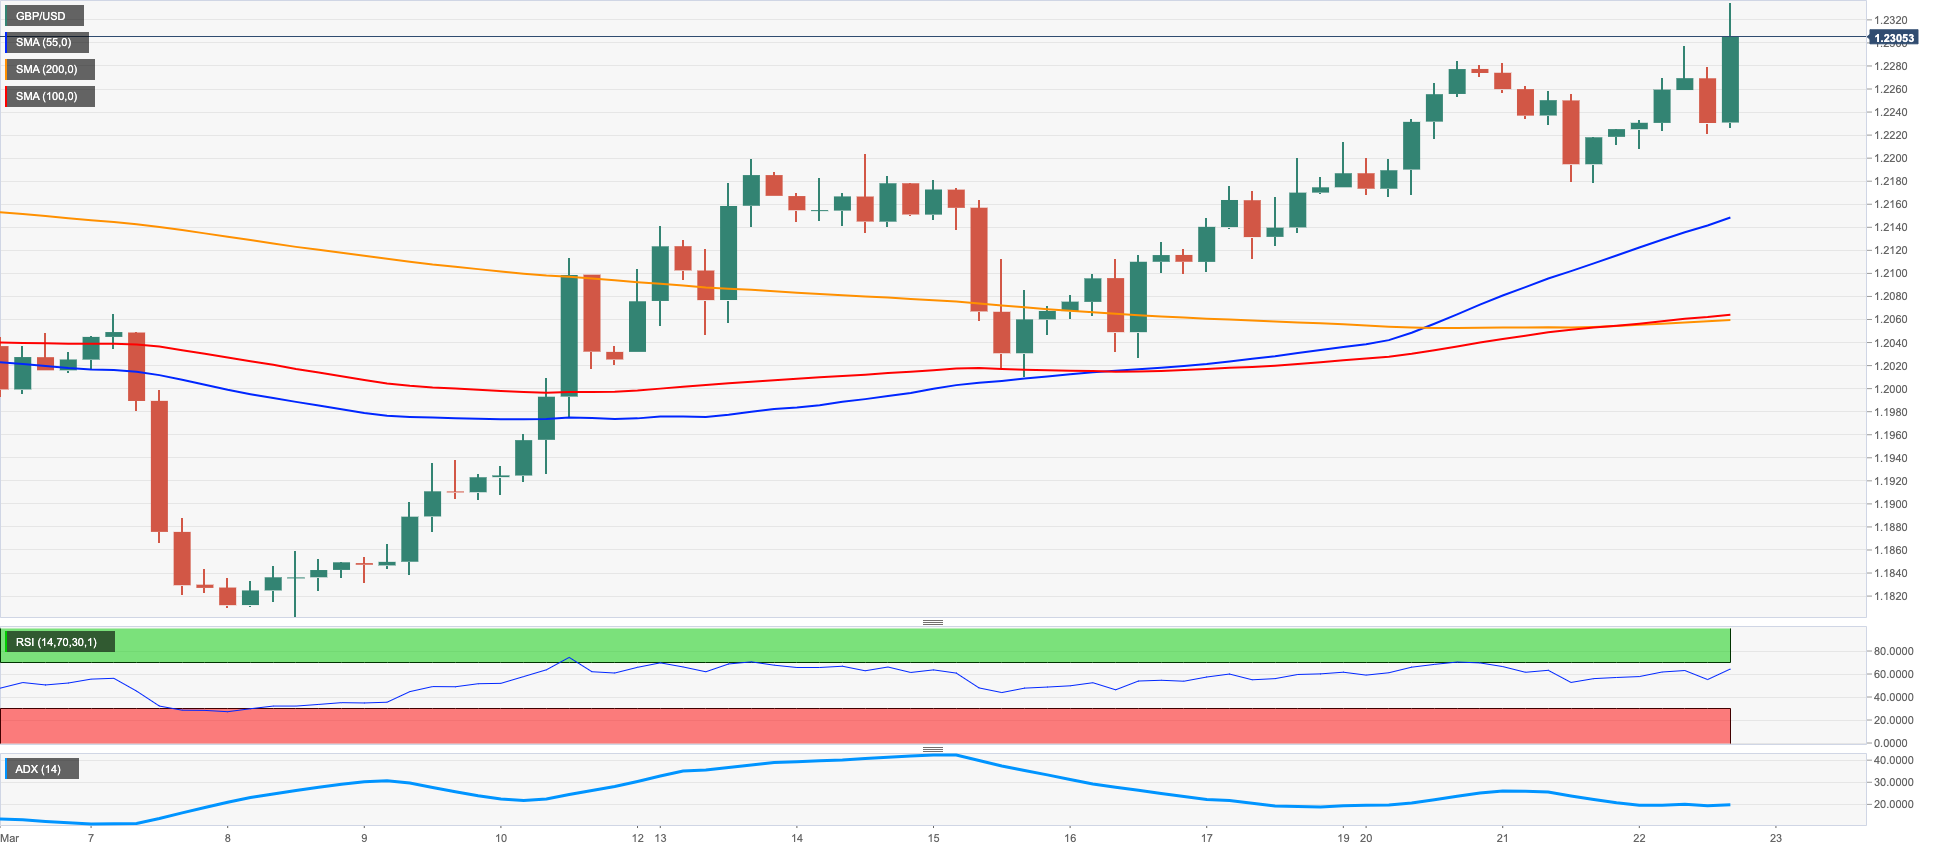
Further weakness in the greenback propelled GBP/USD to new highs past the 1.2300 hurdle, or multi-week peaks, on Wednesday.
Indeed, the dollar saw its decline accelerate in the wake of the FOMC event and in response to the dovish message from Chair Powell at his press conference.
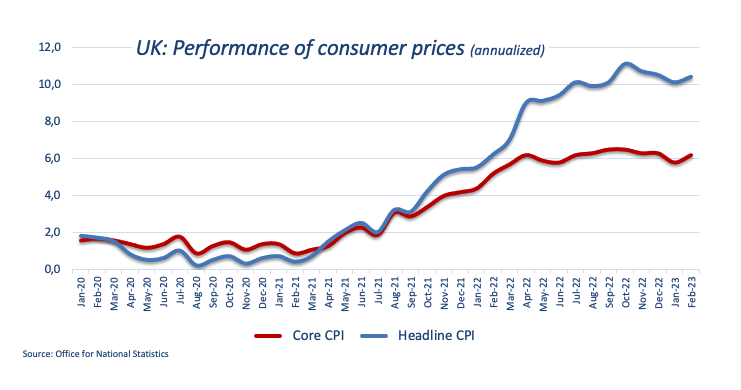
Extra support for the quid came from the higher-than-expected UK inflation figures for the month of February, which is suggestive of further tightening by the BoE in the near-term future.
In fact, headline inflation tracked by the CPI rose at an annualized 10.4% in February (from 10.1%) and 1.1% vs. the previous month. The Core CPI gained 6.2% over the last twelve months. Additional data saw the CBI Industrial Trends Orders drop to -20 in March (from -16).
GBP/USD printed a new March high 1.2334 (March 22). The surpass of this level could open the door to a test of the 2023 top at 1.2447 (January 23) ahead of the May 2022 peak at 1.2666 (May 27) and the 200-week SMA at 1.2871, all preceding the psychological 1.3000 mark. The other way around, the 55- and 100-day SMAs at 1.2139 and 1.2070 should offer temporary contention, respectively, ahead of the key 200-day SMA at 1.1891 and the 2023 low at 1.1802 (March 8). Down from here should emerge the November 2022 low at 1.1142 (November 4). The daily RSI picked up pace and trespassed 60.
Resistance levels: 1.2334 1.2401 1.2447 (4H chart)
Support levels: 1.2178 1.2059 1.2010 (4H chart)
AUDUSD
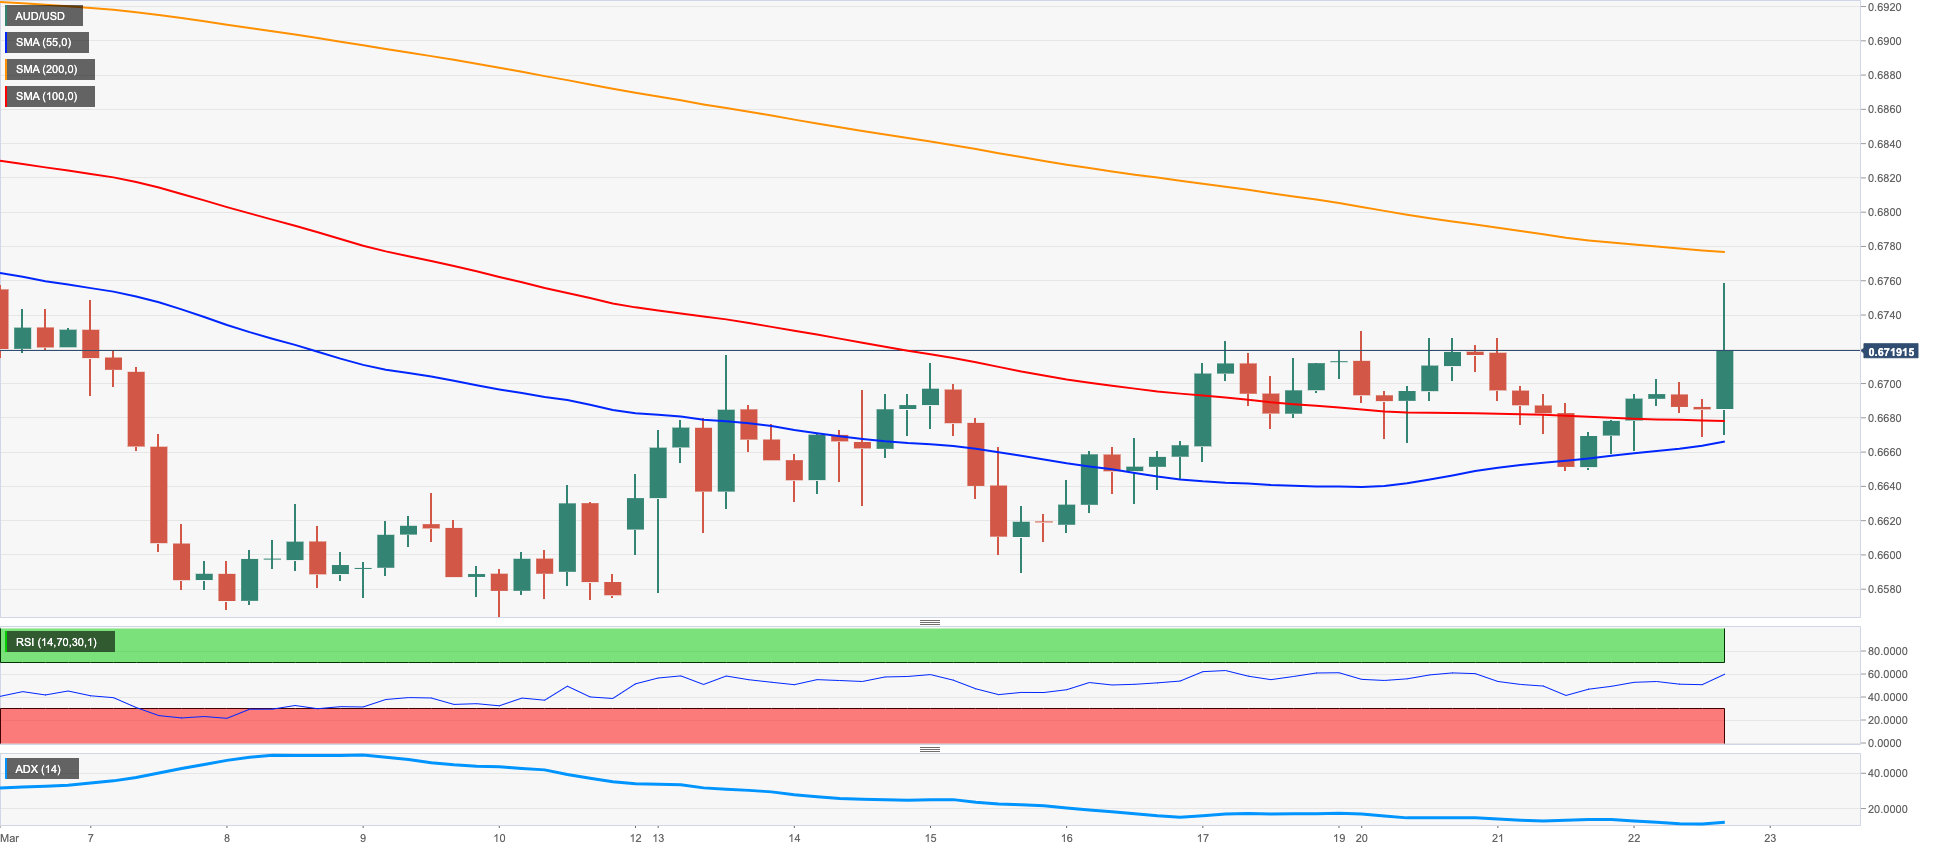
AUD/USD maintained the weekly choppy activity in place and trimmed Tuesday’s losses, briefly managing to poke with the key 200-day SMA near 0.6760.
The upbeat tone in the Australian currency came in a context of further selling pressure around the greenback, which remained well on the defensive following the dovish tone at Powell’s press conference.
In addition, the broad-based upbeat mood in the commodity universe lent some oxygen to the Aussie dollar on the back of further gains in copper prices and a marginal drop in the iron ore.
In addition, AUD managed to somehow leave behind part of the recent negative mood in the wake of the dovish message from the RBA Minutes of the March gathering.
Data wise in Oz, the Leading Index tracked by Westpac “improved” a tad to -0.06% for the month of February (from -0.12%).
The continuation of the uptrend in AUD/USD continues to face the immediate obstacle at the weekly peak at 0.6730 (March 20) followed by key 200-day SMA at 0.6759 and another weekly peak at 0.6783 (March 1), which appears reinforced by the temporary 100-day SMA. The surpass of this region exposes a test of the provisional 55-day SMA at 0.6856 ahead of the weekly top at 0.6920 (February 20) and the key round level at 0.7000. By contrast, there are no support levels of note until the 2023 low at 0.6563 (March 10) seconded by the weekly low at 0.6386 (November 10 2022) and the November 2022 low at 0.6272 (November 3). The daily RSI edged higher and surpassed 47.
Resistance levels: 0.6758 0.6778 0.6815 (4H chart)
Support levels: 0.6649 0.6589 0.6563 (4H chart)
GOLD
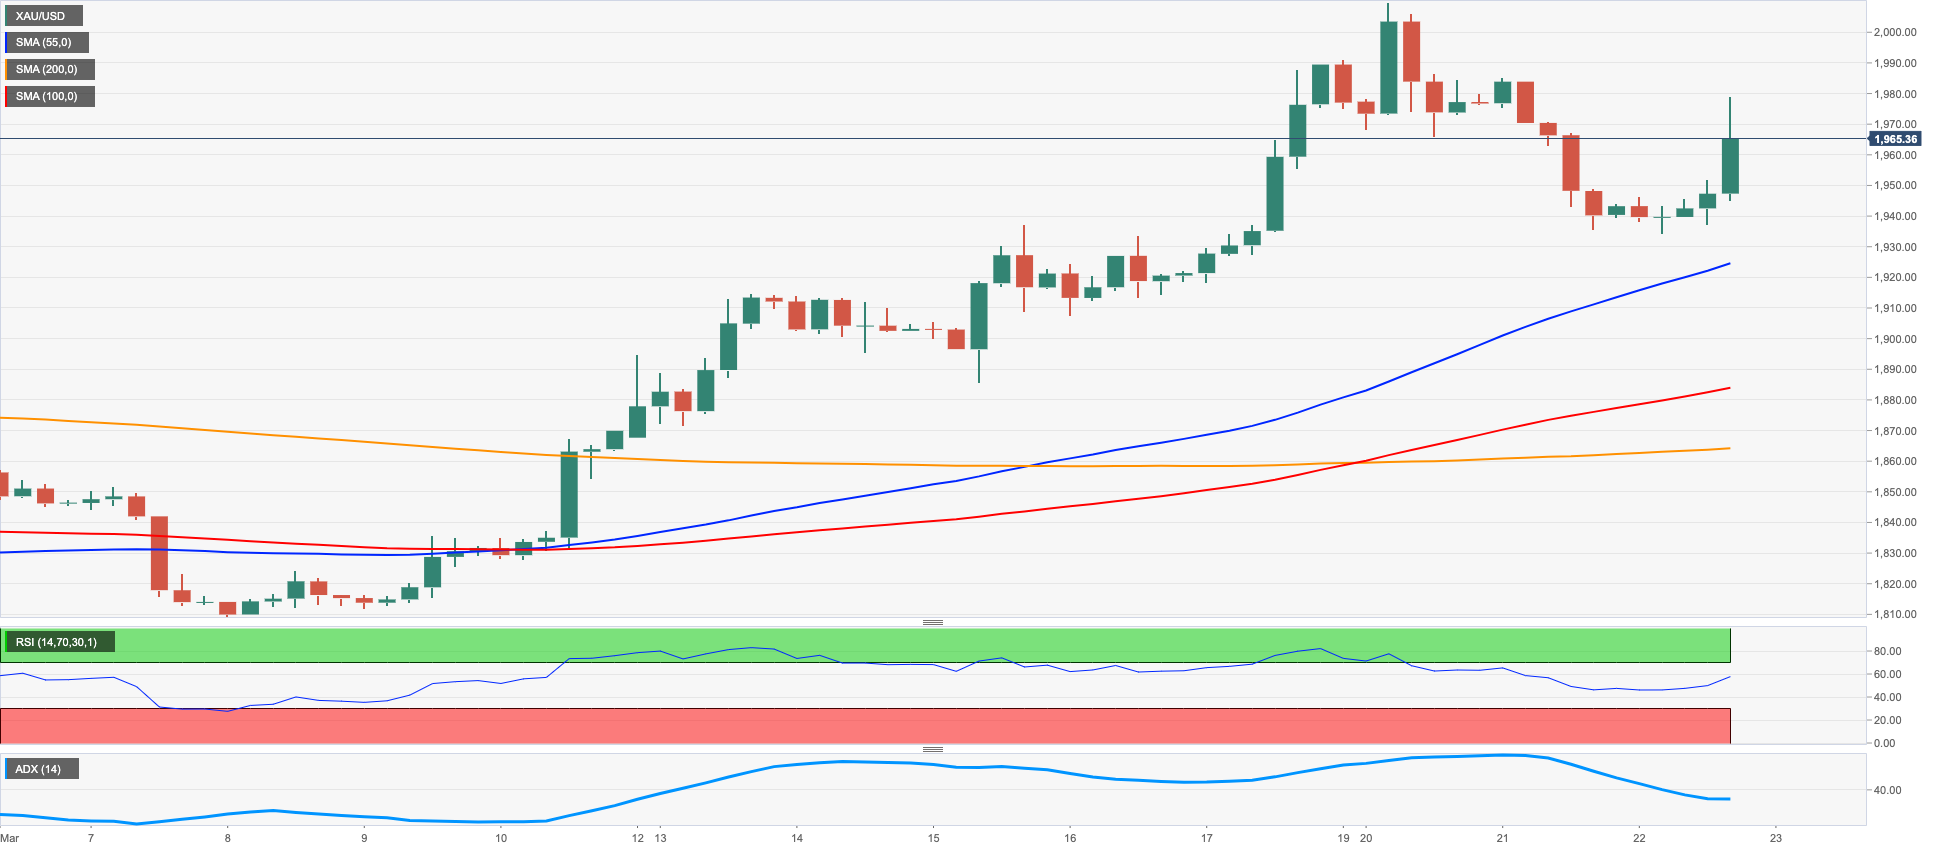
Extra selling bias hitting the greenback renewed the demand for the safe haven metal and prompted prices of the ounce troy to regain the vicinity of the $1980 region on Wednesday.
In fact, bullion’s upside gathered extra steam in response to the dovish hike by the Federal Reserve, while the dovish message from Chief Powell also exacerbated the dollar’s sell-off.
In addition, US yields set aside the weekly recovery and headed southwards soon after Powell’s press conference, which in turn morphed into extra wings for the precious metal.
If bulls regain control of the sentiment, gold should retarget the 2023 top at $2009 prior to the 2022 peak at $2070 (March 8) and the all-time high at $2075 (August 72020). By contrast, the yellow metal faces provisional contention levels at the 55- and 100-day SMAs at $1882 and $1830, respectively, before the March low at $1809 (March 8) and the 2023 low at $1804 (February 28). Further south comes the key $1800 zone, while the loss of this area exposes a probable drop to the 200-day SMA at $1779.
Resistance levels: $2009 $2070 $2075 (4H chart)
Support levels: $1934 $1885 $1863 (4H chart)
CRUDE WTI
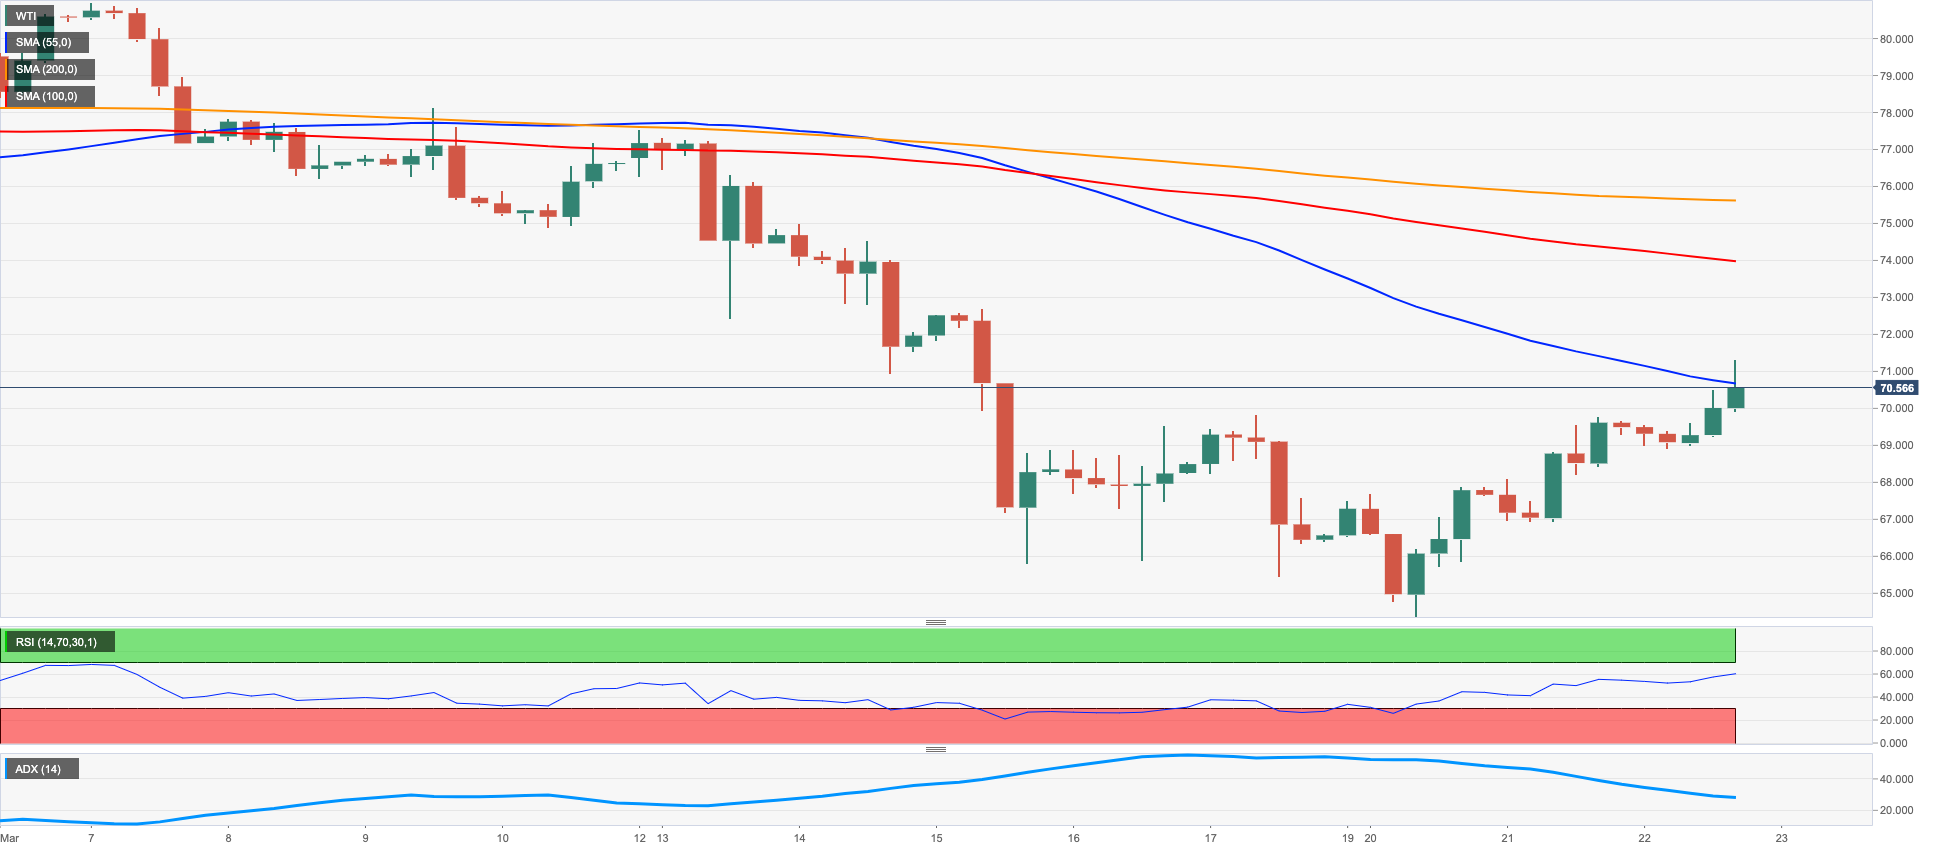
WTI prices edged higher for the third session in a row and printed fresh multi-session tops past the $71.00 mark per barrel on Wednesday.
Indeed, the weaker dollar collaborated with the continuation of the weekly upside bias in the commodity and rapidly helped traders forget about the unexpected 1.117M barrels build in crude oil inventories in the week to March 17, as per the latest EIA report.
Further results from the report appeared to have supported crude oil after supplies at Cushing shrank by 1.063M barrels, Weekly Distillate Stocks dropped more than expected by 3.313M barrels and gasoline stockpiles contracted sharply by 6.400M barrels.
News from the OPEC+ cited the cartel still plans to reduce the oil output by 2 mbpd by end of 2023.
If the WTI breaks above the $70.00 barrier in a sustainable fashion, it could then challenge interim resistance levels at the 55- and 100-day SMAs at $76.50 and $78.17, respectively, ahead of the March top at $80.90 (March 7) and the 2023 peak at $82.60 (January 23). Having said that, below the 2023 low at $64.41 (March 20), WTI could put the December 2021 low at $62.46 (December 2) to the test prior to the August 2021 low at $61.76 (August 23) and the key $60.00 mark.
Resistance levels: $71.27 $72.51 $75.45 (4H chart)
Support levels: $64.41 $62.42 $61.72 (4H chart)
GER40
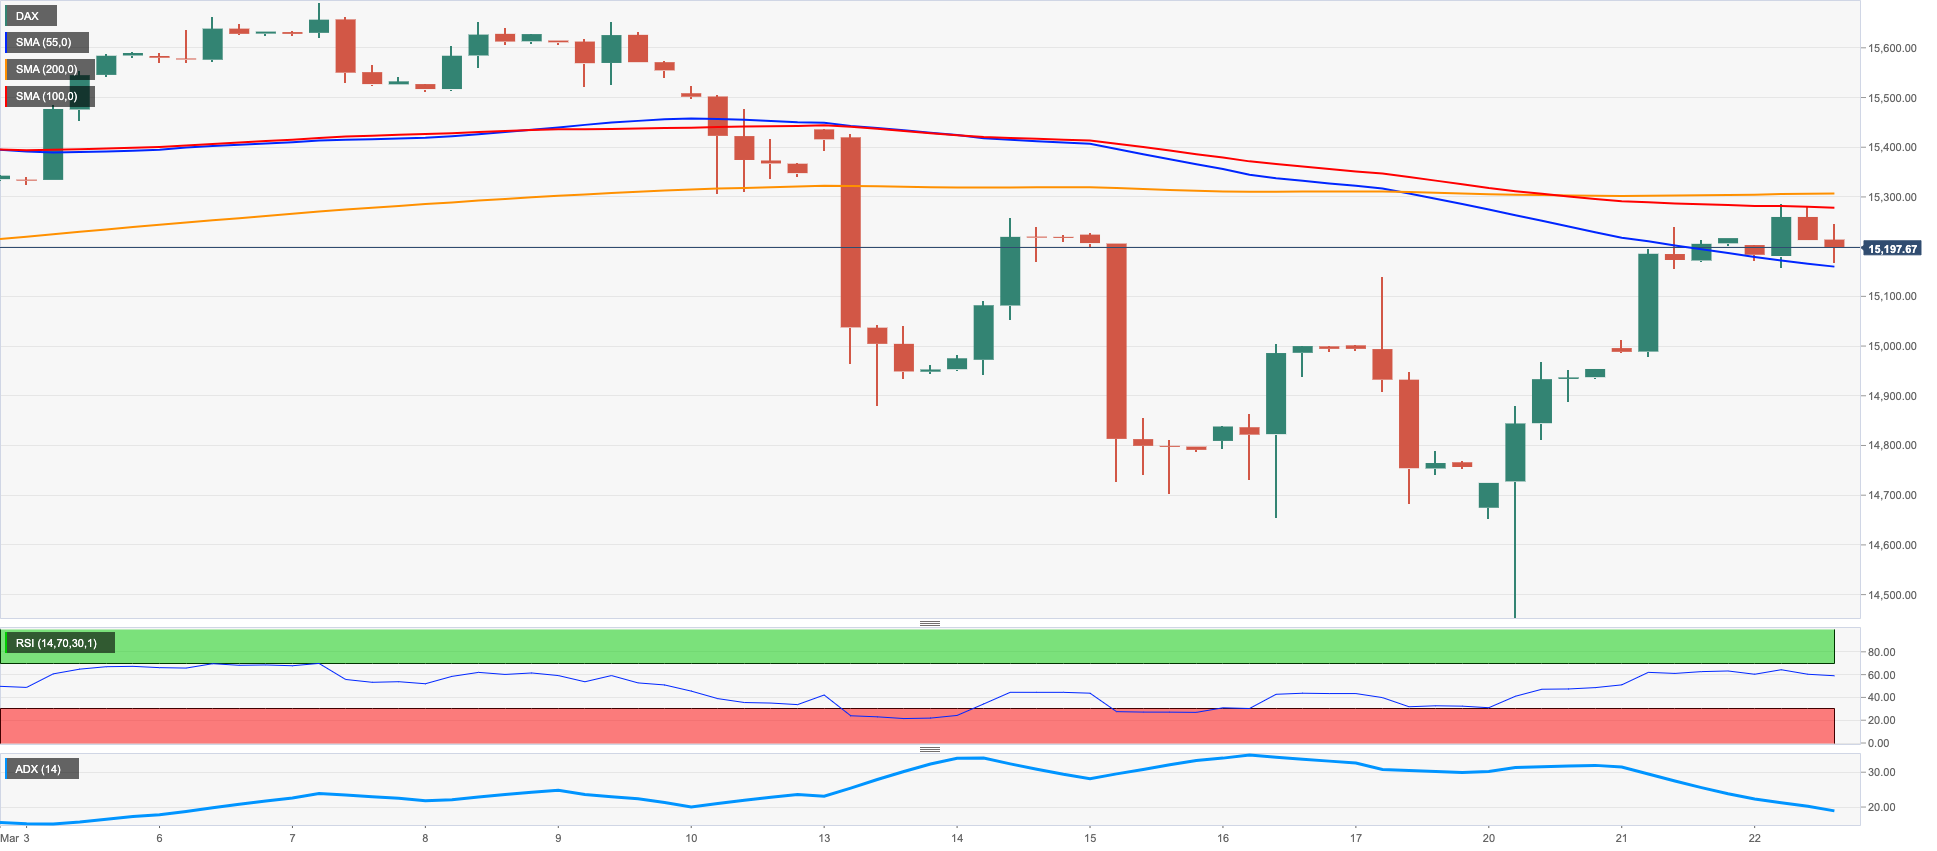
The generalized cautious tone among traders did not prevent European stock markets to close mostly with decent gains on Wednesday, with the sole exception of the Spanish reference IBEX35 (-0.49%).
As a matter of fact, investors remained slightly on the positive side following the higher-than-expected UK inflation figures during February, which should prompt the Bank of England (BoE) to maintain the tightening stance unaltered for the time being.
Furthermore, prudence among traders remained on the rise ahead of the key FOMC event in the European evening, where the Fed is expected to hike rates by 25 bps.
In the German docket, the 10-year Bund auction came at 2.32% (from 2.56%), while Bundesbank’s J.Nagel said earlier in the session that there is still some work to do when it comes to (hiking) interest rates, at the time when he acknowledged they’re approaching the restrictive area.
The breakout of the weekly peak at 15298 (March 22) could motivate the DAX40 to confront the 2023 high at 15706 (March 6) prior to the February 2022 top at 15736 (February 2 2022). Further up comes the round level at 16000 ahead of the 2022 peak at 16285 (January 5). On the flip side, the 100-day SMA at 14736 is expected to hold the downside temporarily prior to the March low at 14458 (March 20). The loss of the latter could pave the way for a deeper correction to the key 200-day SMA at 13859 before the December 2022 low at 13791 (December 13). The daily RSI advanced marginally beyond 50.
Best Performers: Covestro, Zalando SE, Henkel VZO
Worst Performers: Vonovia, Commerzbank, Adidas
Resistance levels: 15273 15495 15706 4H chart)
Support levels: 15011 14458 13791 (4H chart)
NASDAQ
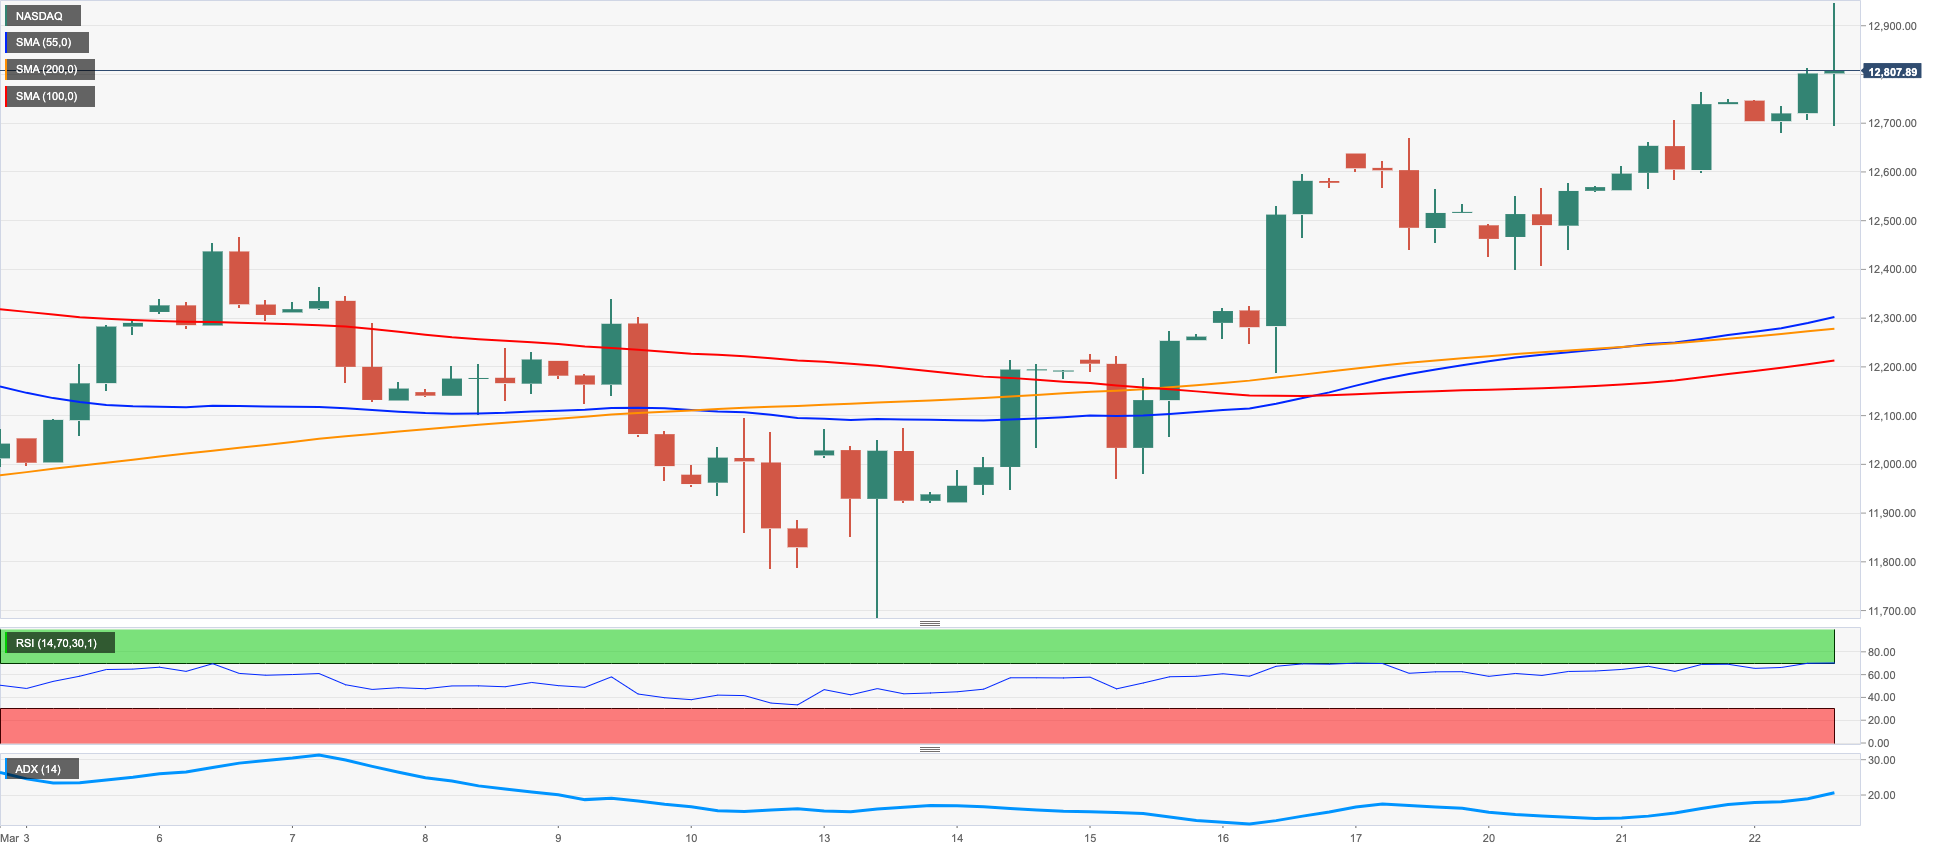
The tech reference Nasdaq 100 advanced decently on Wednesday and traded at shouting distance from the 2023 peak recorded in early February.
The third consecutive daily gain in the index came on the back of the firm appetite for the risk complex., particularly magnified following the dovish tilt at Powell’s press conference after the Federal Reserve raised rates by 25 bps, as widely anticipated.
The Nasdaq 100 clinched a new March top at 12811 (March 22) closely followed by the 2023 peak at 12880 (February 2). The breakout of this level exposes a potential visit to the round level at 13000 ahead of the weekly high at 13175 (August 26 2022). Just the opposite, the 55-day SMA at 12023 should offer some provisional support ahead of the key 200-day SMA at 11904, which appears just before the March low at 11695 (March 13). Extra weakness could revisit lows at 11550 (January 25) and 11251 (January 19) ahead of the 2023 low at 10696 (January 6) and the December 2022 low at 10671 (December 22). The daily RSI improved to the vicinity of the 64 area.
Top Gainers: AMD, NVIDIA, Lulemon Athletica
Top Losers: PDD Holdings DRC, Align, IDEXX Labs
Resistance levels: 12811 12880 13175 (4H chart)
Support levels: 11904 11695 11251 (4H chart)
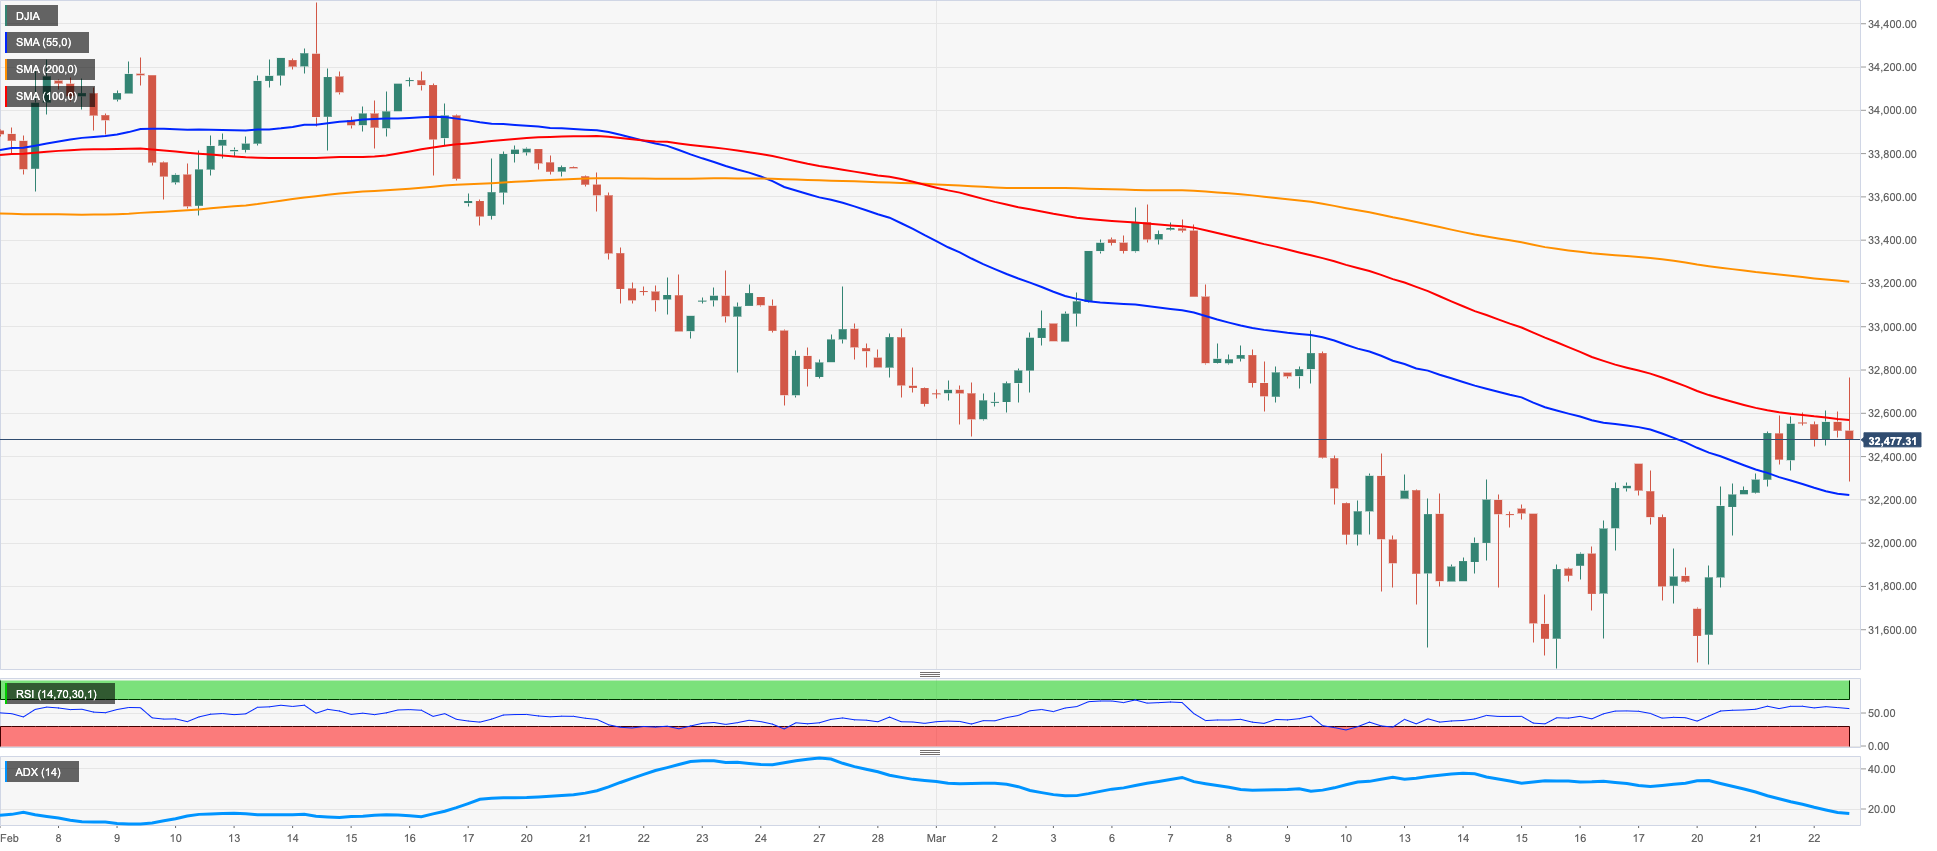
DOW JONES
Equities tracked by the US reference Dow Jones halted the weekly upside after two straight sessions with gains amidst the mixed performance around US stocks on Wednesday.
In fact, the index and its peers regained downside traction following the dovish hike by the Federal Reserve and the generalized dovish tone from Powell’s press conference.
All in all, the Dow Jones retreated 0.49% to 32399, the S&P500 deflated 0.17% to 3996 and the tech-benchmark Nasdaq Composite rose 0.17% to 11880.
Immediately to the upside for the Dow Jones emerges the 33300 region, home of the 55- and 100-day SMA. Further north aligns the March high at 33572 (March 6) ahead of the 2023 top at 34342 (January 13) and the December 2022 peak at 34712 (December 13). Extra gains from here should target the April 2022 high at 35492 (April 21). In opposition, the loss of the 2023 low at 31429 (March 15) could spark a move to the key 30000 yardstick prior to the 2022 low at 28660 (October 13). The daily RSI climbed past the 48 level.
Top Performers: Microsoft, Procter&Gamble, Visa A
Worst Performers: Nike, Boeing, Travelers
Resistance levels: 32614 32990 33316 (4H chart)
Support levels: 31429 28660 26143 (4H chart)
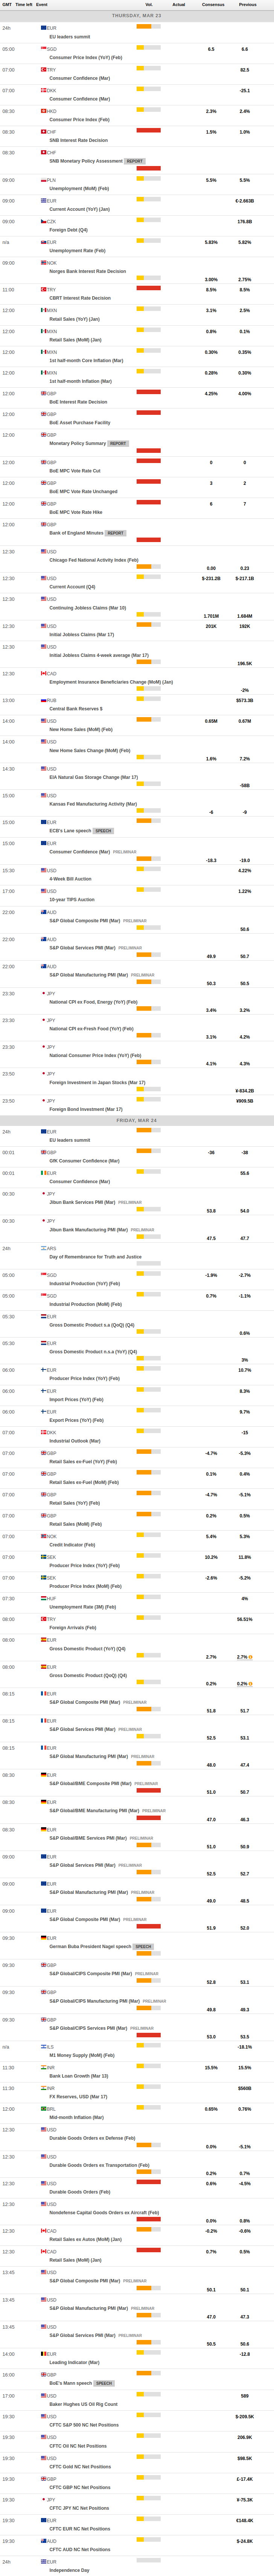
MACROECONOMIC EVENTS
All Information & Updates provided by:

All information relating to the financial markets available on this page has been prepared and issued by FXStreet (Forexstreet SL, Spain, Reg: B62498233) on the basis of publicly available information and all information believed to be reliable and does not conflict with Kuwaiti local laws, and all necessary care has been taken to before the company to ensure that the facts mentioned are correct from the source.
NCM Investment nor any of its directors or employees shall in any way be held responsible for the contents of this news, and the information contained on this page is intended only to provide clients with publicly available information and should not be construed as investment advice, report or analysis and/or constitute an offer or invitation to buy or sell financial instruments of any kind.
RISK WARNING: Forex and CFDs are highly risky leveraged products, as losses can exceed deposits. Please ensure you understand all the risks and take independent advice if necessary. NCM will segregate the clients based on the criteria of the regulator and its bylaws. NCM does not provide any advisory service; the material published does not constitute advice or a recommendation for a transaction in any financial instrument. NCM accepts no responsibility for any use of the content presented and any consequences of that use. Anyone acting on the information provided does so at their own risk.