
- Contact Us:
-

-

-

-


Daily Market Updates
24 Mar 2023
USDJPY
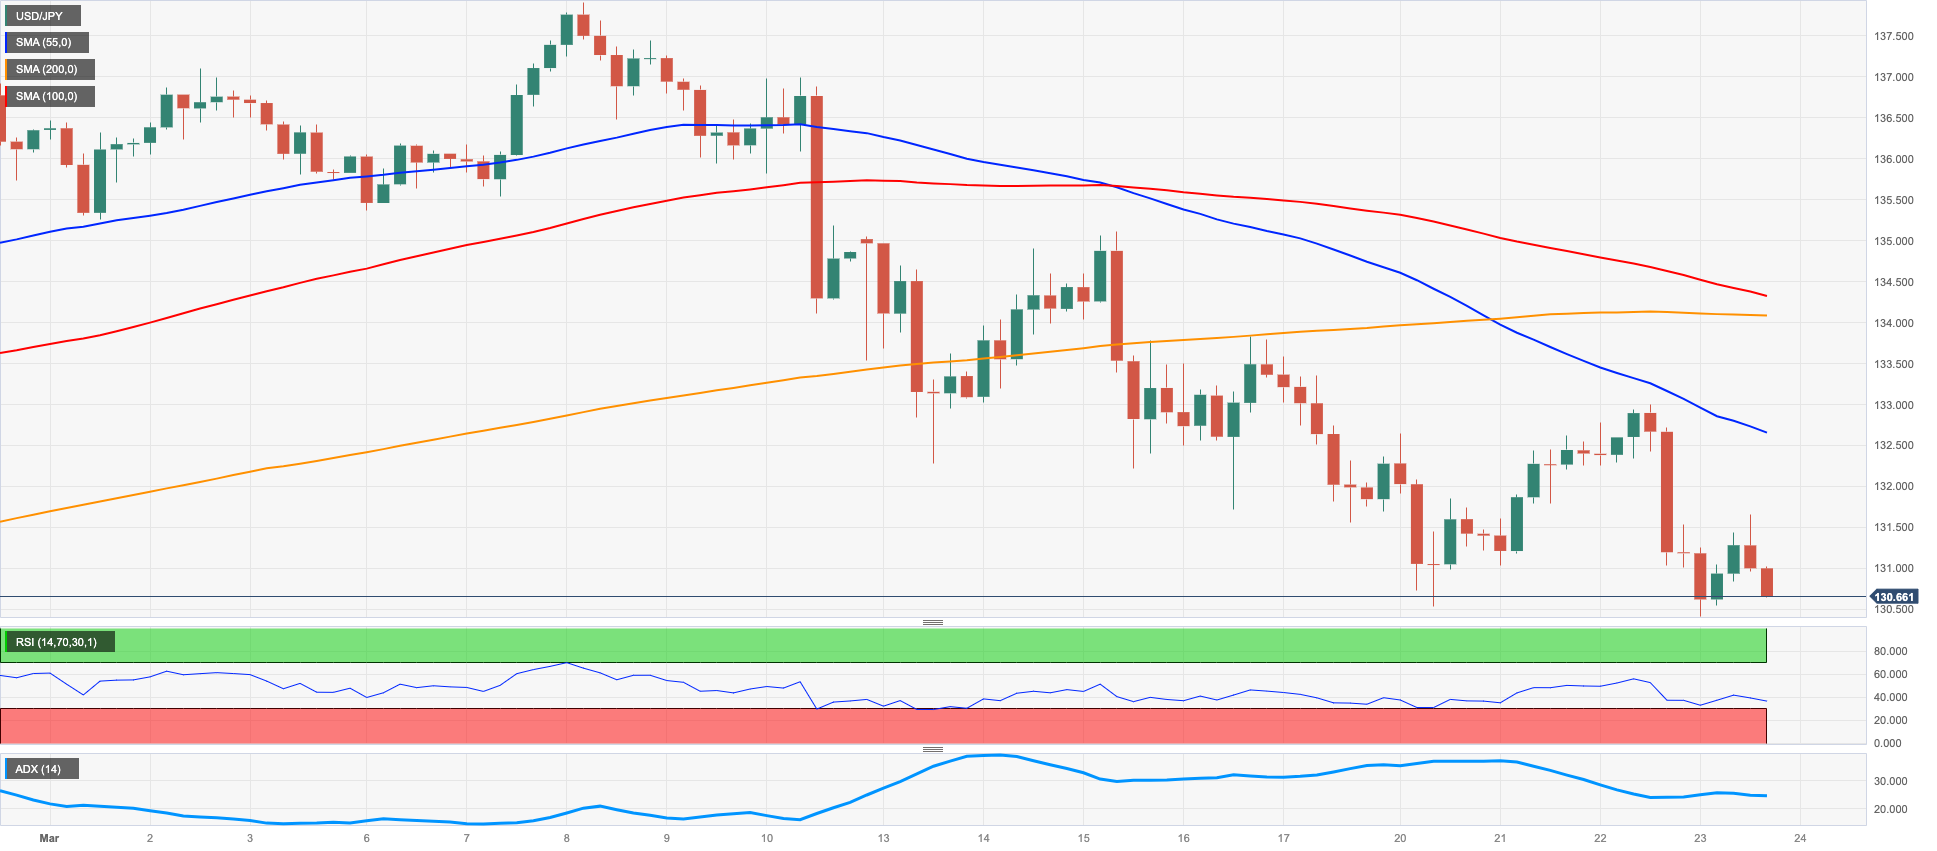
The combination of the persistent downside pressure in the greenback with the absence of upside traction in US yields across the curve encouraged sellers to remain in control and dragged USD/JPY to new 6-week lows near 130.40 on Thursday.
Indeed, spot added to Wednesday’s losses pari passu with investors’ adjustment to the latest decision by the Federal Reserve to raise the Fed Funds Target Range (FFTR) by 25 bps, while speculation of a potential pause in the Fed’s hiking cycle also kept the price action around the buck subdued.
In the money market, the demand for the JGB 10-year bond depressed yields to the area below 0.30%, reversing at the same time Wednesday’s uptick.
In Japan, the Reuters Tankan Index improved to -3 in March (from -5) in what was the sole scheduled event in the calendar.
In case the downtrend gathers impulse, USD/JPY could revisit the psychological support at 130.00, which is closely followed by the weekly low at 129.79 (February 10) prior to the February low at 128.08 (February 2) and the 2023 low at 127.21 (January 16). The other way around, there is a provisional barrier at the 100-day SMA at 134.59 prior to the more significant 200-day SMA at 137.41 and just before the 2023 top at 137.91 (March 8). The surpass of the latter could open the door to weekly peaks at 138.17 (December 15 2022) and 139.89 (November 30 2022) seconded by the key round level at 140.00. The daily RSI receded to the vicinity of the 37 region.
Resistance levels: 133.00 133.82 135.11 (4H chart)
Support levels: 130.41 129.79 129.08 (4H chart)
GBPUSD
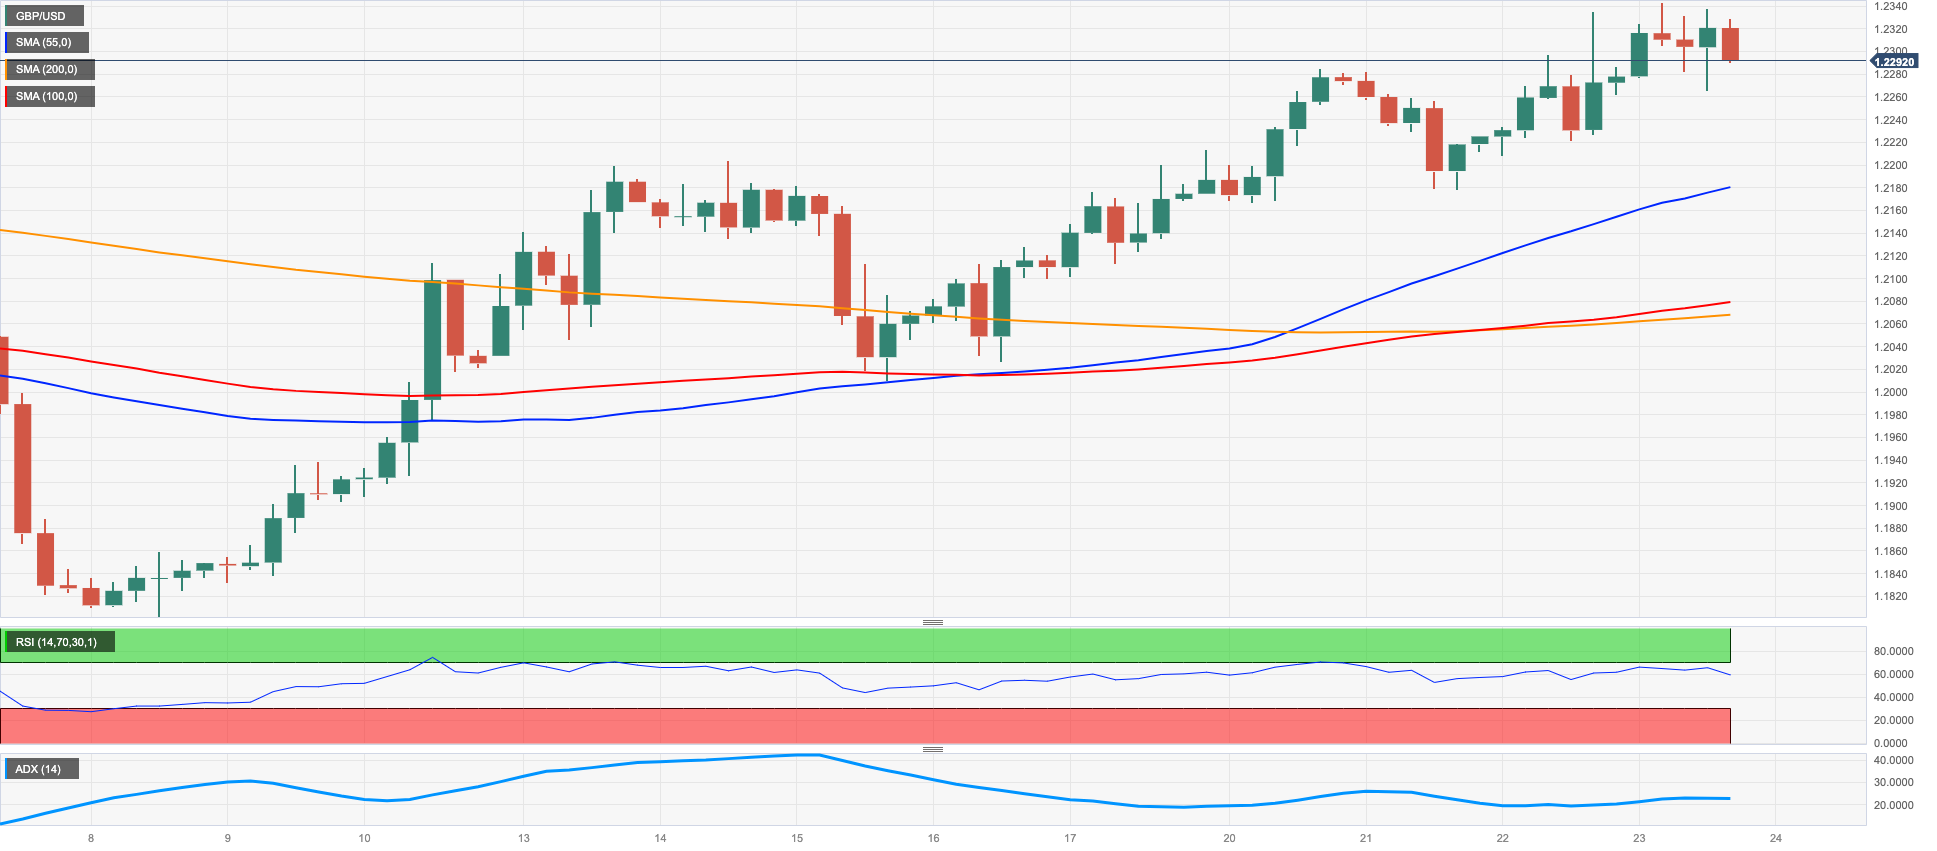
GBP/USD extended the weekly rebound north of the key 1.2300 the figure for the first time since early February on Thursday.
In fact, Cable’s upside momentum remained once again underpinned by another negative performance of the greenback as investors continued to assess Wednesday’s dovish hike by the Fed.
Further buying interest around the quid emerged after the BoE matched previous estimates and hiked the policy rate by 25 bps at its meeting earlier on Thursday. As expected, MPC members S.Tenreyro and V.Dhingra voted to keep rates unchanged.
Following the BoE statement, inflation is predicted to drop rapidly in Q2 2023, while the GDP is seen improving tepidly during the same period.
The banking sector was also in the centre of the debate, particularly after recent events in the US and Europe. On this, the Financial Policy Committee (FPC) noted that the UK banking system remains “resilient”.
At his press conference, Governor A.Bailey said he perceives that inflation is peaking, while he remained uncertain whether the interest rate has reached a top.
Once GBP/USD clears the March top 1.2343 (March 23), it should then challenge the 2023 peak at 1.2447 (January 23) prior to the May 2022 high at 1.2666 (May 27) and the 200-week SMA at 1.2871, all before the psychological 1.3000 hurdle. On the contrary, there are interim support levels at the 55- and 100-day SMAs at 1.2147 and 1.2082, respectively, seconded by the weekly low at 1.2010 (March 15) and the key 200-day SMA at 1.1891. South from here emerges the 2023 low at 1.1802 (March 8) followed by the November 2022 low at 1.1142 (November 4). The daily RSI advanced further and flirted with 60.
Resistance levels: 1.2343 1.2401 1.2447 (4H chart)
Support levels: 1.2175 1.2066 1.2010 (4H chart)
AUDUSD
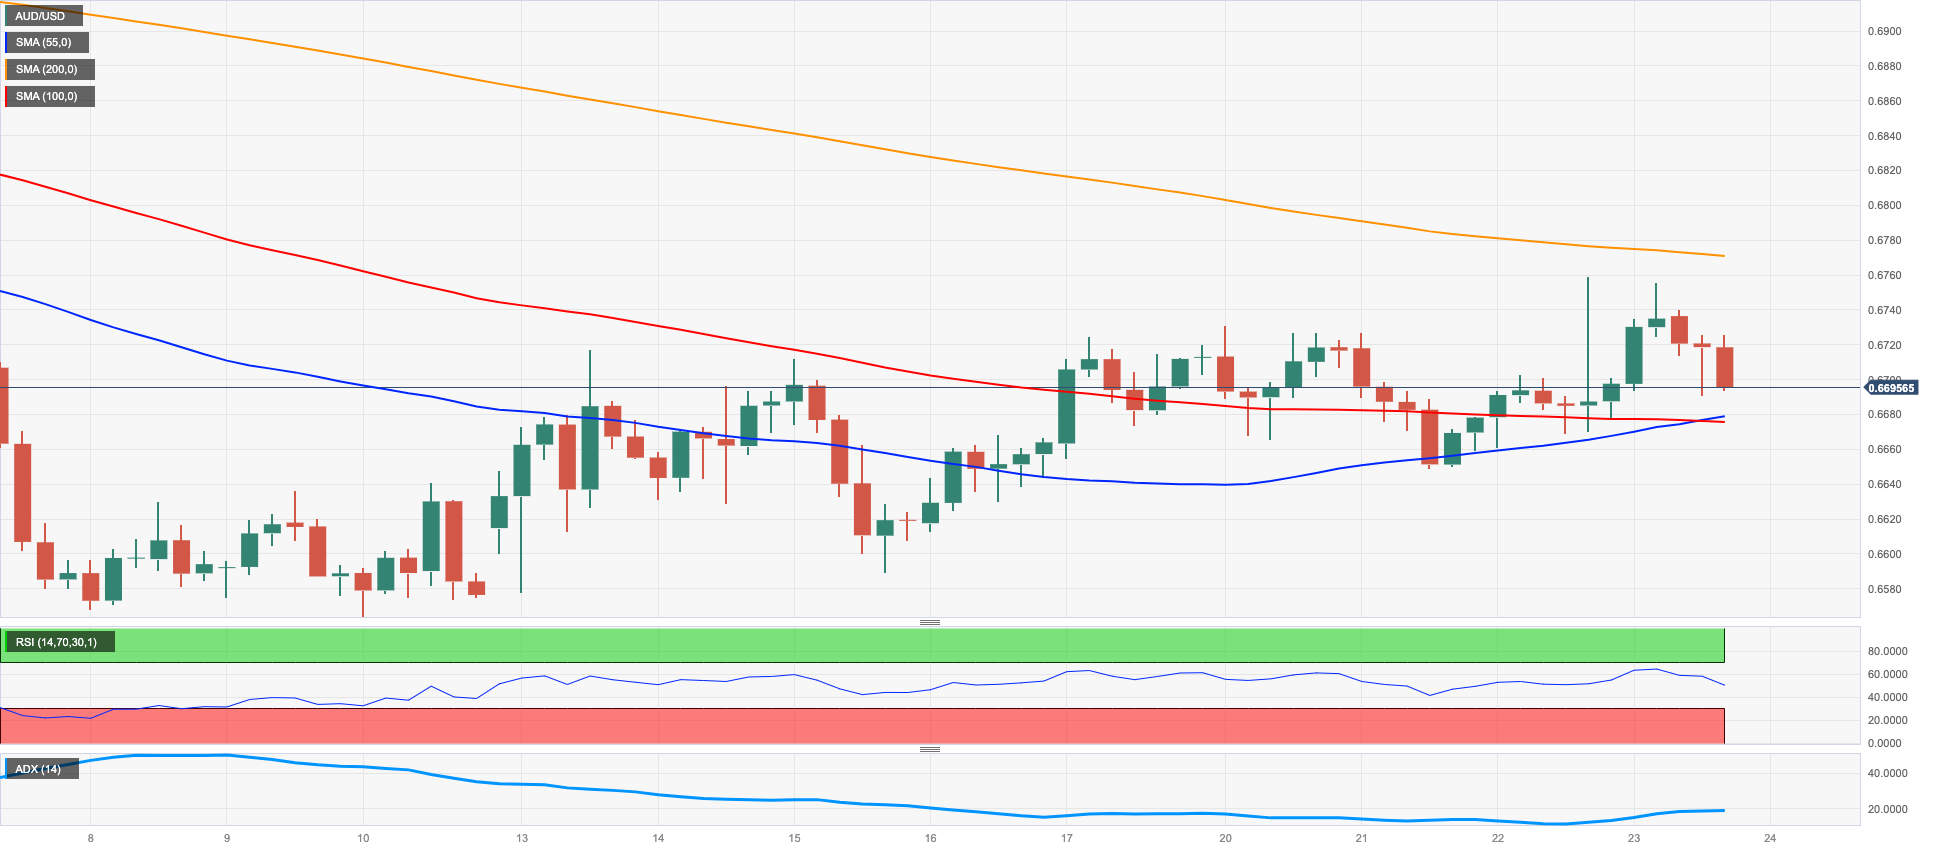
AUD/USD left behind two consecutive daily retracements and managed to retake the 0.6700 barrier and beyond on Thursday.
In fact, further selling interest kept the greenback under heightened pressure and supported the recovery in the risk-linked galaxy, although the mixed tone in the commodity complex appears to have limited the upside potential in the Aussie dollar somewhat.
On the latter, copper prices extended the sharp rebound for the sixth consecutive session, while the iron ore maintained the snail-paced decline.
The calendar Down Under was empty on Thursday, leaving the attention to Friday’s releases of flash PMIs for the month of March.
If the rebound in AUD/USD becomes more serious, the next up-barrier remains at the March peak at 0.6758 (March 22), an area coincident with the key 200-day SMA. Once cleared, spot could dispute the weekly high at 0.6783 (March 1), which is closely followed by the provisional 100-day SMA at 0.6789 and seconded by the interim 55-day SMA at 0.6856. The surpass of this region exposes the weekly top at 0.6920 (February 20) before the key round level at 0.7000. On the opposite side, the 2023 low at 0.6563 (March 10) appears as the immediate contention area ahead of the weekly low at 0.6386 (November 10 2022) and the November 2022 low at 0.6272 (November 3). The daily RSI ticked higher and surpassed the 46 mark.
Resistance levels: 0.6758 0.6775 0.6815 (4H chart)
Support levels: 0.6649 0.6589 0.6563 (4H chart)
GOLD
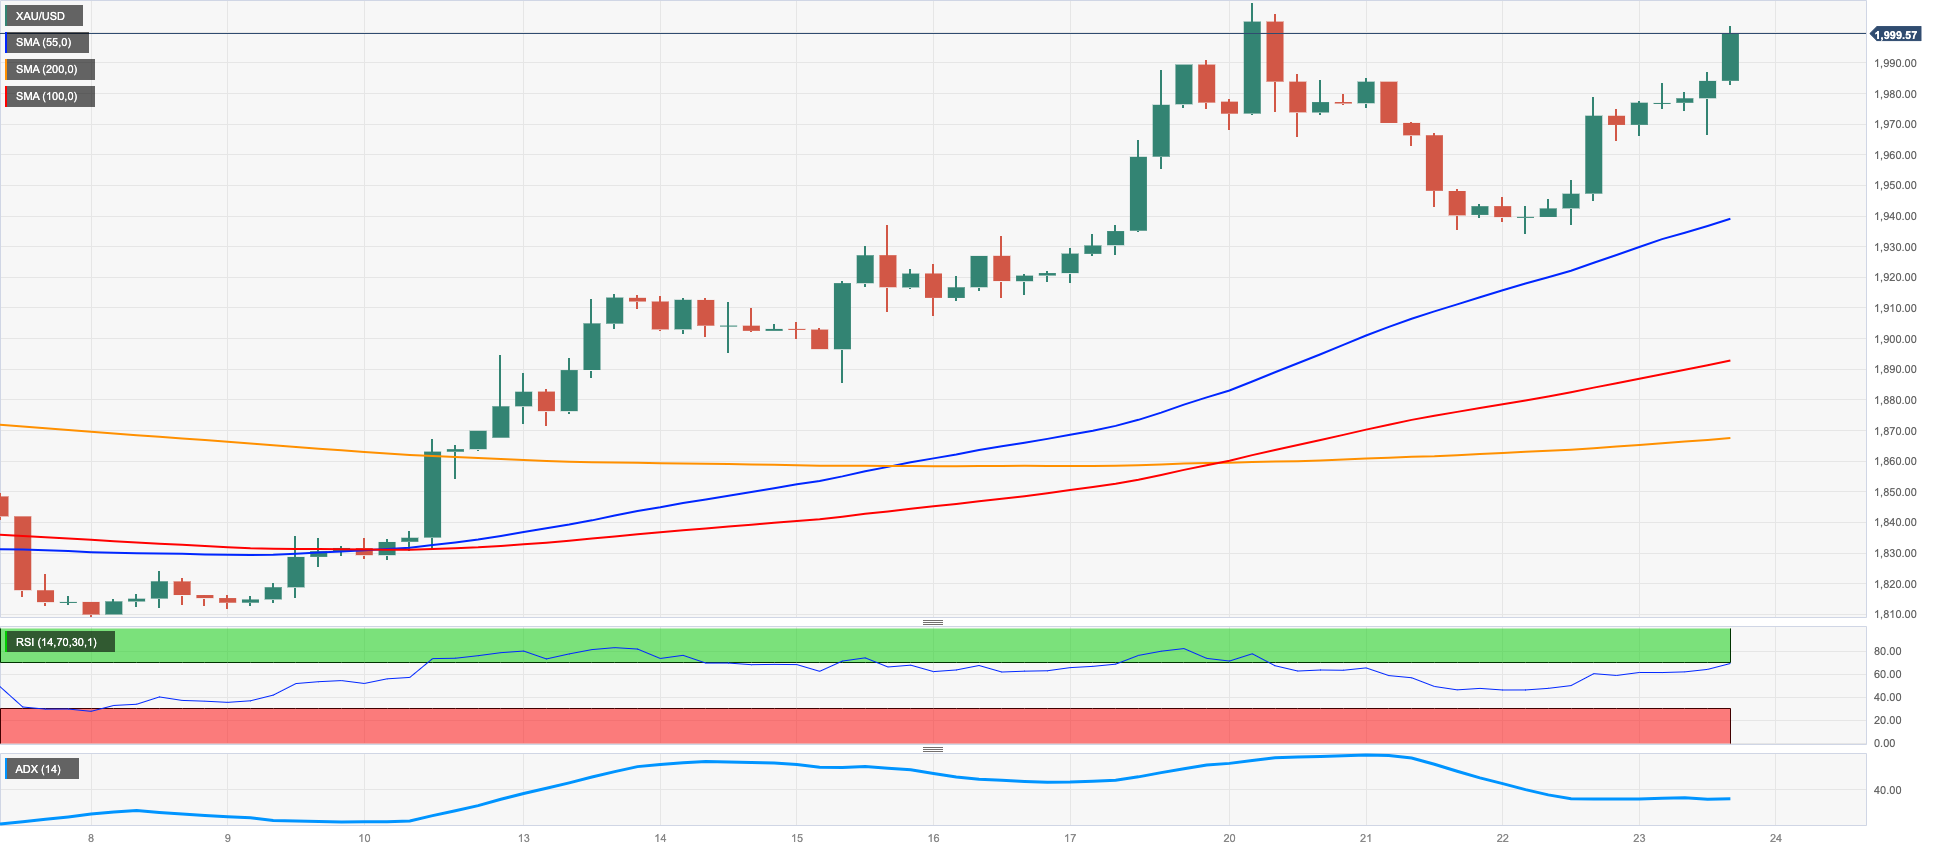
Gold prices remained firm and revisited the key $2000 barrier per ounce troy on Thursday, up for the second session in a row and almost fully recovering the strong pullback seen in the first half of the week.
Indeed, another negative session in the buck saw the USD Index (DXY) retreat to new multi-week lows in the sub-102.00 region, while further investors’ re-assessment of the recent dovish hike by the Federal Reserve and the mixed tone in US yields, all helped the yellow metal to climb to the boundaries of the key $2000 mark.
Following the ongoing bounce, gold prices keep targeting the 2023 peak at $2009 ahead of the 2022 high at $2070 (March 8) and the all-time top at $2075 (August 7 2020). Oppositely, there is a minor support level at the weekly low at $1934 (March 22) ahead of the temporary 55- and 100-day SMAs at $1885 and $1833, respectively. Further losses could retest the March low at $1809 (March 8) followed by the 2023 low at $1804 (February 28) and the 200-day SMA at $1780.
Resistance levels: $2009 $2070 $2075 (4H chart)
Support levels: $1934 $1885 $1863 (4H chart)
CRUDE WTI
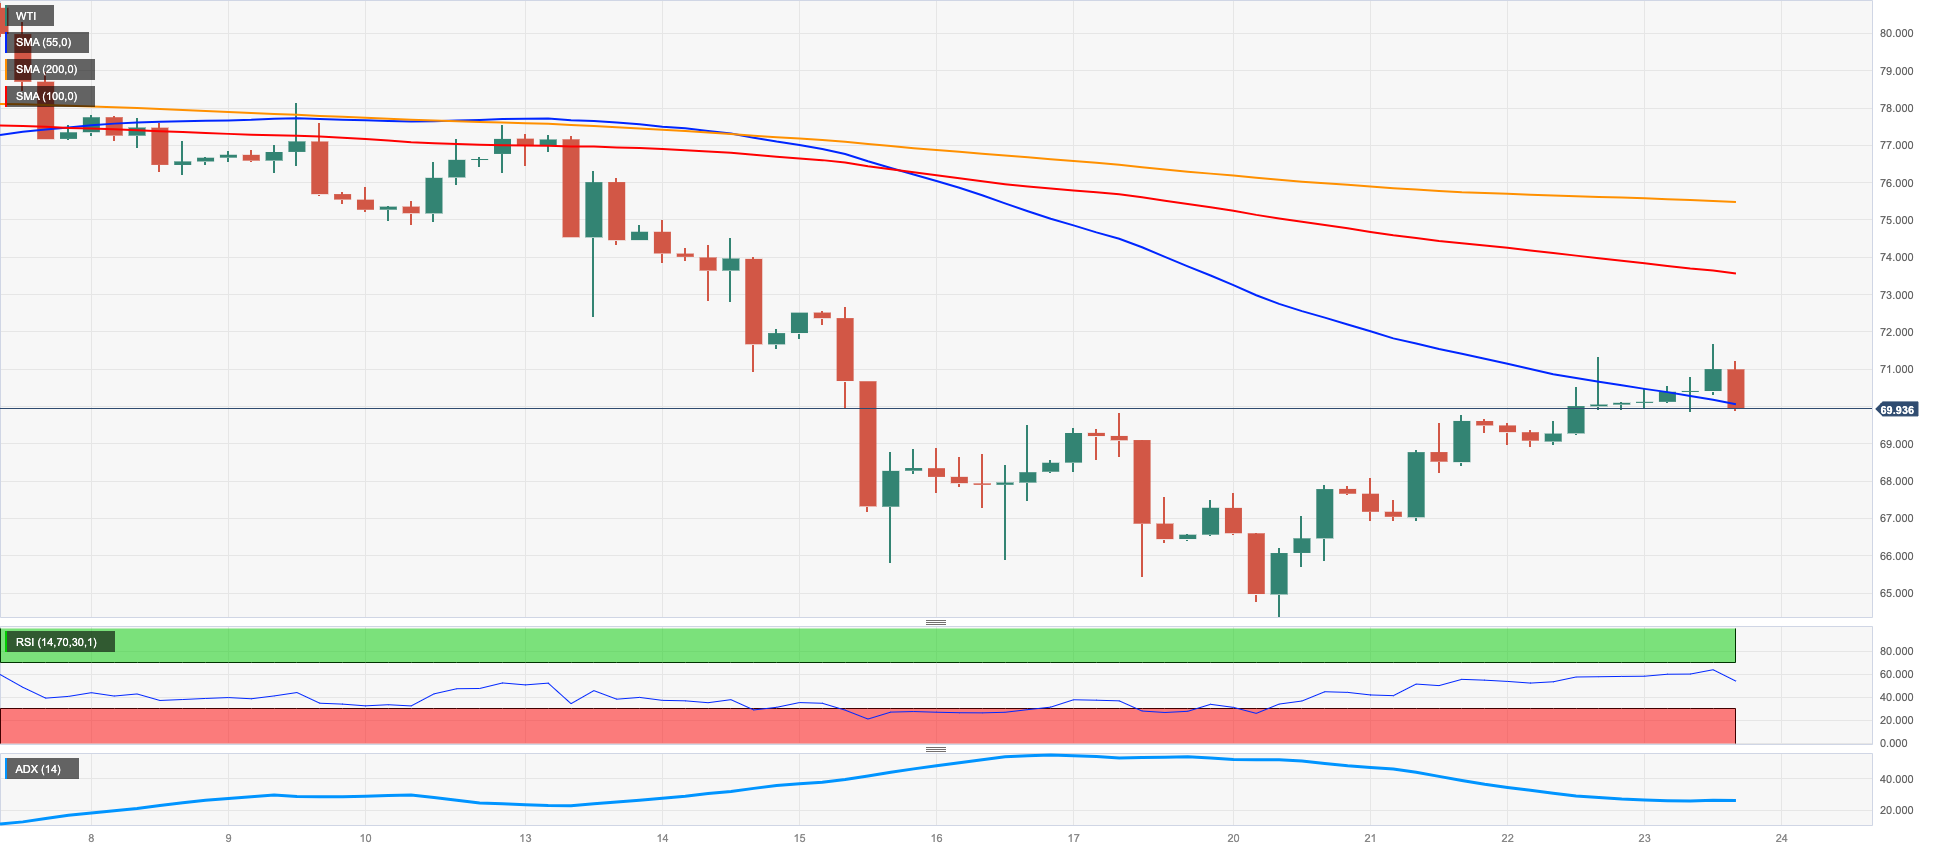
Prices of the American benchmark for the sweet light crude oil marched further north of the $71.00 mark per barrel – or multi-day highs - earlier on Thursday, although they gave up part of that advance towards the end of the NA session.
The extra improvement in the commodity came in response to the persevering decline in the US dollar and easing concerns around a potential economic slowdown, while the pronounced bounce in gasoline prices collaborated with the upside in the WTI.
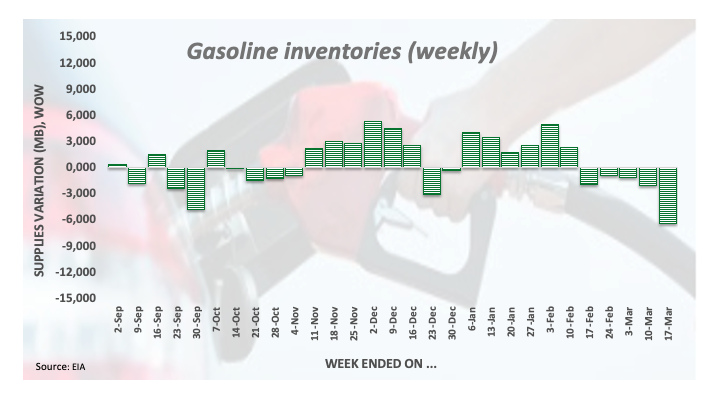
The latter was also underpinned by the sharp drop in gasoline stockpiles in the week to March 17, as per Wednesday’s EIA weekly report (-6.400M barrels). On this, the RBOB gasoline futures rose to multi-day highs past $2.65 earlier on Thursday.
Further upside in the WTI needs to clear the weekly top at $71.63 (March 23) prior to temporary hurdles at the 55- and 100-day SMAs at $76.43 and $77.99, respectively. Further up appears the March peak at $80.90 (March 7) seconded by the 2023 high at $82.60 (January 23). On the other hand, the immediate support aligns at the 2023 low at $64.41 (March 20) ahead of the December 2021 low at $62.46 (December 2) and the August 2021 low at $61.76 (August 23), all preceding the key $60.00 mark per barrel.
Resistance levels: $71.63 $72.51 $75.33 (4H chart)
Support levels: $64.41 $62.42 $61.72 (4H chart)
GER40
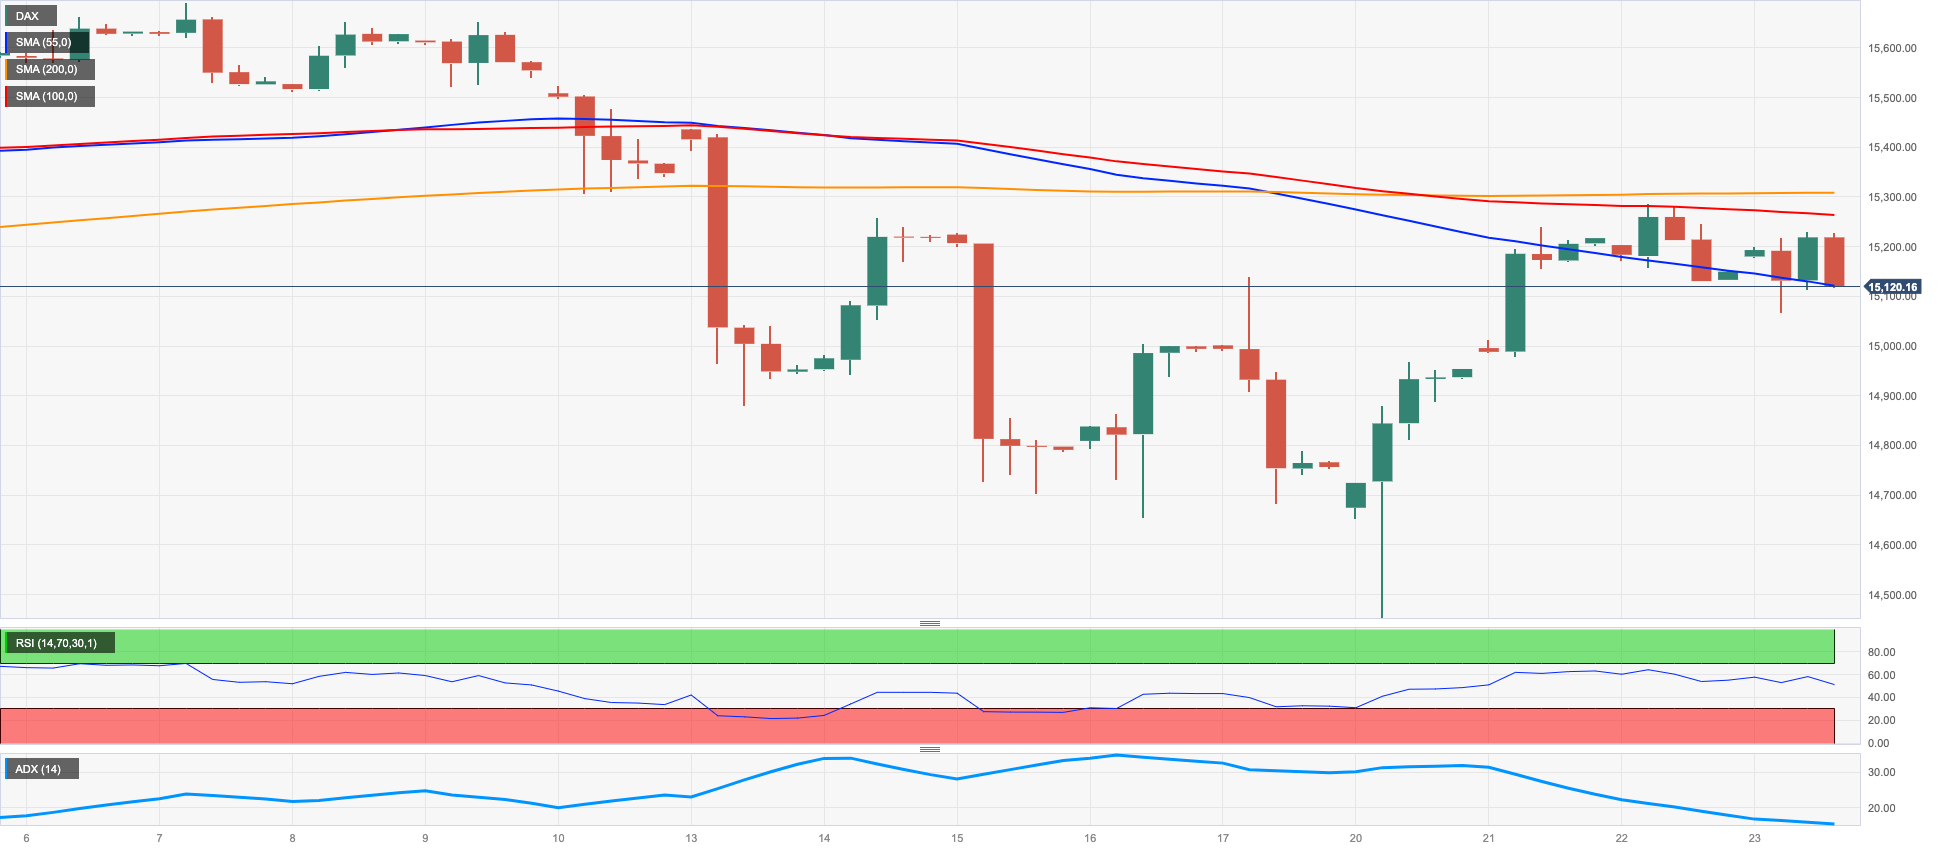
The German stocks reference DAX40 ended the session around Wednesday’s closing levels near 15200 on Thursday, down slightly for the day and in line with most of its European peers, except for the French CAC40, which managed to advance marginally.
Once again, investors’ concerns around the banking sector weighed on sentiment and kept the price action depressed on Thursday.
In addition, the persistent elevated inflation in the UK and Thursday’s rate hike by the BoE also kept speculation around further tightening in the old continent well in place, while some ECB rate setters also favoured the continuation of the hiking cycle.
In addition, the small downtick in the DAX40 came in line with the drop to 2-day lows in the sub-2.20% region in the German 10-year Bund yields.
Further north for the DAX40 comes the weekly high at 15298 (March 22) ahead of the 2023 top at 15706 (March 6) and the February 2022 peak at 15736 (February 2 2022). The breakout of the latter could motivate the index to challenge the round level at 16000 before the 2022 high at 16285 (January 5). In opposition, bears should meet a temporary and initial support at the 100-day SMA at 14756 ahead of the March low at 14458 (March 20) and the key 200-day SMA at 13868. The loss of this region could prompt a visit to the December 2022 low at 13791 (December 13) to start shaping up. The daily RSI kept hovering around the 50 zone.
Best Performers: Zalando SE, Infineon, Siemens Energy AG
Worst Performers: Commerzbank, Deutsche Bank AG, Covestro
Resistance levels: 15298 15495 15706 (4H chart)
Support levels: 15030 14458 13791 (4H chart)
NASDAQ
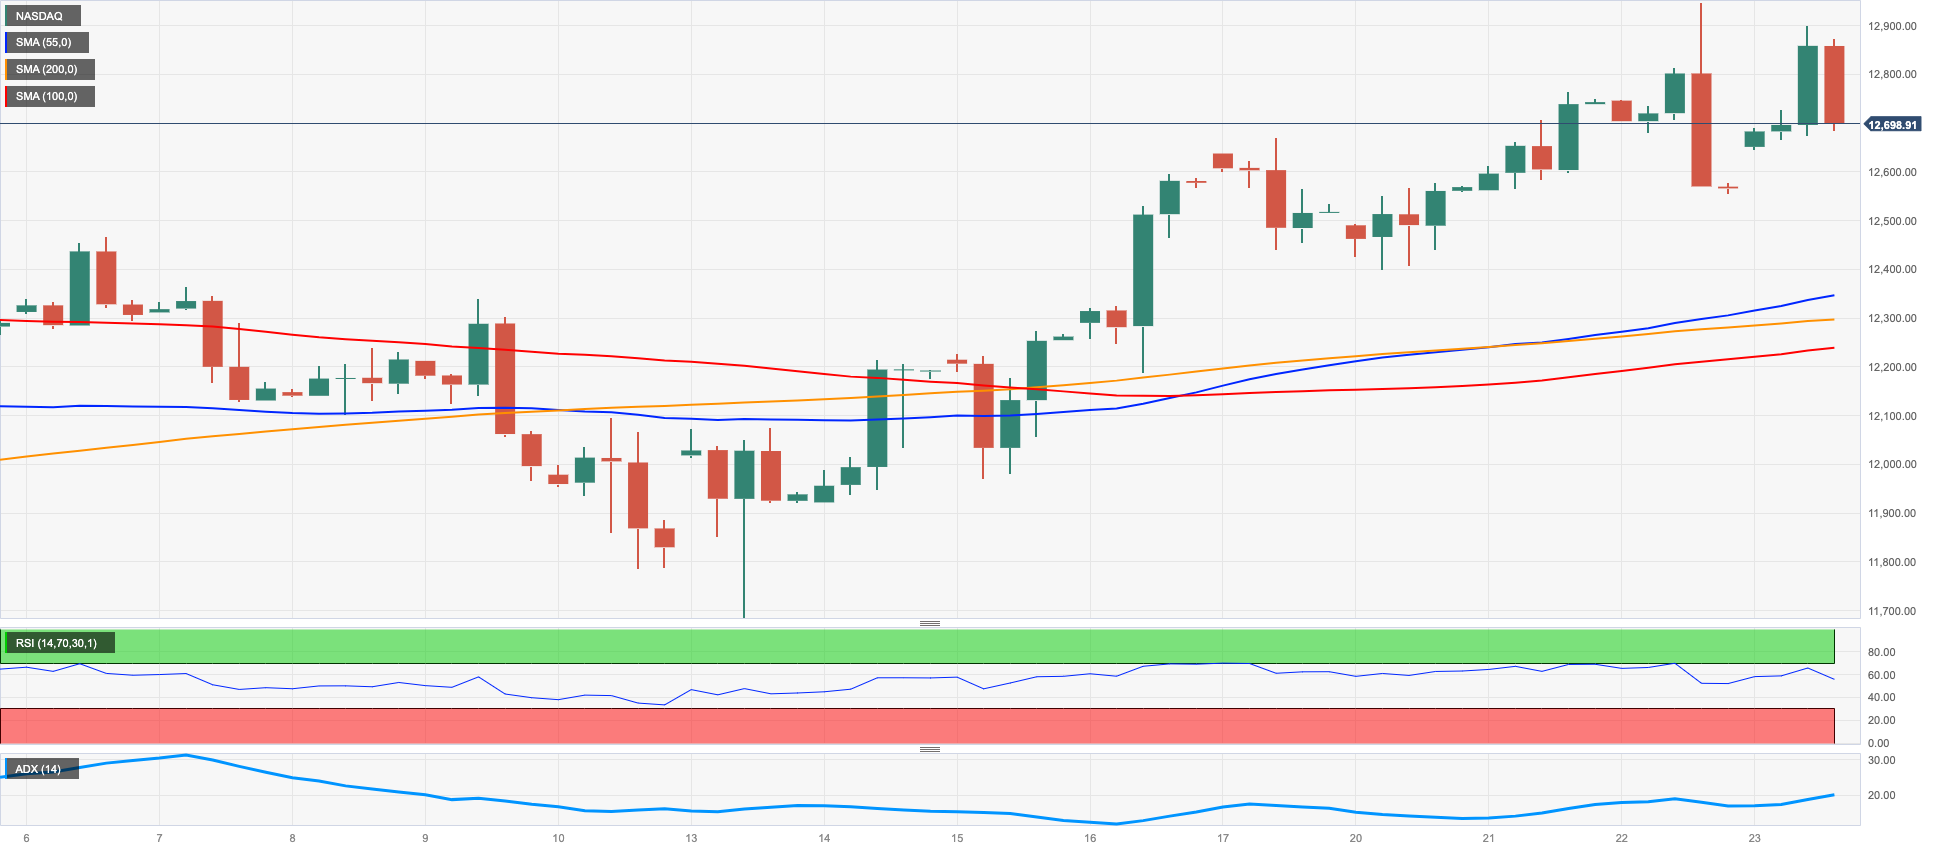
Hopes of an impasse in the Fed’s tightening process in combination with the bearish tone in US yields lent legs to the rate-sensitive tech sector and motivated the benchmark Nasdaq 100 to advance markedly on Thursday, quickly forgetting about Wednesday’s negative price action.
In addition, the firm performance of megacaps Amazon, Apple, Microsoft and Nvidia sustained the renewed and strong optimism among traders.
The immediate hurdle for bulls emerges at the 2023 high at 12943 (March 22). Once the Nasdaq 100 clears this level, it could embark on a potential move to the round level at 13000 before the weekly top at 13175 (August 26 2022). On the flip side, there is an interim contention at the 55-day SMA at 12055 seconded by the key 200-day SMA at 11904, which is closely followed by the March low at 11695 (March 13). South from here lines up weekly lows at 11550 (January 25) and 11251 (January 19) seconded by the 2023 low at 10696 (January 6) and the December 2022 low at 10671 (December 22). The daily RSI edged higher past the 62 yardstick.
Top Gainers: Netflix, Marvell, Regeneron Pharma
Top Losers: Sirius XM, PayPal Holdings Inc, Marriott Int
Resistance levels: 12943 13175 13720 (4H chart)
Support levels: 12407 12026 11695 (4H chart)
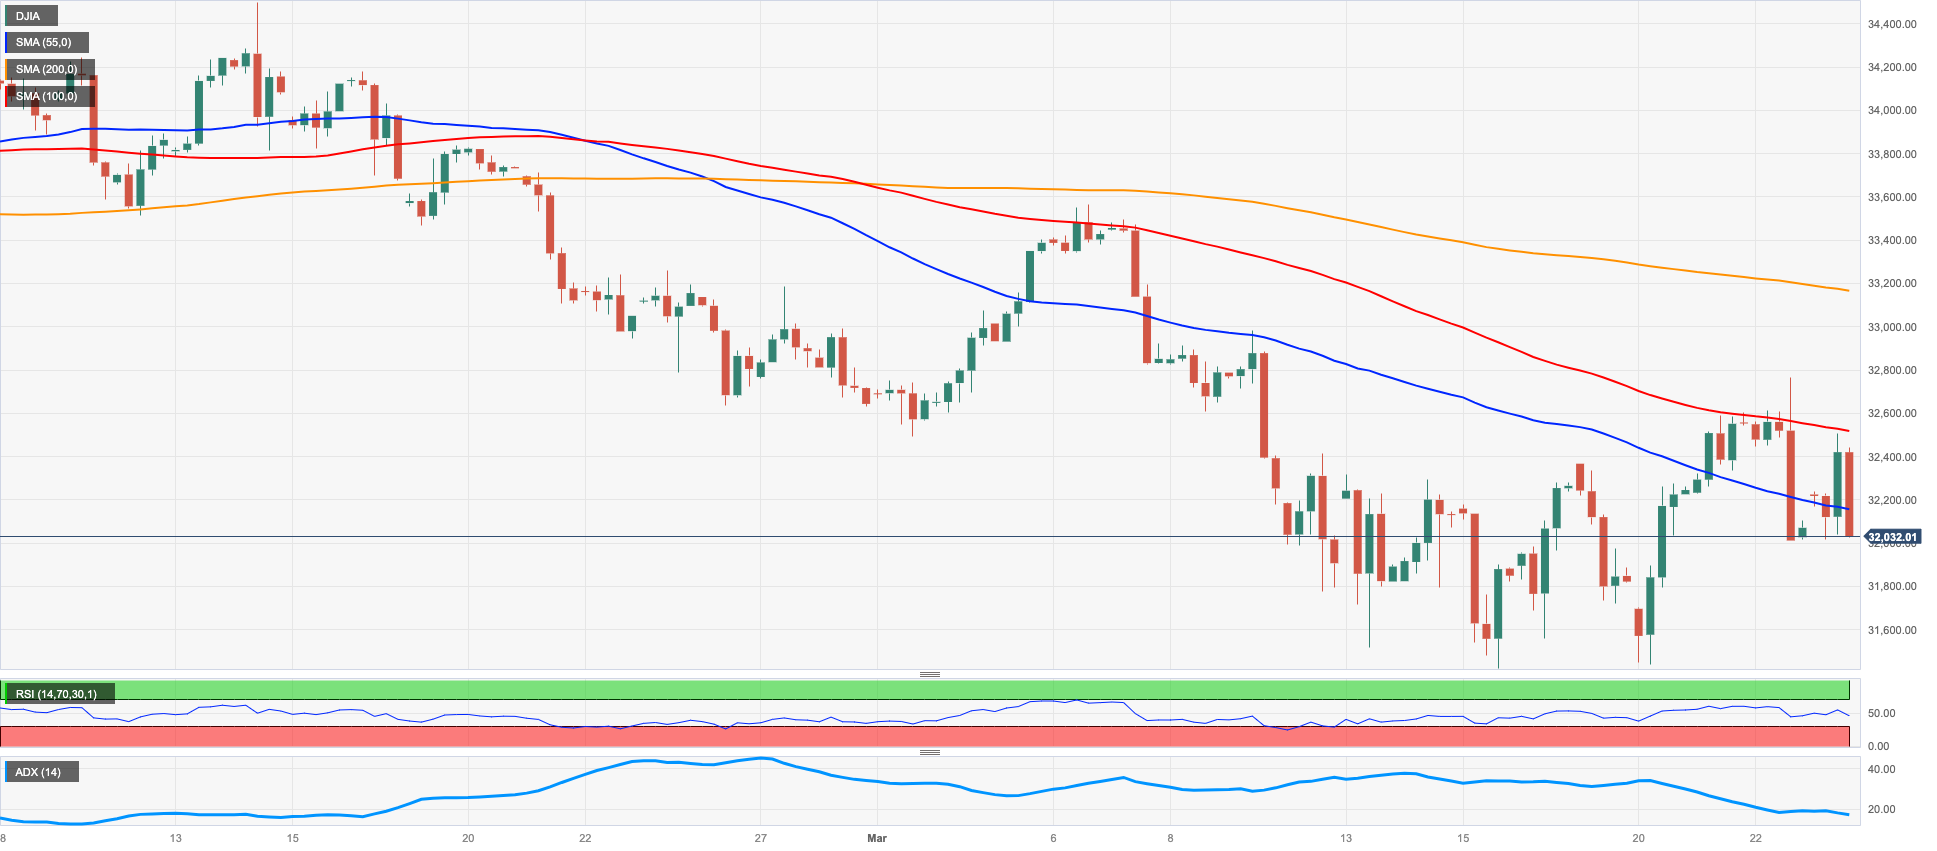
DOW JONES
All three major US stock indices quickly left behind Wednesday’s decline and charted decent gains on Thursday.
In fact, the dovish hike from the Fed on Wednesday reignited speculation that a pause in the bank’s hiking cycle now appears closer and this, coupled with the intense selling pressure in the dollar and the mixed tone in US yields, encouraged investors to see the “glass half full” and shifted their interest to the risk-associated universe.
Against that, the Dow Jones rose 0.46% to 32176, the S&P500 advanced 0.63% to 3962 and the tech-heavy Nasdaq Composite climbed 1.32% to 11820.
The Dow Jones clocked a new weekly high at 32511 (March 23). A break above this level exposes a move to the March top at 33572 (March 6) prior to the 2023 peak at 34342 (January 13) and the December 2022 high at 34712 (December 13), while the surpass of the latter should open the door to the April 2022 top at 35492 (April 21). Having said that, a drop below the 2023 low at 31429 (March 15) could put a test of the key 30000 mark back to the traders’ radar ahead of the 2022 low at 28660 (October 13). The daily RSI gathered pace and approached 44.
Top Performers: Microsoft, Intel, Walt Disney
Worst Performers: Travelers, Merck&Co, UnitedHealth
Resistance levels: 32761 32990 33318 (4H chart)
Support levels: 31429 28660 26143 (4H chart)
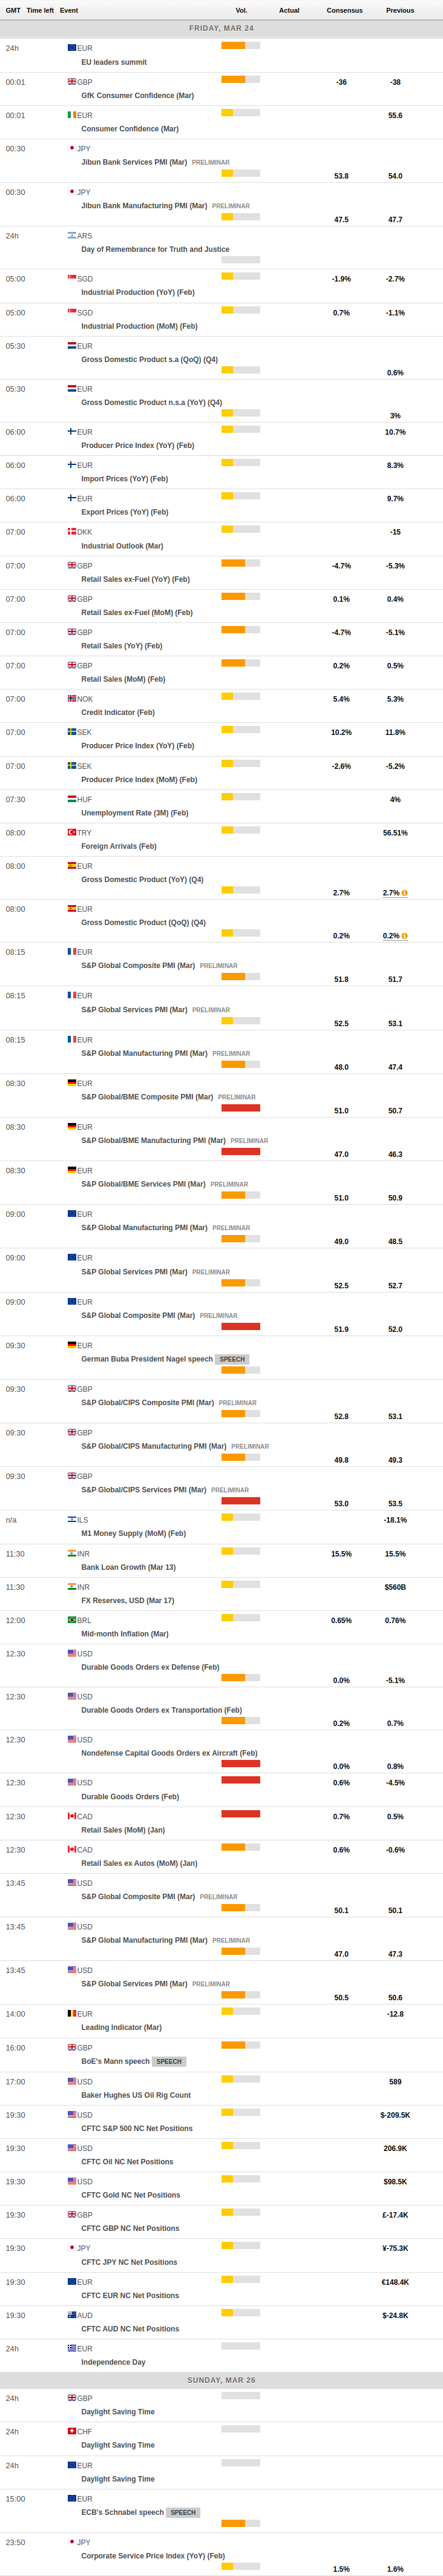
MACROECONOMIC EVENTS
All Information & Updates provided by:

All information relating to the financial markets available on this page has been prepared and issued by FXStreet (Forexstreet SL, Spain, Reg: B62498233) on the basis of publicly available information and all information believed to be reliable and does not conflict with Kuwaiti local laws, and all necessary care has been taken to before the company to ensure that the facts mentioned are correct from the source.
NCM Investment nor any of its directors or employees shall in any way be held responsible for the contents of this news, and the information contained on this page is intended only to provide clients with publicly available information and should not be construed as investment advice, report or analysis and/or constitute an offer or invitation to buy or sell financial instruments of any kind.
RISK WARNING: Forex and CFDs are highly risky leveraged products, as losses can exceed deposits. Please ensure you understand all the risks and take independent advice if necessary. NCM will segregate the clients based on the criteria of the regulator and its bylaws. NCM does not provide any advisory service; the material published does not constitute advice or a recommendation for a transaction in any financial instrument. NCM accepts no responsibility for any use of the content presented and any consequences of that use. Anyone acting on the information provided does so at their own risk.