
- Contact Us:
-

-

-

-


Daily Market Updates
27 Mar 2023
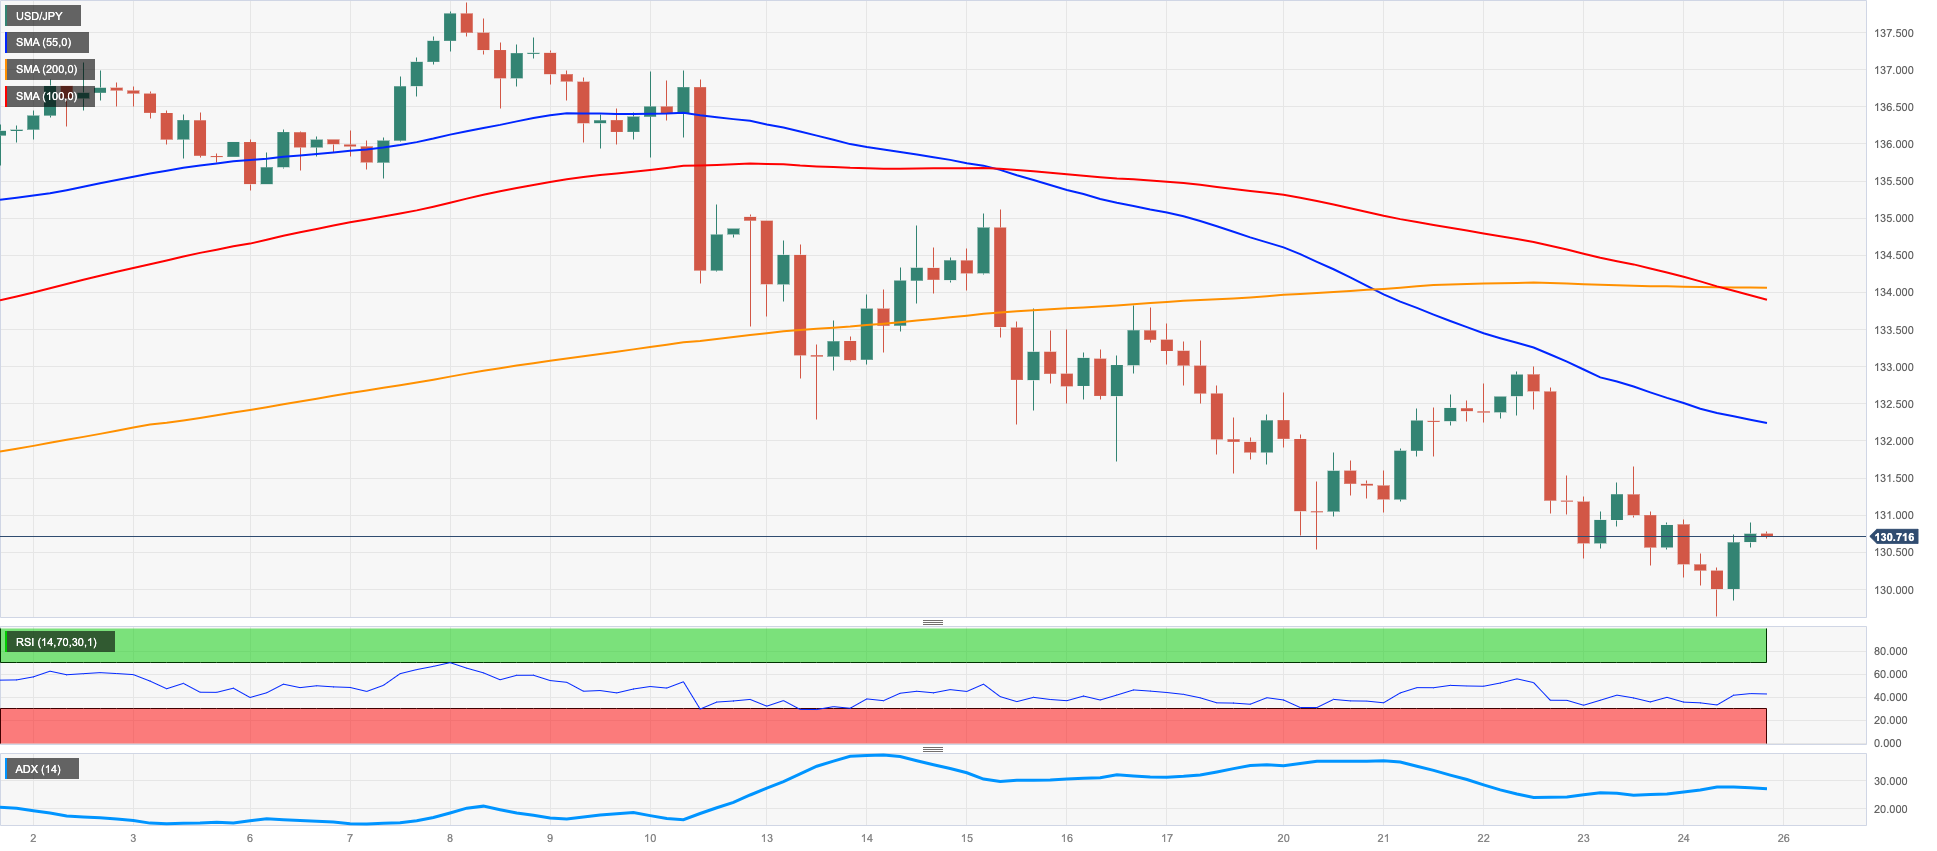
USDJPY
After bottoming out in fresh 7-week lows near 129.60, USD/JPY managed to regain some balance and end the session around Thursday’s closing levels near 130.70 at the end of the week.
The third consecutive daily drop in the pair was in response to persevering banking jitters, which bolstered the demand for the Japanese safe haven JPY, while another negative session in US yields across the curve collaborated with the decline in spot.
In the Japanese bond market, the key JGB 10-year yields added to the negative performance seen in the second half of the week, this time revisiting the 0.25% region.
Busy calendar in Japan saw Foreign Bond Investment rise ¥3334.8B in the week to March 18. In addition, the flash Manufacturing PMI is seen at 48.6 in March and the Services PMI at 54.2. Furthermore, the Inflation Rate rose 3.3% in the year to February, Core Inflation Rate gained 3.1% YoY and Inflation Rate Ex-Food and Energy increased 3.5% from a year earlier.
Further decline could force USD/JPY to revisit the March low at 129.63 (March 24) before the February low at 128.08 (February 2) and the 2023 low at 127.21 (January 16). On the contrary, the temporary 55-day SMA at 132.41 comes first seconded by the weekly high at 133.00 (March 22). The breakout of this level could open the door to the interim 100-day SMA at 134.43 ahead of the more significant 200-day SMA at 137.39 and the 2023 peak at 137.91 (March 8). The daily RSI slipped back to the proximity of 37.
Resistance levels: 131.66 133.82 133.97 (4H chart)
Support levels: 129.63 128.08 127.21 (4H chart)
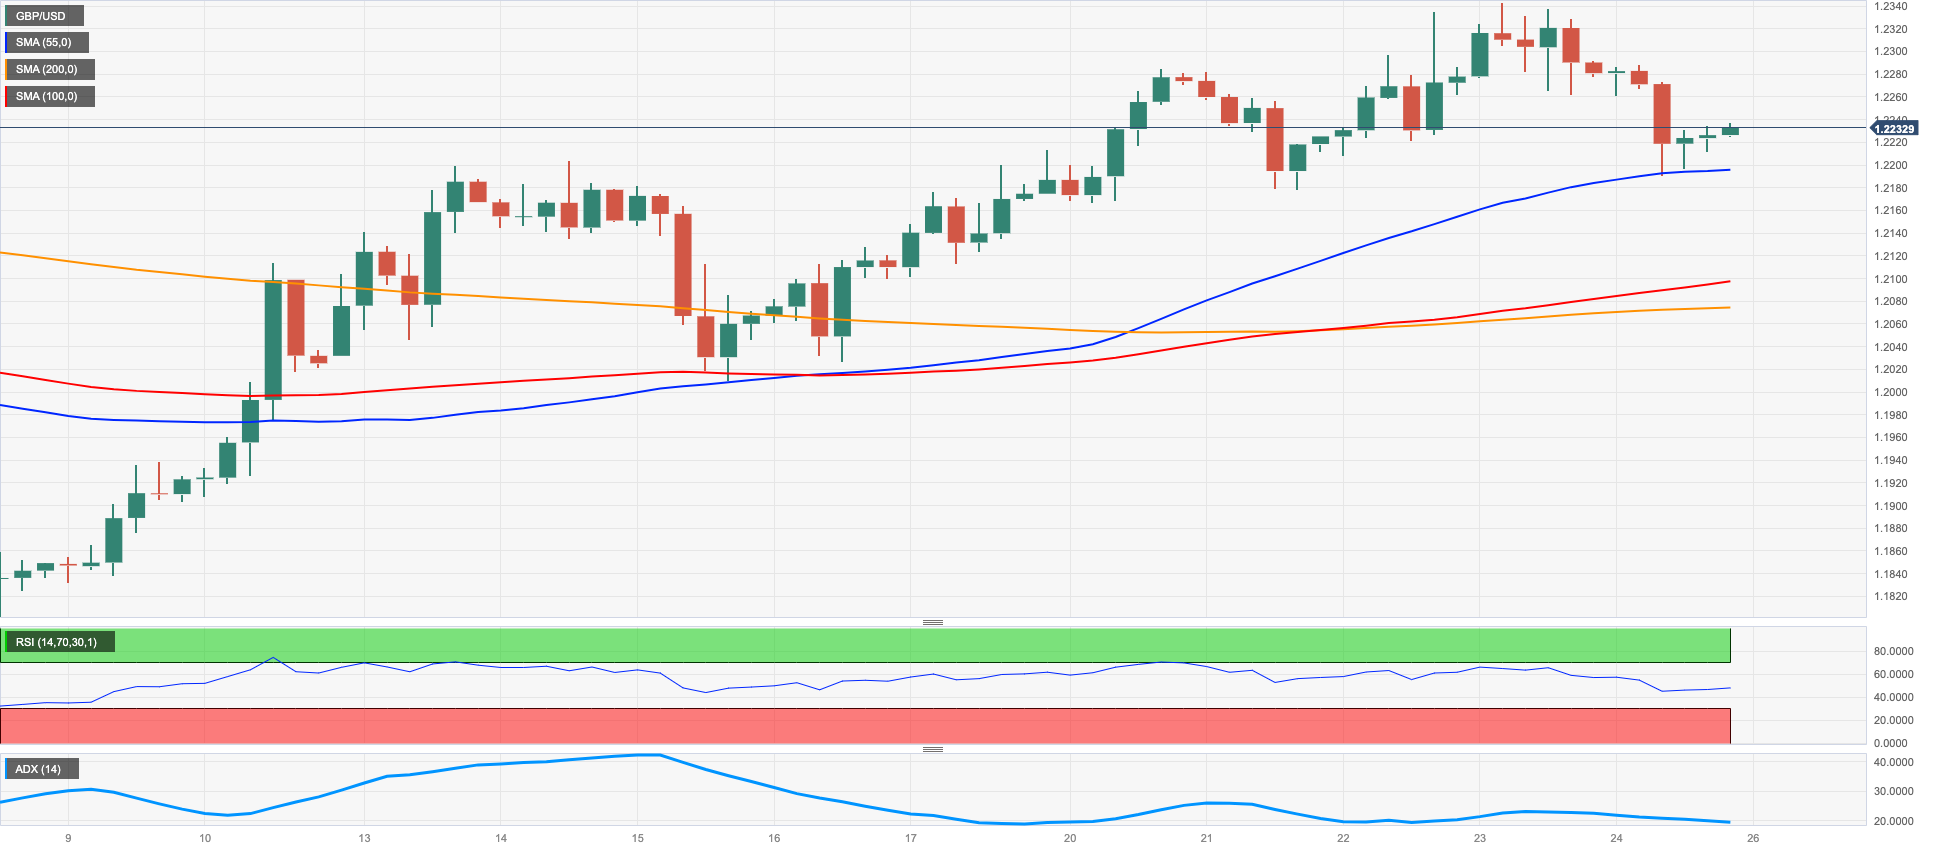
GBPUSD
GBP/USD set aside two daily sessions with gains and briefly deflated to 3-day lows near 1.2190, just to rebound afterwards, on Friday.
The sharp recovery in the greenback helped the USD Index (DXY) partially recoup recent intense losses and flirt with the 55-day SMA near 103.40 despite the persevering downtrend in US yields across the curve.
From the BoE, Governor A.Bailey kind of warned that rates could increase further if firms continue to raise prices. He also suggested that the UK economy could avert a recession this year. His (hawk) colleague, MPC member C.Mann noted the importance of Brexit for food price inflation in the UK and she justified her decision to raise rates by 25 bps this week in the perception that inflation expectations seem to have started to moderate. She added that the decision on rates is based on financial conditions and hinted at the idea that there is more to come (rates wise) before tight conditions in the UK.
In the UK data space, Consumer Confidence tracked by Gfk ticked slightly higher to -36 in March, while Retail Sales expanded at a monthly 1.2% in February and contracted 3.5% over the last twelve months. Finally, advanced figures expected the Manufacturing PMI at 48.0 in March (from 49.3) and the Services PMI at 52.8 (from 53.5).
The continuation of the upside momentum in GBP/USD should clear the March peak at 1.2343 (March 23) to allow for a potential visit to the 2023 high at 1.2447 (January 23) and the May 2022 top at 1.2666 (May 27). North from here comes the 200-week SMA at 1.2871prior to the psychological 1.3000 mark. Just the opposite, the 55- and 100-day SMAs at 1.2149 and 1.2090 are expected to offer provisional contention, respectively, ahead of the weekly low at 1.2010 (March 15) and the key 200-day SMA at 1.1891. The loss of the latter exposes the 2023 low at 1.1802 (March 8) seconded by the November 2022 low at 1.1142 (November 4). The daily RSI came under pressure and poked with 56.
Resistance levels: 1.2343 1.2401 1.2447 (4H chart)
Support levels: 1.2189 1.2074 1.2010 (4H chart)
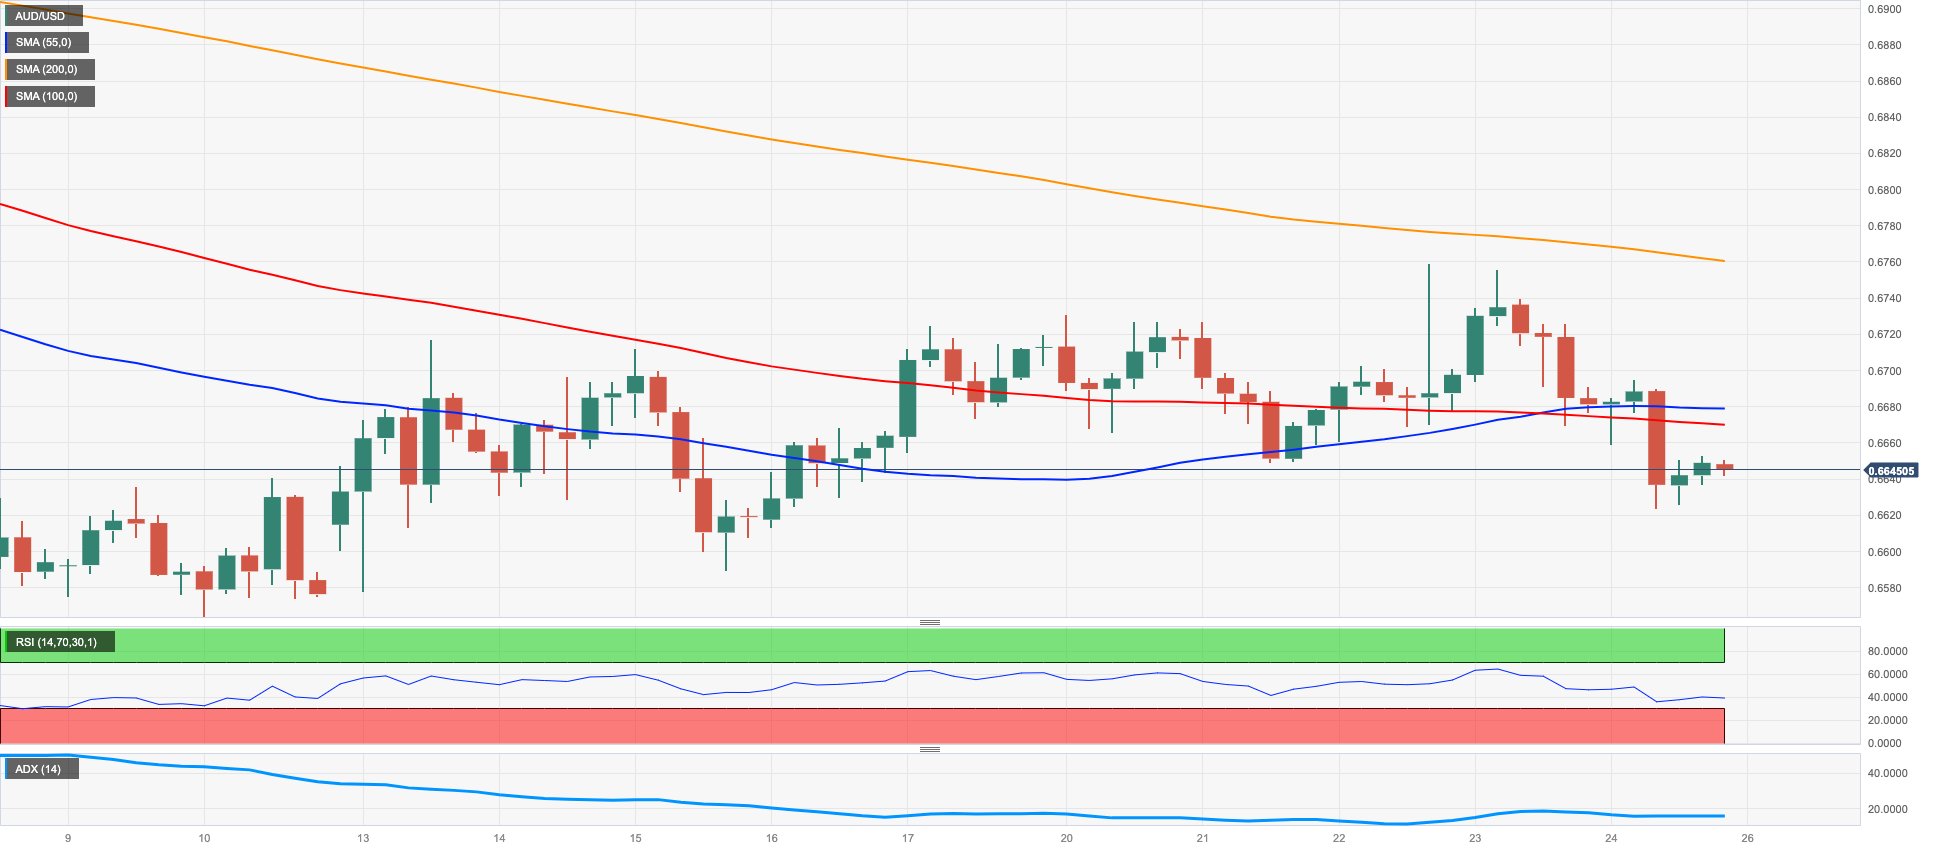
AUDUSD
In line with the rest of the risk-linked galaxy, AUD/USD added to Thursday’s retracement and clocked new weekly lows near 0.6620 before regaining some composure towards end of Friday’s session.
The intense recovery in the dollar, banking concerns and the generalized bearish activity in the commodity universe all weighed on the Aussie dollar and kept the pair’s price action well depressed at the end of the week.
Meanwhile, in Oz, preliminary Judo Bank Manufacturing PMI is seen receding to 48.7 in March (from 50.5) and the Judo Bank Services PMI is expected at 48.2 (from 50.7).
Below the weekly low at 0.6625 (March 24), AUD/USD should meet the next support of note at the 2023 low at 0.6563 (March 10) prior to the weekly low at 0.6386 (November 10 2022) and the November 2022 low at 0.6272 (November 3). The other way around, the immediate hurdle emerges at the weekly high at 0.6758 (March 22), which remains bolstered by the key 200-day SMA (0.6756). The surpass of this region could put a test of the March top at 0.6783 (March 1) back on the investors’ radar just before the interim 100-day SMA at 0.6791 and the temporary 55-day SMA at 0.6851. Further north appears the key round level at 0.7000 prior to the weekly peak at 0.7029 (February 14). The daily RSI lost traction and dropped below the 42 mark.
Resistance levels: 0.6758 0.6783 0.6920 (4H chart)
Support levels: 0.6625 0.6589 0.6563 (4H chart)
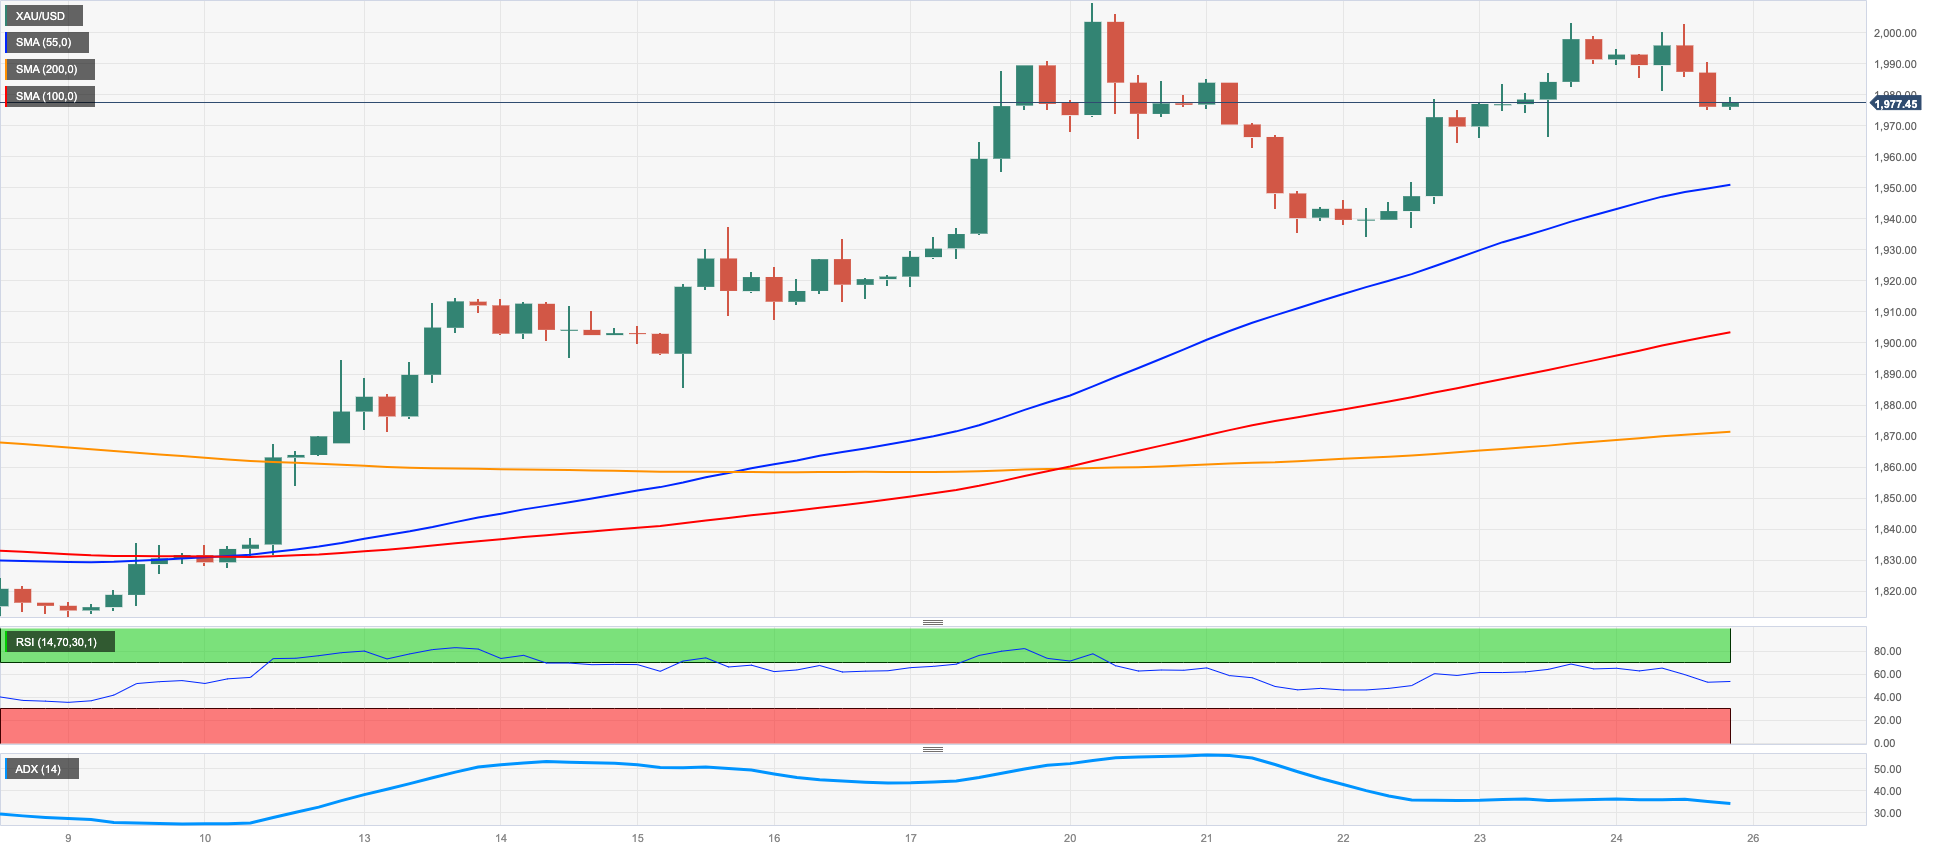
GOLD
Prices of the ounce troy of the yellow metal retreated to the sub-$1980 region after two consecutive daily advances on Friday. That said, bullion halted three consecutive weekly gains despite climbing past the key $2000 mark earlier in past sessions.
The corrective decline in the precious metal came exclusively on the back of the marked rebound in the greenback, which prompted the USD Index (DXY) to extend the positive performance in the second half of the week.
Somewhat limiting the downside in the metal appeared the firm demand for the safe haven universe on the back of rising banking concerns and the relentless downward bias in US yields across the curve.
Gold bulls remain focused on the 2023 high at $2009 for the time being. The breakout of this level exposes the 2022 top at $2070 (March 8) seconded by the all-time peak at $2075 (August 7 2020). On the opposite side, the weekly low at $1934 (March 22) should hold the initial test prior to the provisional 55- and 100-day SMAs at $1887 and $1837, respectively, ahead of the March low at $1809 (March 8) and the 2023 low at $1804 (February 28), all preceding the key 200-day SMA at $1780.
Resistance levels: $2009 $2070 $2075 (4H chart)
Support levels: $1948 $1934 $1885 (4H chart)
CRUDE WTI
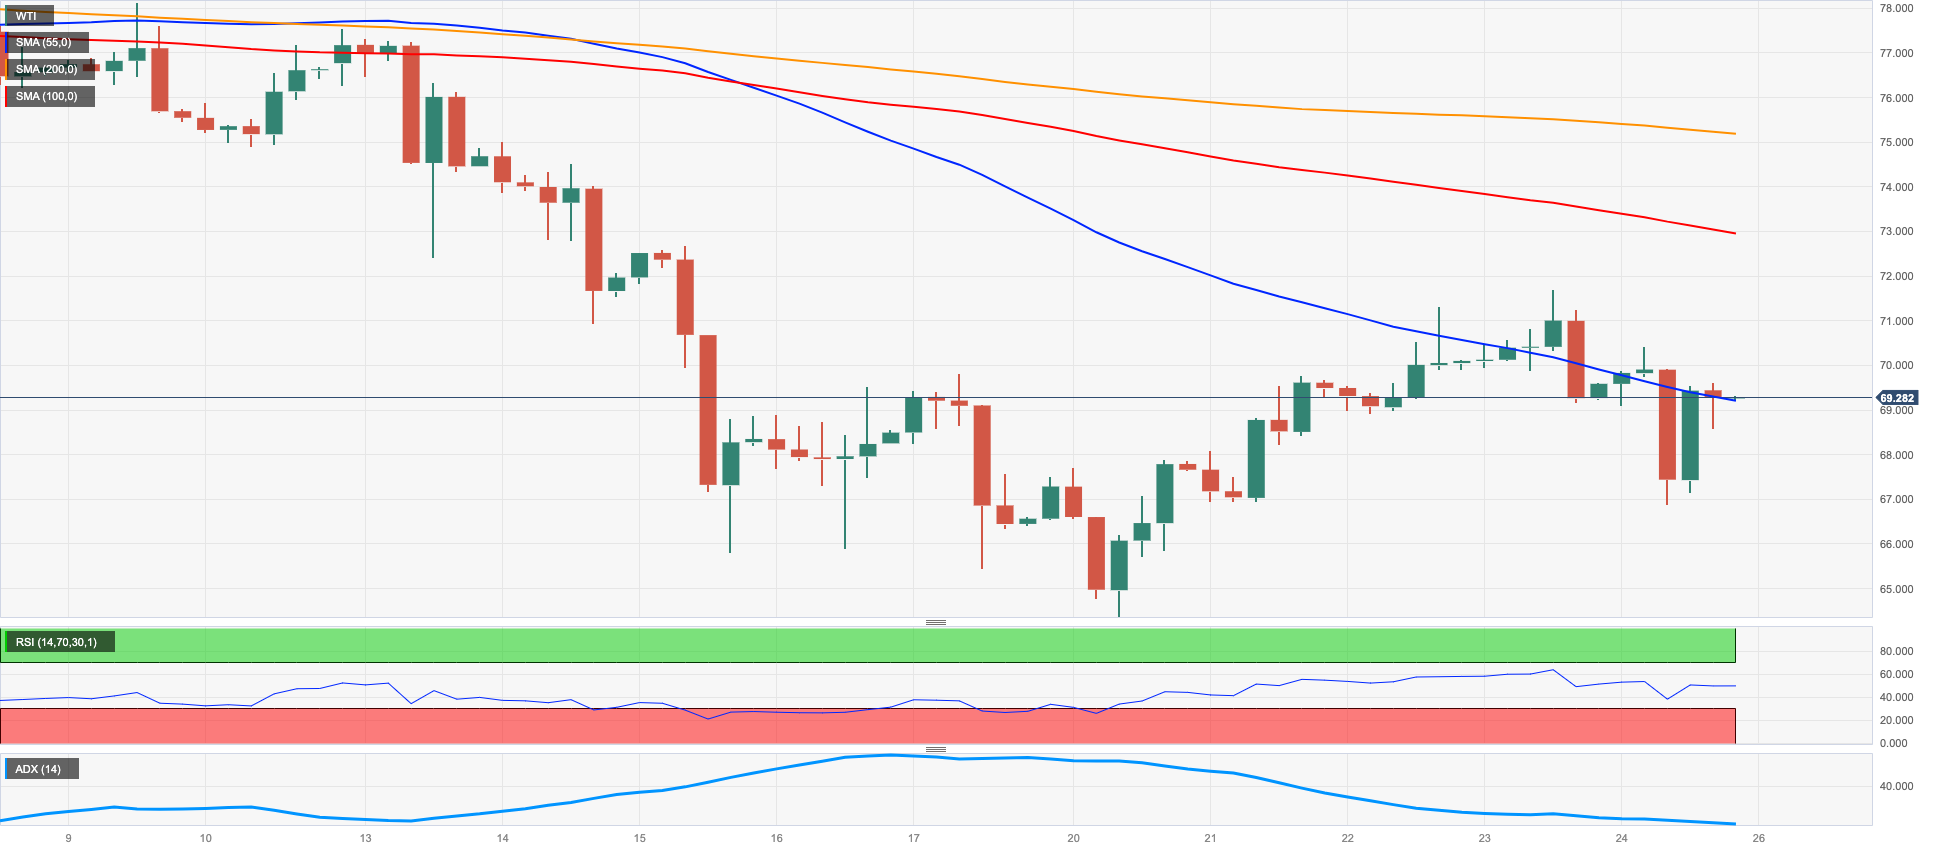
Prices of the West Texas Intermediate (WTI) deflated for the second day in a row and ended Friday’s session just above the $69.00 mark per barrel.
Despite the decline seen in the second half of the week, the commodity managed to reverse to weekly losses after bottoming out at 16-month lows near the $64.00 mark on March 20.
This time, the persistence of banking concerns – mainly in Europe – encouraged sellers to return to the market, while the sharp rebound in the greenback also collaborated with the negative day in crude oil prices.
Another driver intensifying the bearish mood around crude oil came from news that the US government might take several years to restock its SPR.
In the docket, driller Baker Hughes said in its weekly report that US oil rig count increased by 4 in the week to March 24 to a total US active oil rigs of 593.
If sellers regain control of the sentiment, prices of the WTI could revisit the 2023 low at $64.41 (March 20), which if cleared it could allow for a deeper pullback to the December 2021 low at $62.46 (December 2) ahead of the August 2021 low at $61.76 (August 23) and the key $60.00 mark per barrel. By contrast, the weekly peak at $71.63 (March 23) emerges as the next resistance level seconded by temporary hurdles at the 55- and 100-day SMAs at $76.34 and $77.78, respectively, prior to the March high at $80.90 (March 7) and the 2023 top at $82.60 (January 23).
Resistance levels: $71.63 $72.51 $75.13 (4H chart)
Support levels: $66.79 $64.41 $62.42 (4H chart)
GER40
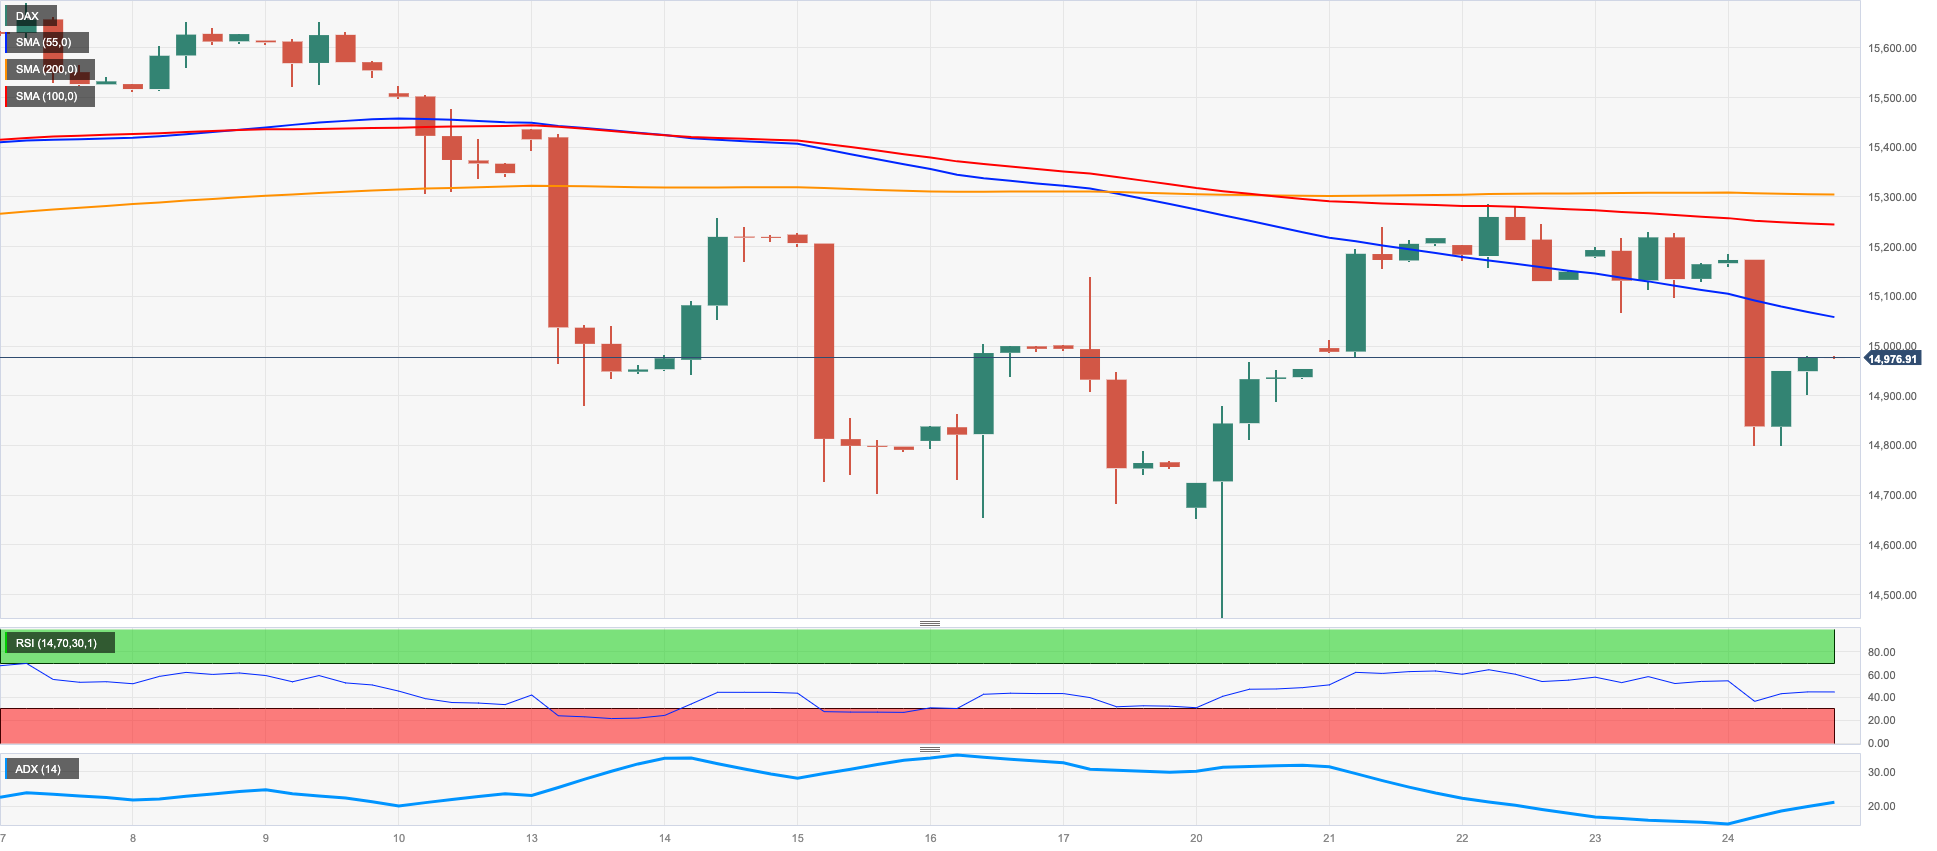
European stock indices closed in a “sea of red” at the end of the week, as banking concerns continued to hurt the sentiment among market participants. The German benchmark DAX40 added to Thursday’s losses and deflated to multi-day lows near the 14800 zone before regaining some composure.
In Germany, shares of the top lender Deutsche Bank retreated to levels last seen back in mid-October 2022 in the sub-€8.00 region, although it trimmed part of that steep pullback in response to positive comments from ECB’s Lagarde and German officials.
The German money market showed a firmer demand for bonds amidst the prevailing risk aversion, which eventually morphed into further weakness in the 10-year Bund yields.
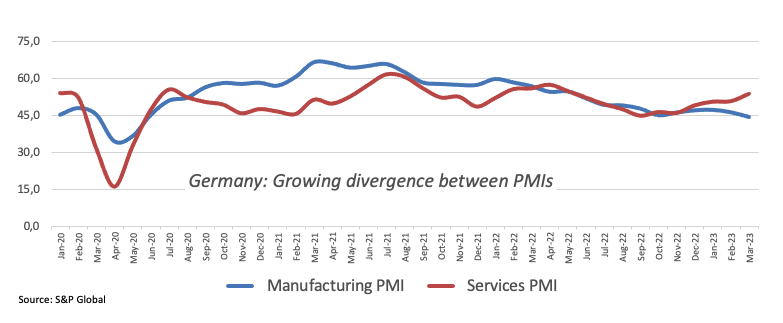
In the calendar, advanced Manufacturing PMI for the month of March is seen dropping to 44.4 (from 46.3), while the Services PMI is expected to have improved to 53.9 (from 50.9).
The occasional recovery in the DAX40 should target the weekly top at 15298 (March 22) ahead of the 2023 peak at 15706 (March 6) and the February 2022 high at 15736 (February 2 2022). North from here emerges the round level at 16000 seconded by the 2022 top at 16285 (January 5). Having said that, there is a provisional contention at the 100-day SMA at 14774 prior to the March low at 14458 (March 20) and the key 200-day SMA at 13877. A drop below the latter exposes a potential test of the December 2022 low at 13791 (December 13). The daily RSI grinded lower to the 44 area.
Best Performers: Merck, Hannover Rueck SE, Rheinmetall AG
Worst Performers: Deutsche Bank AG, Commerzbank, Infineon
Resistance levels: 15045 15298 15495 (4H chart)
Support levels: 14809 14458 13791 (4H chart)
NASDAQ
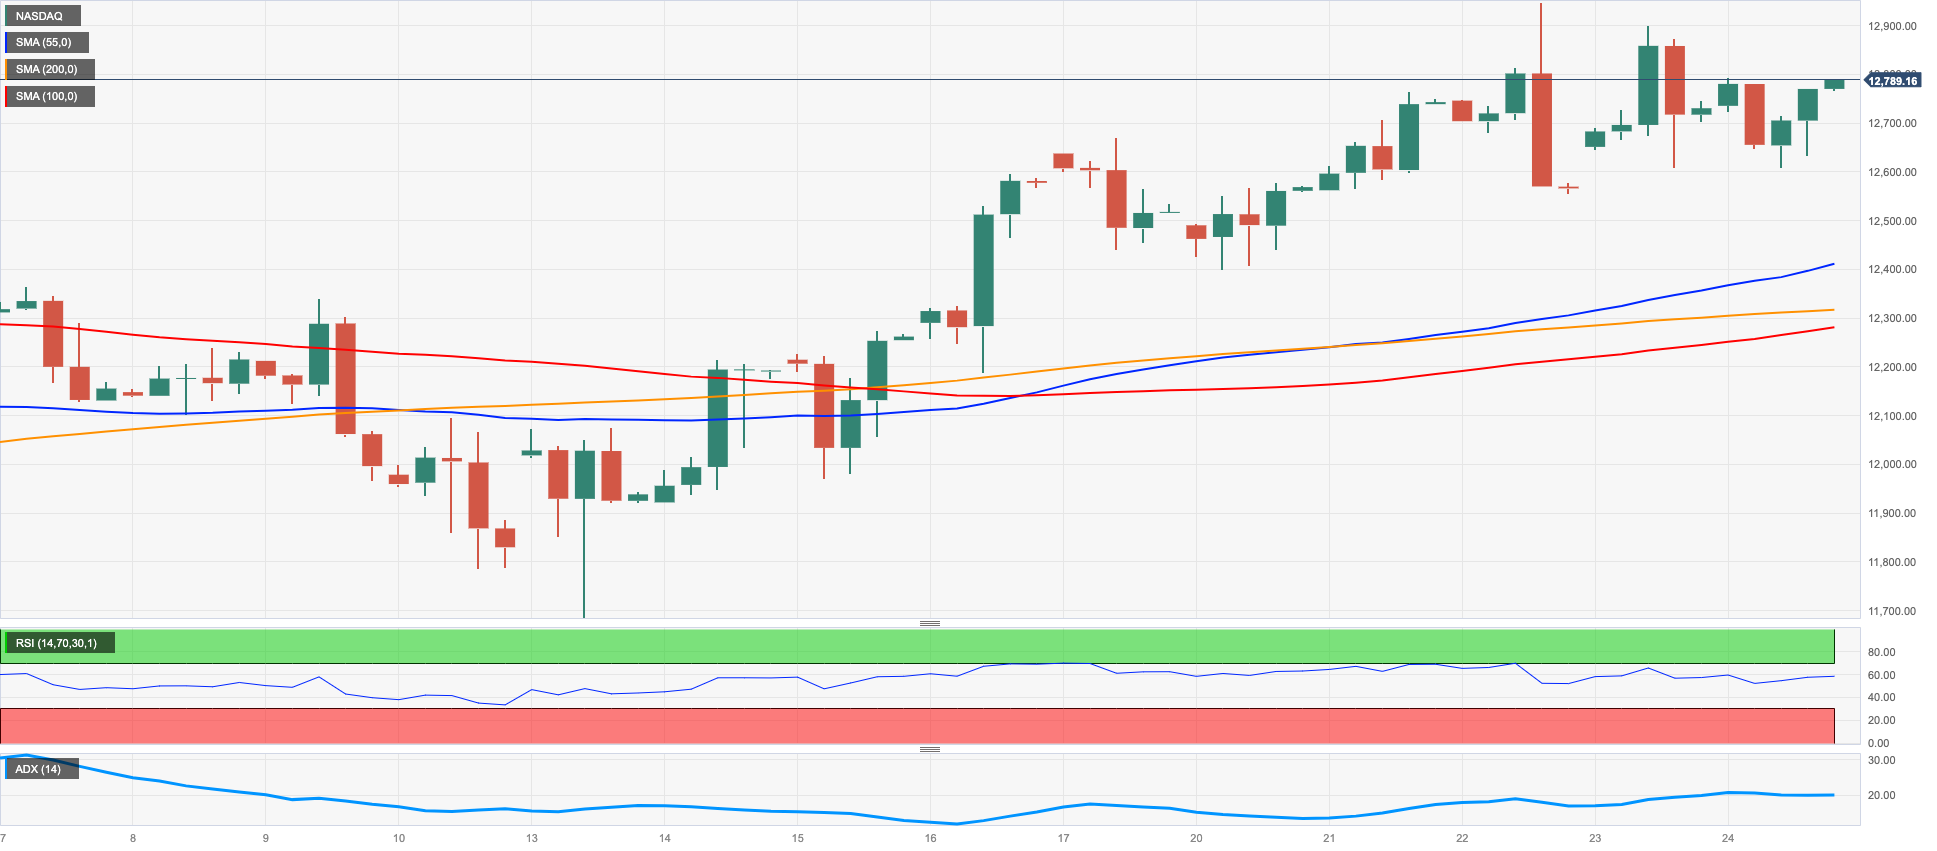
The tech reference Nasdaq 100 followed the rest of its US peers and printed decent gains at the end of the week.
The uptick in the index came in response to the late bounce in banking shares despite persistent jitters around the European banking sector, while the solid session of megacaps Meta Platforms, Microsoft and Activision Blizzard (among others) helped with the upbeat mood.
The 2023 top at 12943 (March 22) remains the initial up-barrier for bulls in the Nasdaq 100. If the index leaves this level behind, it could then accelerate gains to the round level at 13000 ahead of the weekly peak at 13175 (August 26 2022). In opposition, the 55-day SMA at 12087 is expected to offer some initial and temporary support prior to the key 200-day SMA at 11904 and the March low at 11695 (March 13). The breach of the latter could put a test of weekly lows at 11550 (January 25) and 11251 (January 19) back on the traders’ radar ahead of the 2023 low at 10696 (January 6) and the December 2022 low at 10671 (December 22). The daily RSI picked up pace and trespassed the 62 level.
Top Gainers: Activision Blizzard, Intuitive Surgical Inc, Sirius XM Holdings Inc
Top Losers: PDD Holdings Inc, Enphase, Lam Research Corp
Resistance levels: 12943 13175 13720 (4H chart)
Support levels: 12407 12026 11695 (4H chart)
DOW JONES
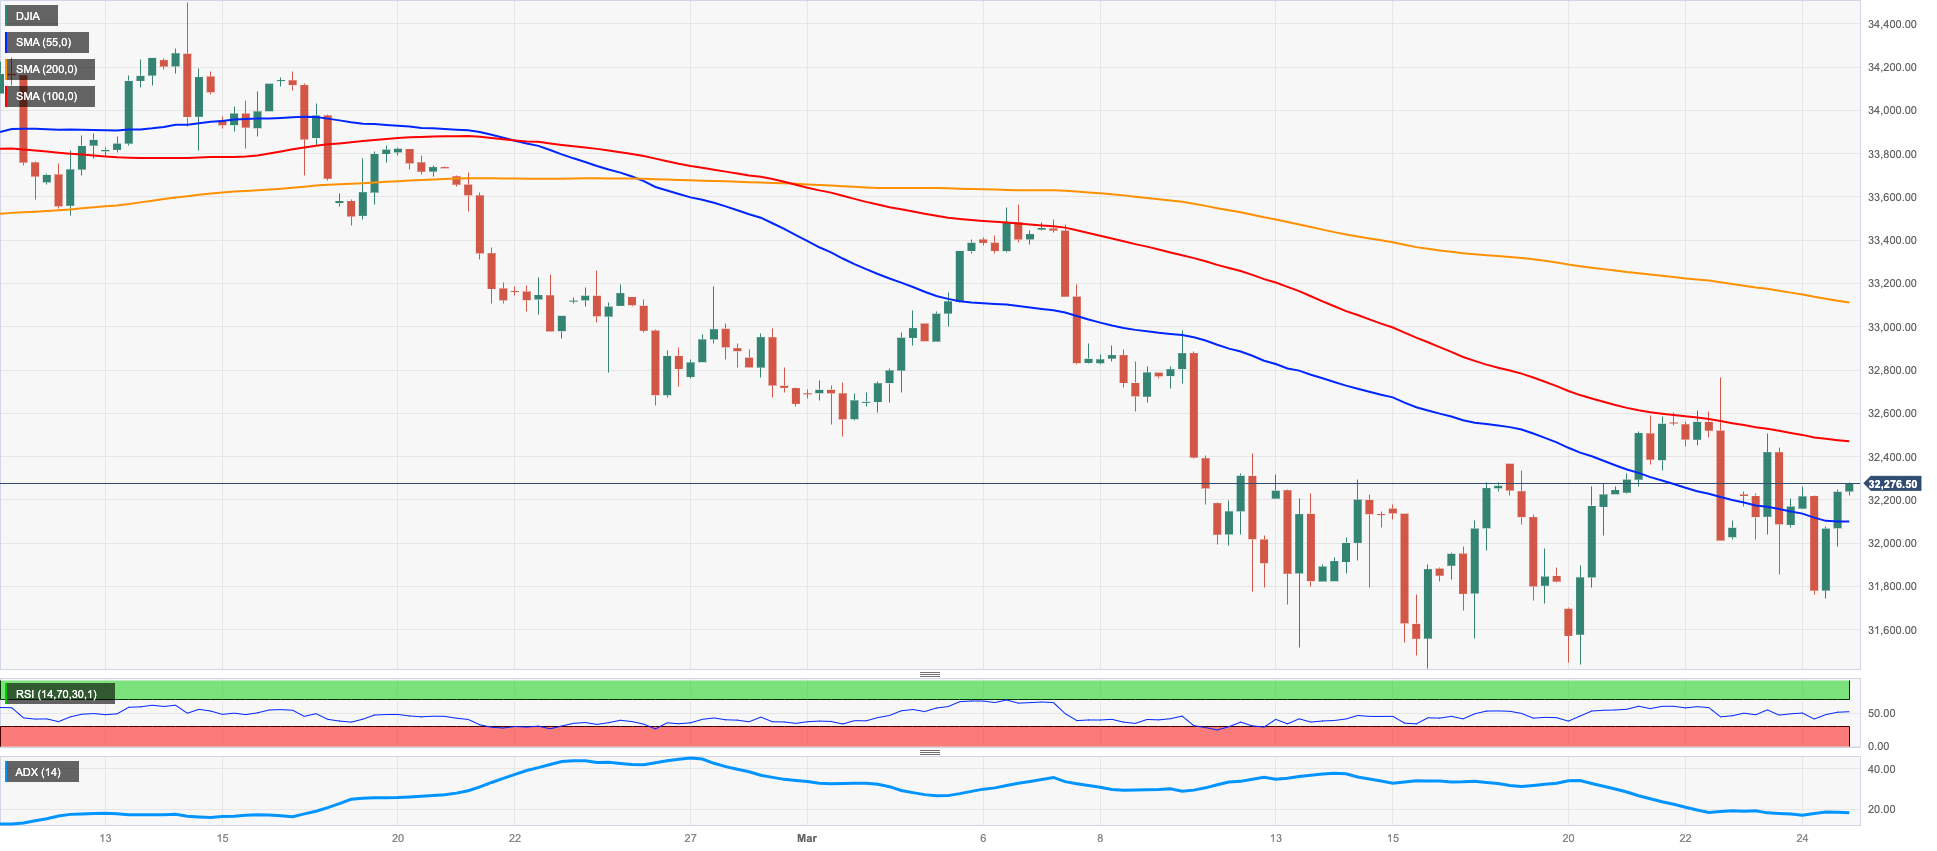
Equities tracked by the Dow Jones added to Thursday’s recovery and regained the 32200 region amidst decent gains. Looking at the weekly chart, the index resumed the upside following two declines in a row.
The late rebound in banks’ shares in combination with declining US yields appeared to have lent some oxygen to stocks and propped up the second daily uptick in the three major US stock indices.
All in all, the Dow Jones gained 0.41% to 32237, the S&P500 rose 0.56% to 3970 and the tech-reference Nasdaq Composite advanced 0.31% to 11823.
Immediately to the upside for the Dow Jones aligns the key 200-day SMA at 32358 closely followed by the weekly high at 32761 (March 23). The surpass of the latter could motivate the index to confront the March peak at 33572 (March 6) ahead of the 2023 high at 34342 (January 13) and the December 2022 top at 34712 (December 13). North from here comes the April 2022 peak at 35492 (April 21). On the other hand, a deeper pullback from the 2023 low at 31429 (March 15) could prompt a test of the 30000 mark to emerge on the horizon prior to the 2022 low at 28660 (October 13). The daily RSI advanced mildly to the area beyond 44.
Top Performers: Amgen, Procter&Gamble, Coca-Cola
Worst Performers: American Express, Walt Disney, JPMorgan
Resistance levels: 32761 32990 33315 (4H chart)
Support levels: 31429 28660 26143 (4H chart)
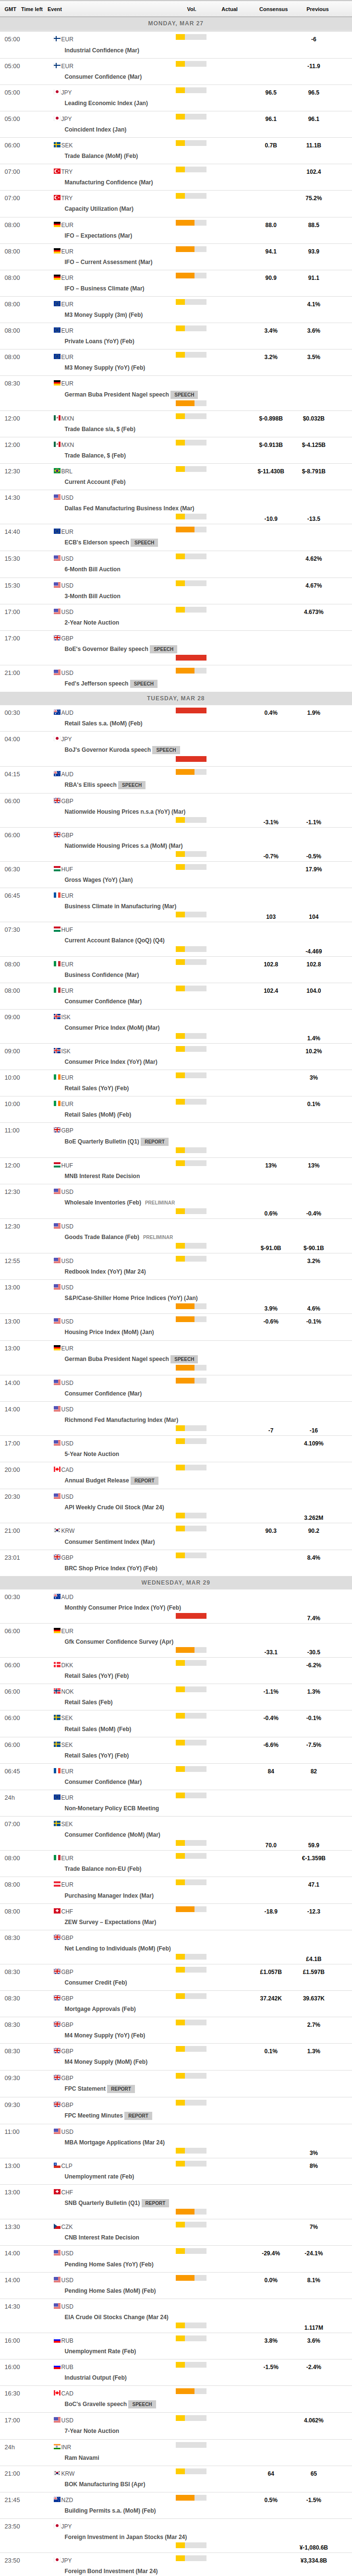
MACROECONOMIC EVENTS
All Information & Updates provided by:

All information relating to the financial markets available on this page has been prepared and issued by FXStreet (Forexstreet SL, Spain, Reg: B62498233) on the basis of publicly available information and all information believed to be reliable and does not conflict with Kuwaiti local laws, and all necessary care has been taken to before the company to ensure that the facts mentioned are correct from the source.
NCM Investment nor any of its directors or employees shall in any way be held responsible for the contents of this news, and the information contained on this page is intended only to provide clients with publicly available information and should not be construed as investment advice, report or analysis and/or constitute an offer or invitation to buy or sell financial instruments of any kind.
RISK WARNING: Forex and CFDs are highly risky leveraged products, as losses can exceed deposits. Please ensure you understand all the risks and take independent advice if necessary. NCM will segregate the clients based on the criteria of the regulator and its bylaws. NCM does not provide any advisory service; the material published does not constitute advice or a recommendation for a transaction in any financial instrument. NCM accepts no responsibility for any use of the content presented and any consequences of that use. Anyone acting on the information provided does so at their own risk.