
- Contact Us:
-

-

-

-


Daily Market Updates
28 Mar 2023
USDJPY
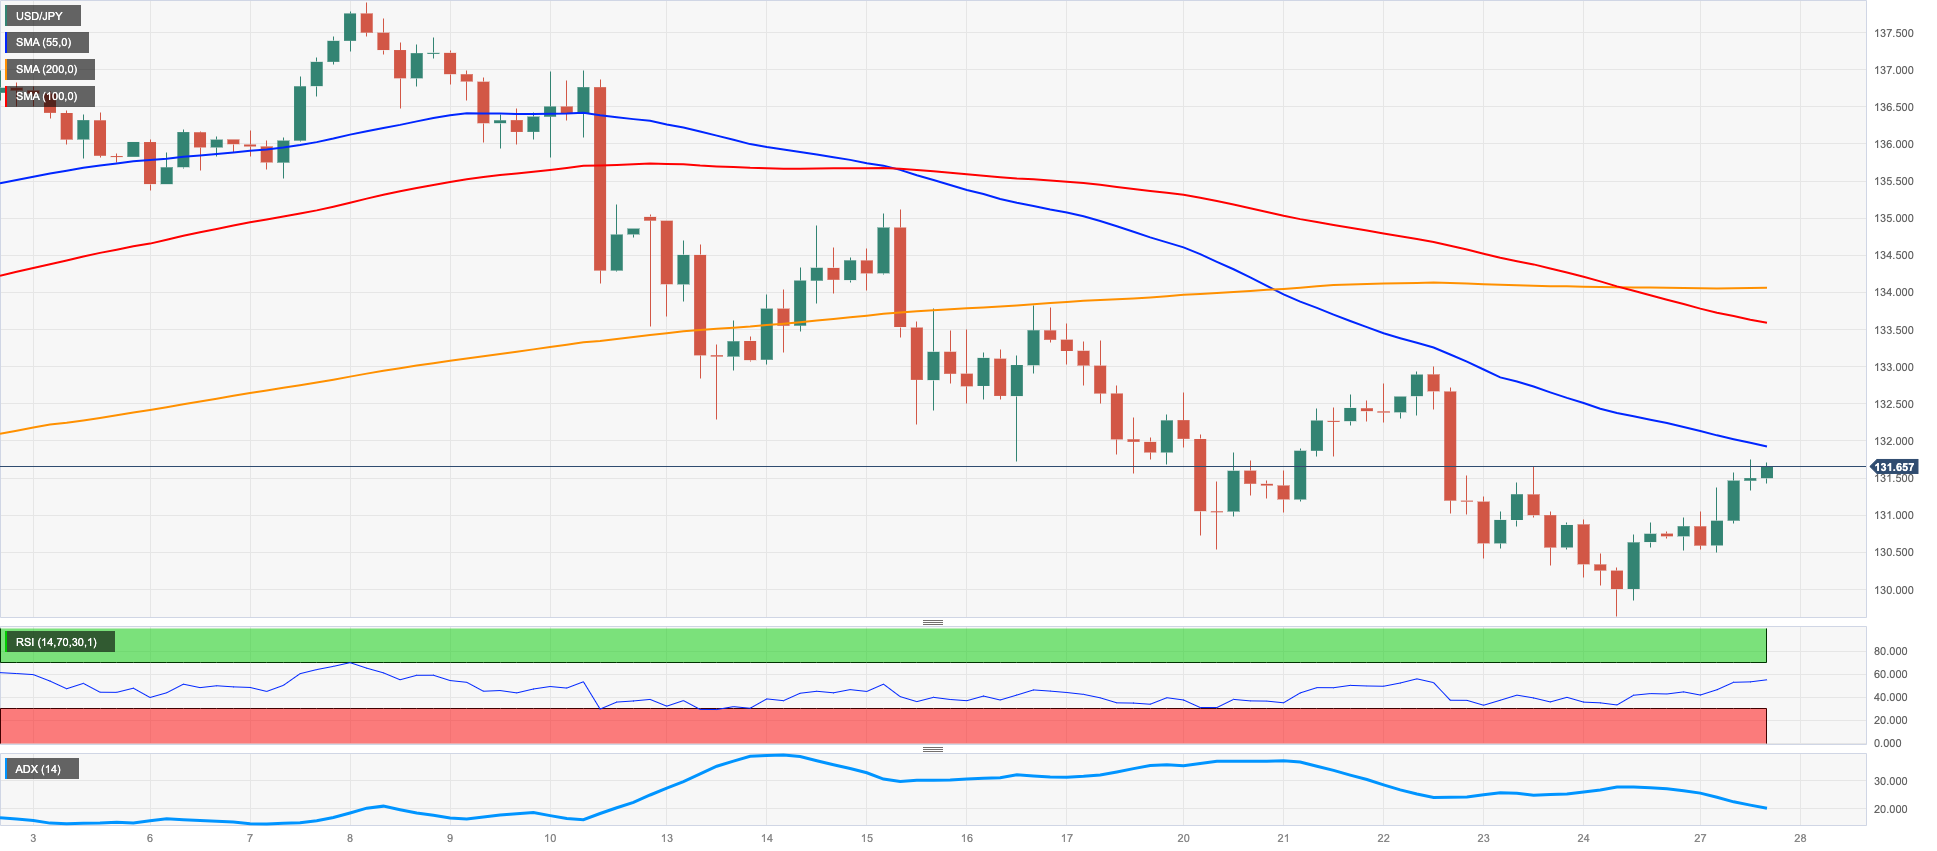
USD/JPY showed some signs of life and printed decent gains for the first time after three consecutive daily pullbacks at the beginning of the week. Indeed, spot gathered fresh steam and surpassed the 131.00 region to clock 3-day highs.
Despite the poor price action around the greenback, the pair reacted positively to the moderate pick-up in US yields across the board, which managed to trim part of the recent strong decline.
In the Japanese calendar, final readings for the month of January saw the Leading Economic Index at 96.6 and the Coincident Index at 96.4.
Despite the daily bounce, USD/JPY remains under pressure for the time being. Against that, further selling could put the March low at 129.63 (March 24) back on the investors’ radar ahead of the February low at 128.08 (February 2) and the 2023 low at 127.21 (January 16). Just the opposite, the 55-day SMA at 132.40 emerges as the immediate interim hurdle prior to the weekly top at 133.00 (March 22) and the provisional 100-day SMA at 134.28. Up from here aligns the key 200-day SMA at 137.37 before the 2023 high at 137.91 (March 8). The daily RSI improved past the 42 mark.
Resistance levels: 131.74 133.00 133.97 (4H chart)
Support levels: 129.63 128.08 127.21 (4H chart)
GBPUSD
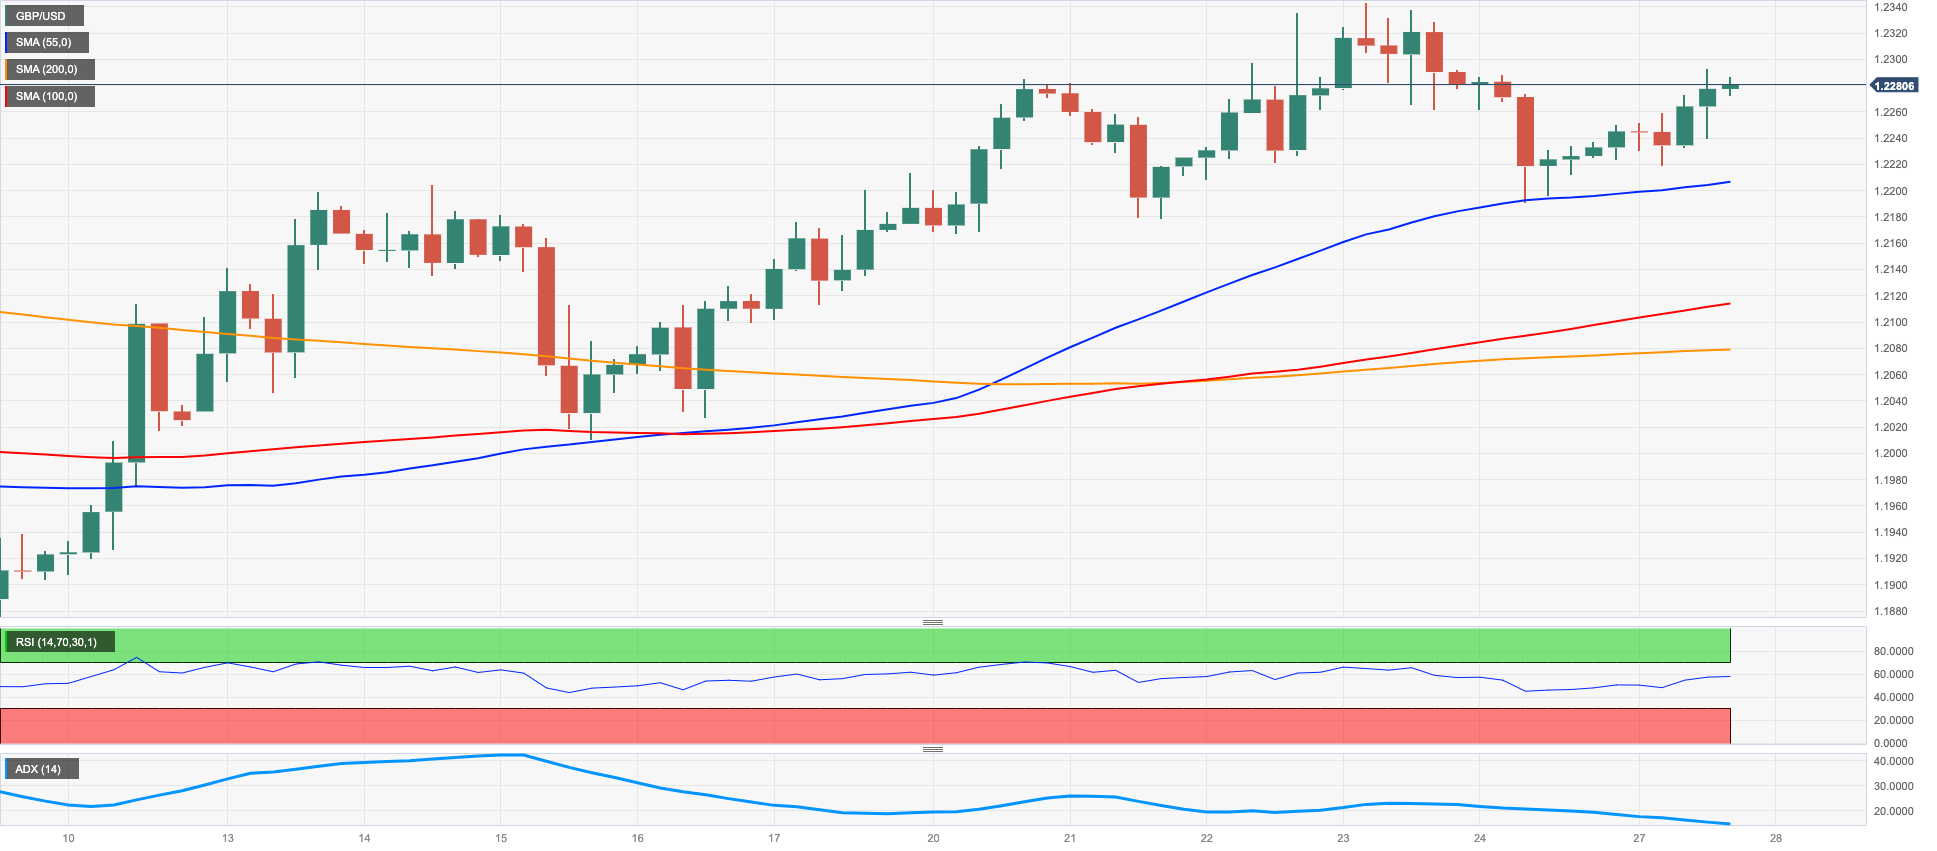
The moderate daily pullback in the greenback seems to have been enough to sponsor an auspicious start of the week for the risk-associated universe.
Against that, and while the USD Index (DXY) breached the 103.00 mark, GBP/USD set aside Friday’s retracement and traded just pips away from the key 1.2300 the figure, shifting the attention back to recent monthly highs in the 1.2340/50 band (March 22, 23)
In the UK, the only scheduled release saw the CBI Distributive Trades ease a tad to 1 for the current month (from 2).
The resumption of the upside momentum in GBP/USD continues to target the March high at 1.2343 (March 23). The surpass of this level could open the door to the 2023 top at 1.2447 (January 23) prior to the May 2022 peak at 1.2666 (May 27). Further up aligns the 200-week SMA at 1.2869 ahead of the psychological 1.3000 yardstick. On the flip side, temporary support levels emerge at the 55- and 100-day SMAs at 1.2150 and 1.2098, respectively, followed by the weekly low at 1.2010 (March 15) and the key 200-day SMA at 1.1891. South from here comes the 2023 low at 1.1802 (March 8) before the November 2022 low at 1.1142 (November 4). The daily RSI gathered some fresh traction and surpassed 58.
Resistance levels: 1.2343 1.2401 1.2447 (4H chart)
Support levels: 1.2189 1.2078 1.2010 (4H chart)
AUDUSD
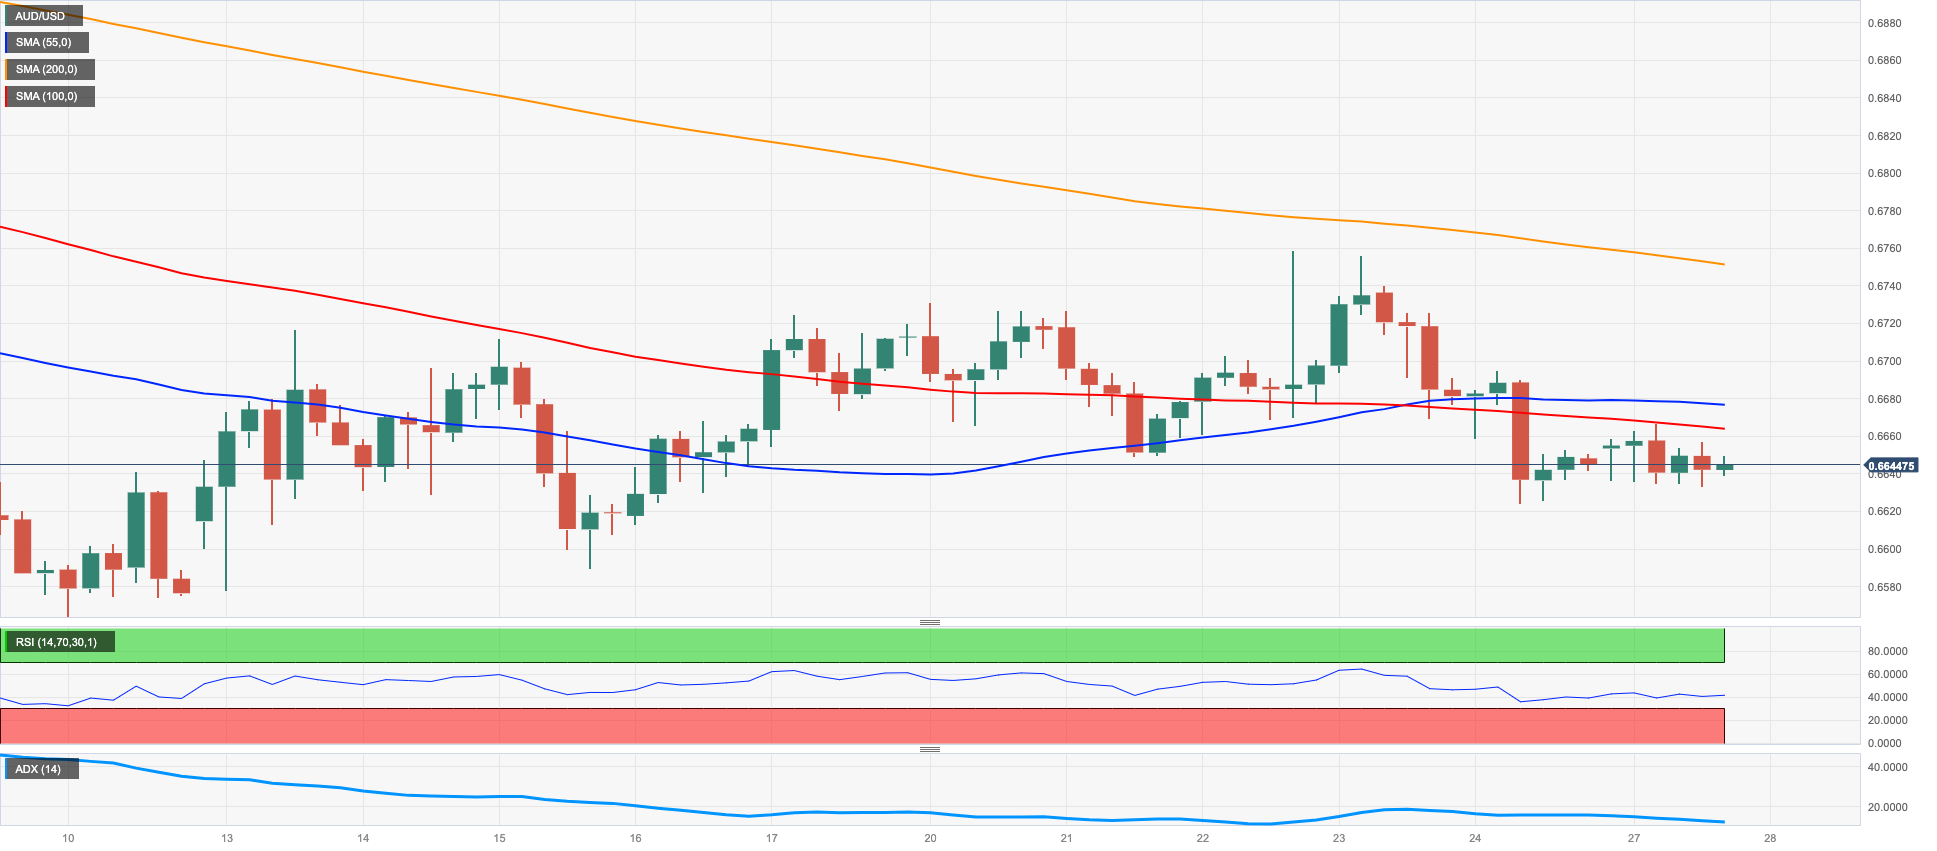
AUD/USD started the trading week in a vacillating mood despite the bearish note surrounding the greenback.
Indeed, while fresh selling pressure dragged the USD Index (DXY) back below the 103.00 region, the mixed price action in the commodity complex limited the daily losses in the Aussie dollar after copper prices reversed earlier losses and the iron ore extended the recent downtrend.
There were no data releases Down Under on Monday, leaving all the attention to Tuesday’s publication of Retail Sales and the speech by RBA’s Connolly.
The continuation of the downward bias could see AUD/USD revisit the 2023 low at 0.6563 (March 10) ahead of the weekly low at 0.6386 (November 10 2022) and the November 2022 low at 0.6272 (November 3). On the contrary, the weekly top at 0.6758 (March 22) appears so far reinforced by the key 200-day SMA, while the loss of this region could put the pair en route to a potential test of the March peak at 0.6783 (March 1) prior to the temporary hurdles at the 100- and 55-day SMAs at 0.6791 and 0.6848, respectively. North from here aligns the key round level at 0.7000 before the weekly high at 0.7029 (February 14). The daily RSI advanced marginally to the vicinity of 42.
Resistance levels: 0.6759 0.6783 0.6920 (4H chart)
Support levels: 0.6625 0.6589 0.6563 (4H chart)
GOLD
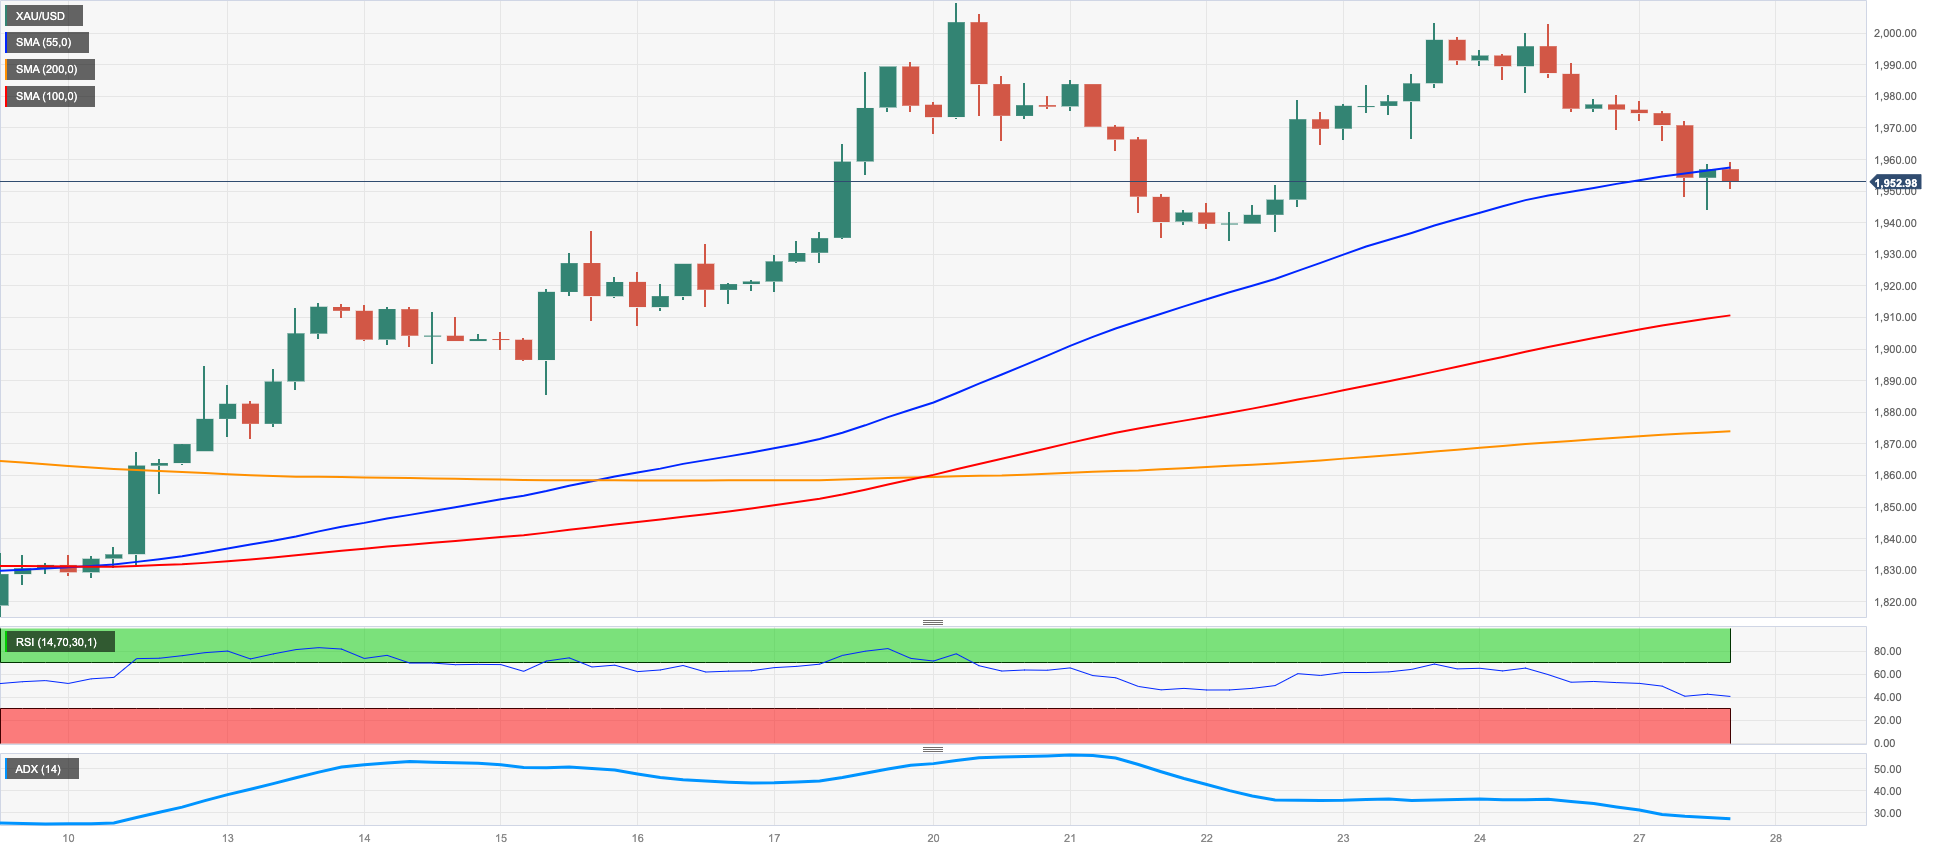
Gold prices added to Friday’s corrective decline and recorded new 2-day lows near $1945 per ounce troy at the beginning of the week.
Despite the offered stance in the dollar, bullion traded on the defensive on the back of somewhat dwindling concerns over a crisis in the US/European banking sector, which eventually weighed on the demand for the safe haven universe.
In addition, the moderated recovery in US yields across the curve also added to the pessimistic start of the week for the precious metal.
Immediately to the upside for gold still emerges the 2023 top at $2009. The surpass of the latter could pave the way for a move to the 2022 peak at $2070 (March 8) ahead of the all-time high at $2075 (August 7 2020). The other way around, there is a minor support at the weekly low at $1934 (March 22) before the interim 55- and 100-day SMAs at $1889 and $1840, respectively. The breach of this region exposes a deeper drop to the March low at $1809 (March 8) followed by the 2023 low at $1804 (February 28) and the key 200-day SMA at $1781.
Resistance levels: $2009 $2070 $2075 (4H chart)
Support levels: $1944 $1934 $1885 (4H chart)
CRUDE WTI
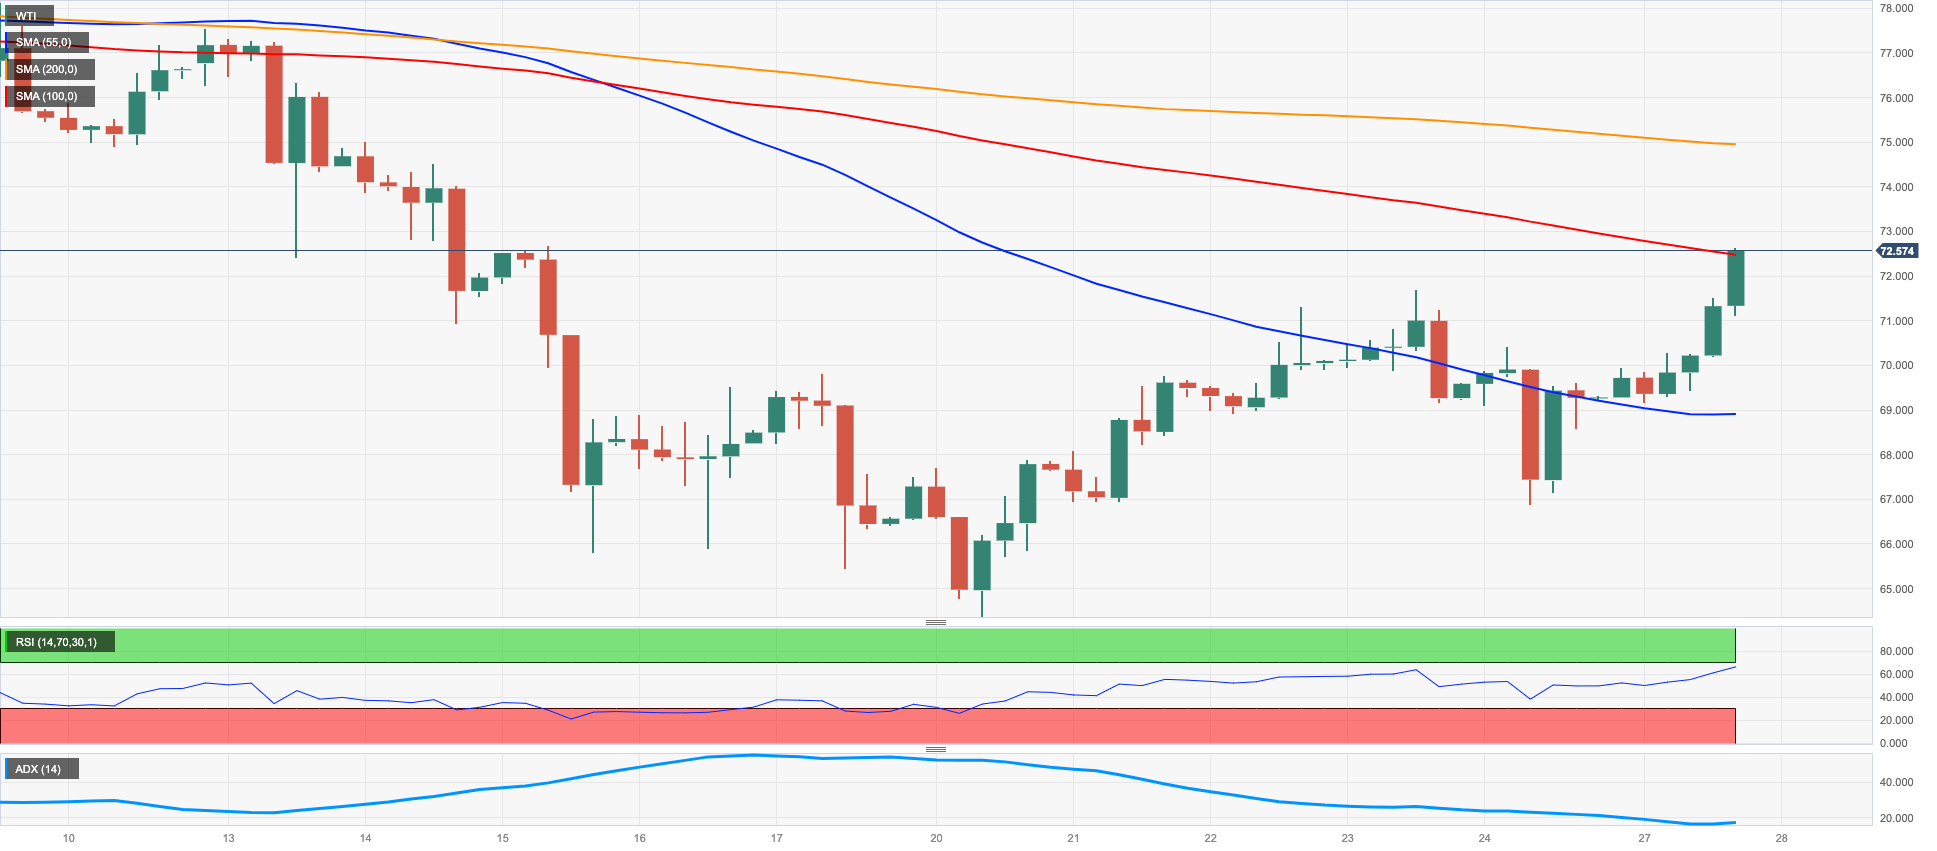
Prices of the WTI regained the smile and set aside two consecutive daily pullbacks on Monday, advancing sharply to multi-day highs north of the $72.00 mark per barrel.
The weak note hurting the dollar coupled with easing concerns around the banking sector lent oxygen to the commodity and sponsored the continuation of the positive mood for the second week in a row.
Also collaborating with the upbeat mood in crude oil resurfaced geopolitical concerns following V.Putin’s intentions to station tactical nuclear weapons in Belarus, while a halt in exports of Kurdish crude oil also put upward pressure on prices.
A more serious recovery in prices of the WTI should leave behind the interim hurdles at the 55- and 100-day SMAs at $76.27 and $77.61 respectively. Once this area is cleared, the commodity could confront the March top at $80.90 (March 7) ahead of the 2023 peak at $82.60 (January 23). By contrast, the next support of note emerges at the 2023 low at $64.41 (March 20) seconded by the December 2021 low at $62.46 (December 2) and the August 2021 low at $61.76 (August 23). The breakdown of the latter could put a potential test of the key $60.00 mark per barrel to the test in the near term.
Resistance levels: $72.55 $74.95 $78.01 (4H chart)
Support levels: $66.79 $64.41 $62.42 (4H chart)
GER40
Easing banking jitters following recent news involving UBS-Credit Suisse and lately SVB-First Citizens Bank encouraged European equities to start the new trading week with a smile.
In addition, German top lender Deutsche Bank reversed part of the recent steep sell-off, which also collaborated with the positive mood among market participants amidst a broad-based risk-on tone in the global markets.
Following their American peers, the 10-year Bund yields trimmed part of the recent 3-day pullback and advanced to the vicinity of the 2.30% region.
Data wise in Germany, better-than-expected Business Climate gauged by the IFO Institute for the month of March (93.3) also kept the bid bias well in place on Monday.
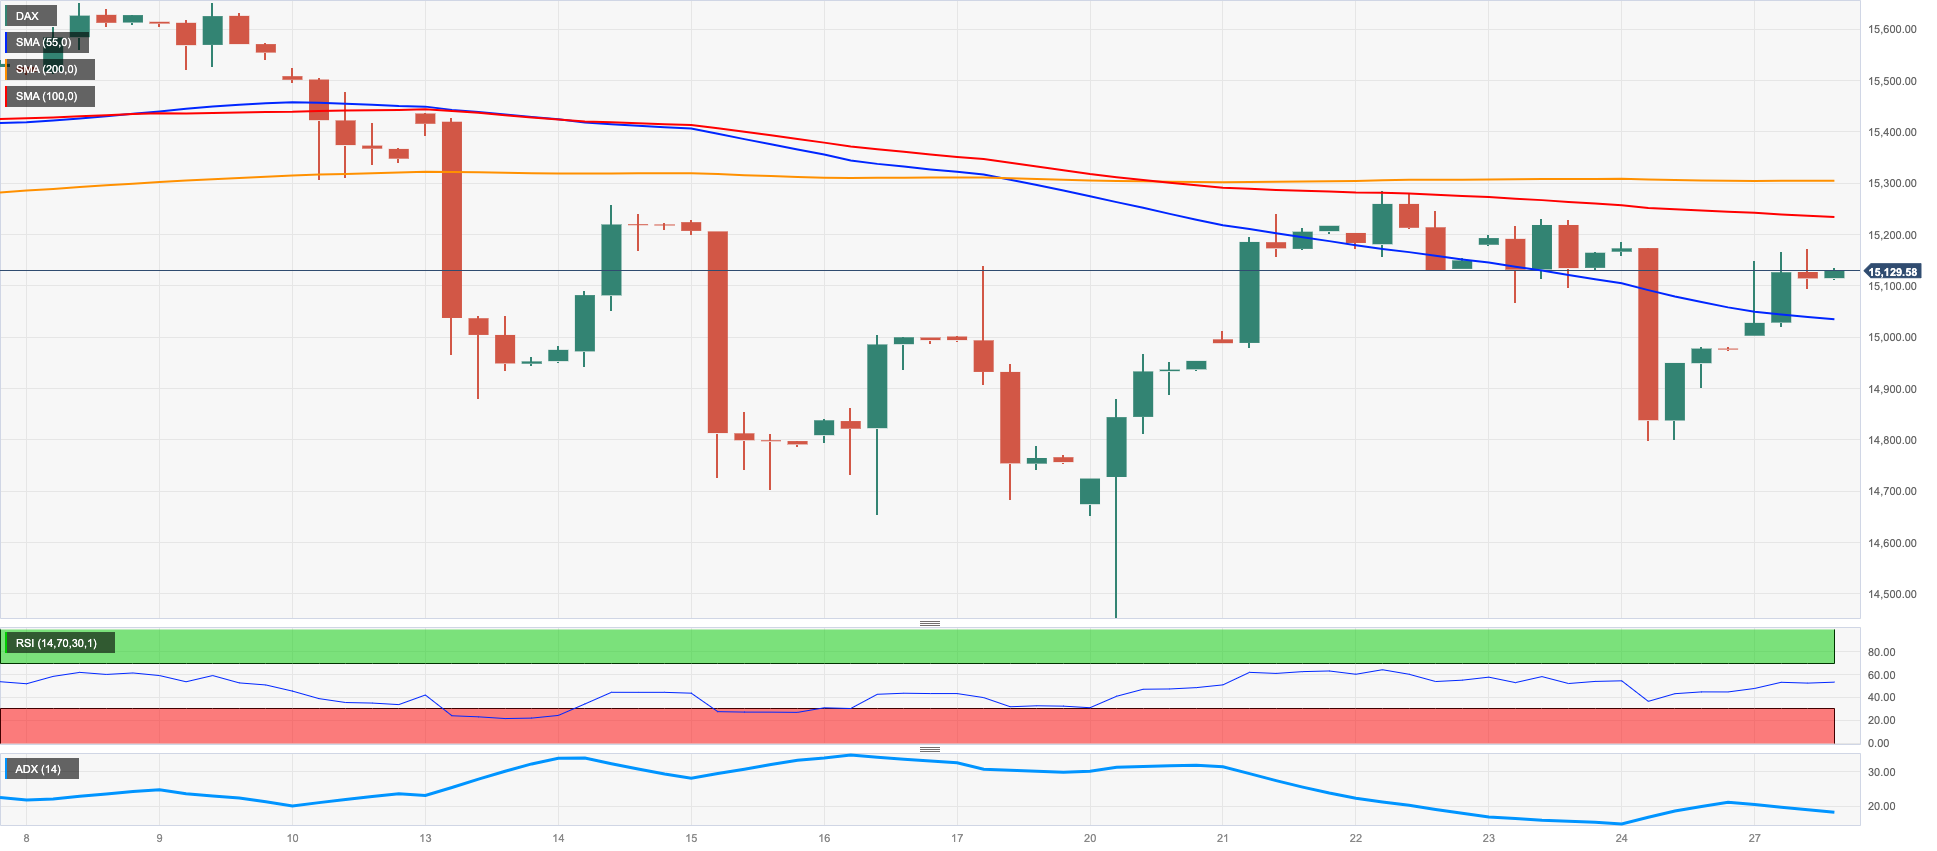
Next on the upside for the DAX40 comes the weekly peak at 15298 (March 22). If the index clears this level, it could then prompt a test of the 2023 high at 15706 (March 6) to re-emerge on the horizon ahead of the February 2022 top at 15736 (February 2 2022) and the round level at 16000, all prior to the 2022 peak at 16285 (January 5). On the other hand, the 100-day SMA at 14791 offers temporary contention seconded by the March low at 14458 (March 20) and the key 200-day SMA at 13887. South from here turns up the December 2022 low at 13791 (December 13). The daily RSI picked up pace and trespassed the 48 level.
Best Performers: Deutsche Bank AG, Sartorius AG, Commerzbank
Worst Performers: Vonovia, Henkel VZO, Adidas
Resistance levels: 15298 15495 15706 (4H chart)
Support levels: 14809 14458 13791 (4H chart)
NASDAQ
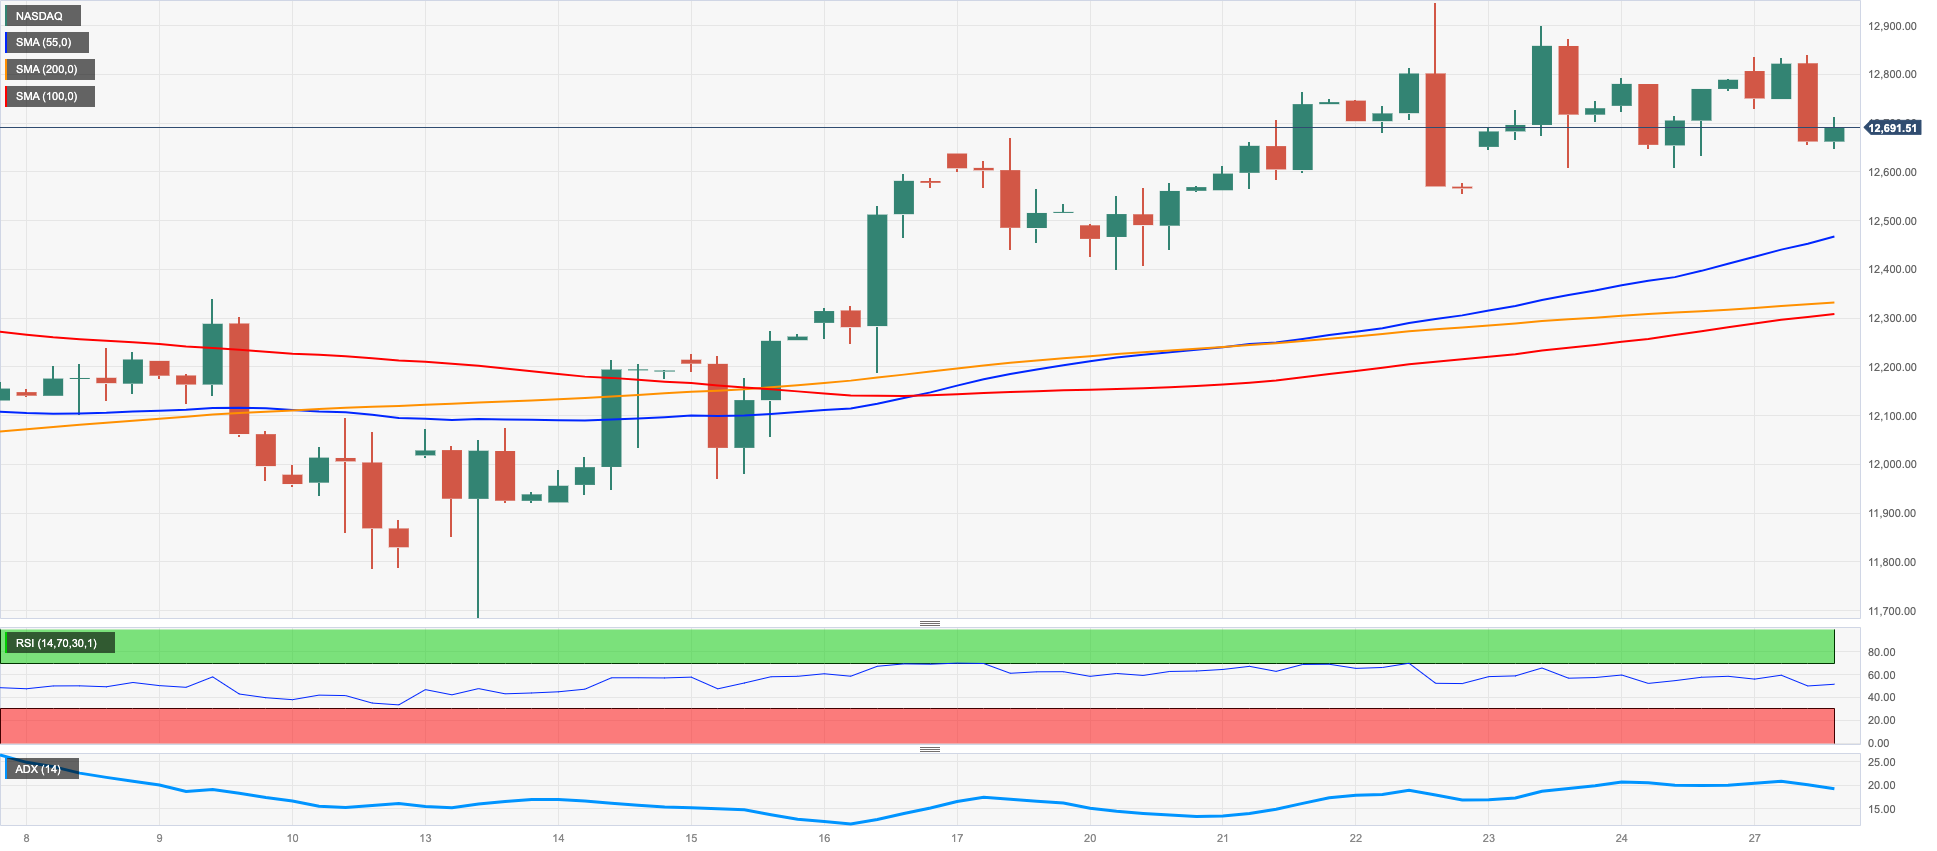
Tech equities measured by the benchmark Nasdaq 100 retreated markedly at the beginning of the week despite the negative performance of the greenback and alleviated concerns surrounding the banking sector.
Indeed, optimism seemed to have re-emerged on Monday after First Citizens Bank announced over the weekend it will buy the troubled SVB.
The better tone in the risk complex, however, failed to ignite a bounce in the tech sector, which succumbed to the noticeable rebound in US yields across the curve and put megacaps like Meta Platforms, Apple and Microsoft (among others) well under pressure.
Further upside in the Nasdaq 100 is expected to meet the next hurdle at the 2023 peak at 12943 (March 22) closely followed by the round level at 13000 and prior to the weekly high at 13175 (August 26 2022). Having said that, the immediate contention aligns at the interim 55-day SMA at 12123 before the more significant 200-day SMA at 11904 and the March low at 11695 (March 13). The breakdown of this level could pave the way to weekly lows at 11550 (January 25) and 11251 (January 19) prior to the 2023 low at 10696 (January 6) and the December 2022 low at 10671 (December 22). The daily RSI deflated a tad below the 60 yardstick.
Top Gainers: Diamondback, Warner Bros Discovery, Constellation Energy
Top Losers: PDD Holdings Inc, Alphabet A, Alphabet C
Resistance levels: 12943 13175 13720 (4H chart)
Support levels: 12407 12026 11695 (4H chart)
DOW JONES
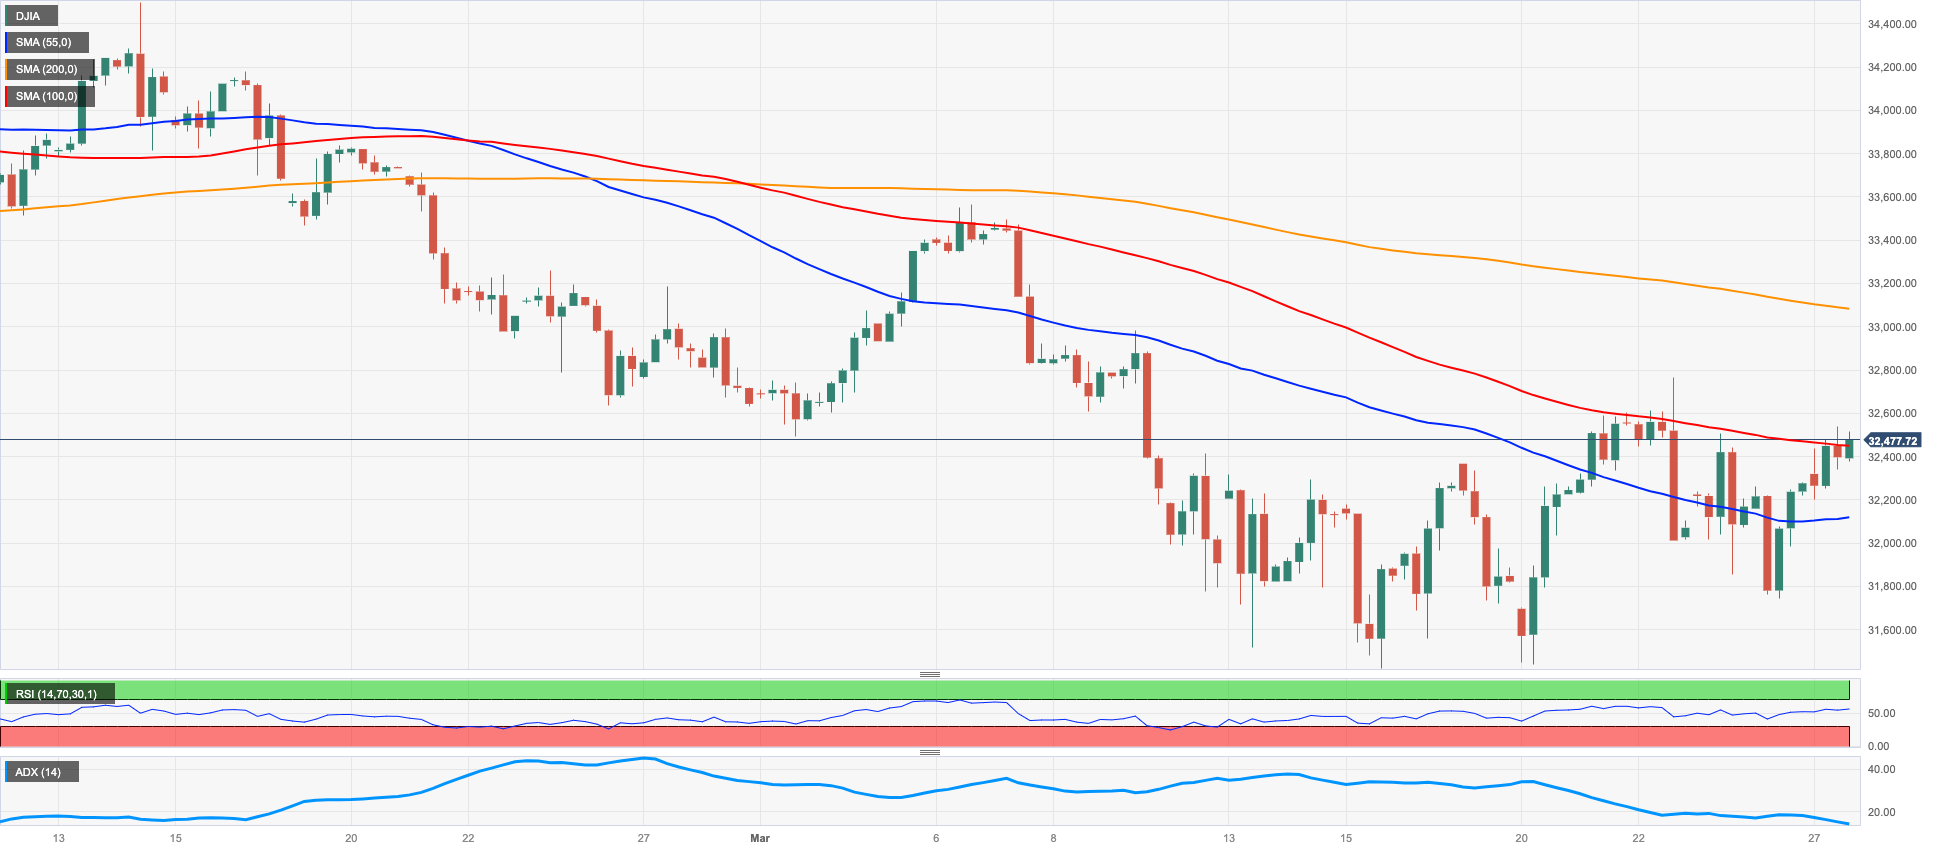
The US stock benchmark Dow Jones started the week in an upbeat mood and added to Friday’s gains past the 32500 level.
In addition, the upside momentum encouraged the benchmark index to leave behind the key 200-day SMA (33356), which bodes well for the continuation of the upside bias and helped the Dow to refocus on last week’s top near 32800 (March 22).
Fresh and positive news around the banking sector involving SVB and First Citizens allowed some optimism to return to the market and prop up the daily advance.
Overall, the Dow Jones rose 0.78% to 32488, the S&P500 advanced 0.39% to 3986 and the tech-heavy Nasdaq Composite retreated 0.29% to 11789.
The Dow Jones now faces the next resistance level at weekly top at 32761 (March 23) followed by the March high at 33572 (March 6) and the 2023 top at 34342 (January 13). Further gains from here are expected to dispute the December 2022 peak at 34712 (December 13) seconded by the April 2022 high at 35492 (April 21). Oppositely, a close below the 200-day SMA at 32356 could prompt the index to slip back to the 2023 low at 31429 (March 15) prior to the 30000 mark and the 2022 low at 28660 (October 13). The daily RSI rose to the boundaries of the 48 region.
Top Performers: JPMorgan, IBM, Merck&Co
Worst Performers: Nike, Microsoft, Apple
Resistance levels: 32761 32990 33313 (4H chart)
Support levels: 31429 28660 26143 (4H chart)
MACROECONOMIC EVENTS

All Information & Updates provided by:

All information relating to the financial markets available on this page has been prepared and issued by FXStreet (Forexstreet SL, Spain, Reg: B62498233) on the basis of publicly available information and all information believed to be reliable and does not conflict with Kuwaiti local laws, and all necessary care has been taken to before the company to ensure that the facts mentioned are correct from the source.
NCM Investment nor any of its directors or employees shall in any way be held responsible for the contents of this news, and the information contained on this page is intended only to provide clients with publicly available information and should not be construed as investment advice, report or analysis and/or constitute an offer or invitation to buy or sell financial instruments of any kind.
RISK WARNING: Forex and CFDs are highly risky leveraged products, as losses can exceed deposits. Please ensure you understand all the risks and take independent advice if necessary. NCM will segregate the clients based on the criteria of the regulator and its bylaws. NCM does not provide any advisory service; the material published does not constitute advice or a recommendation for a transaction in any financial instrument. NCM accepts no responsibility for any use of the content presented and any consequences of that use. Anyone acting on the information provided does so at their own risk.