
- Contact Us:
-

-

-

-


Daily Market Updates
29 Mar 2023
USDJPY
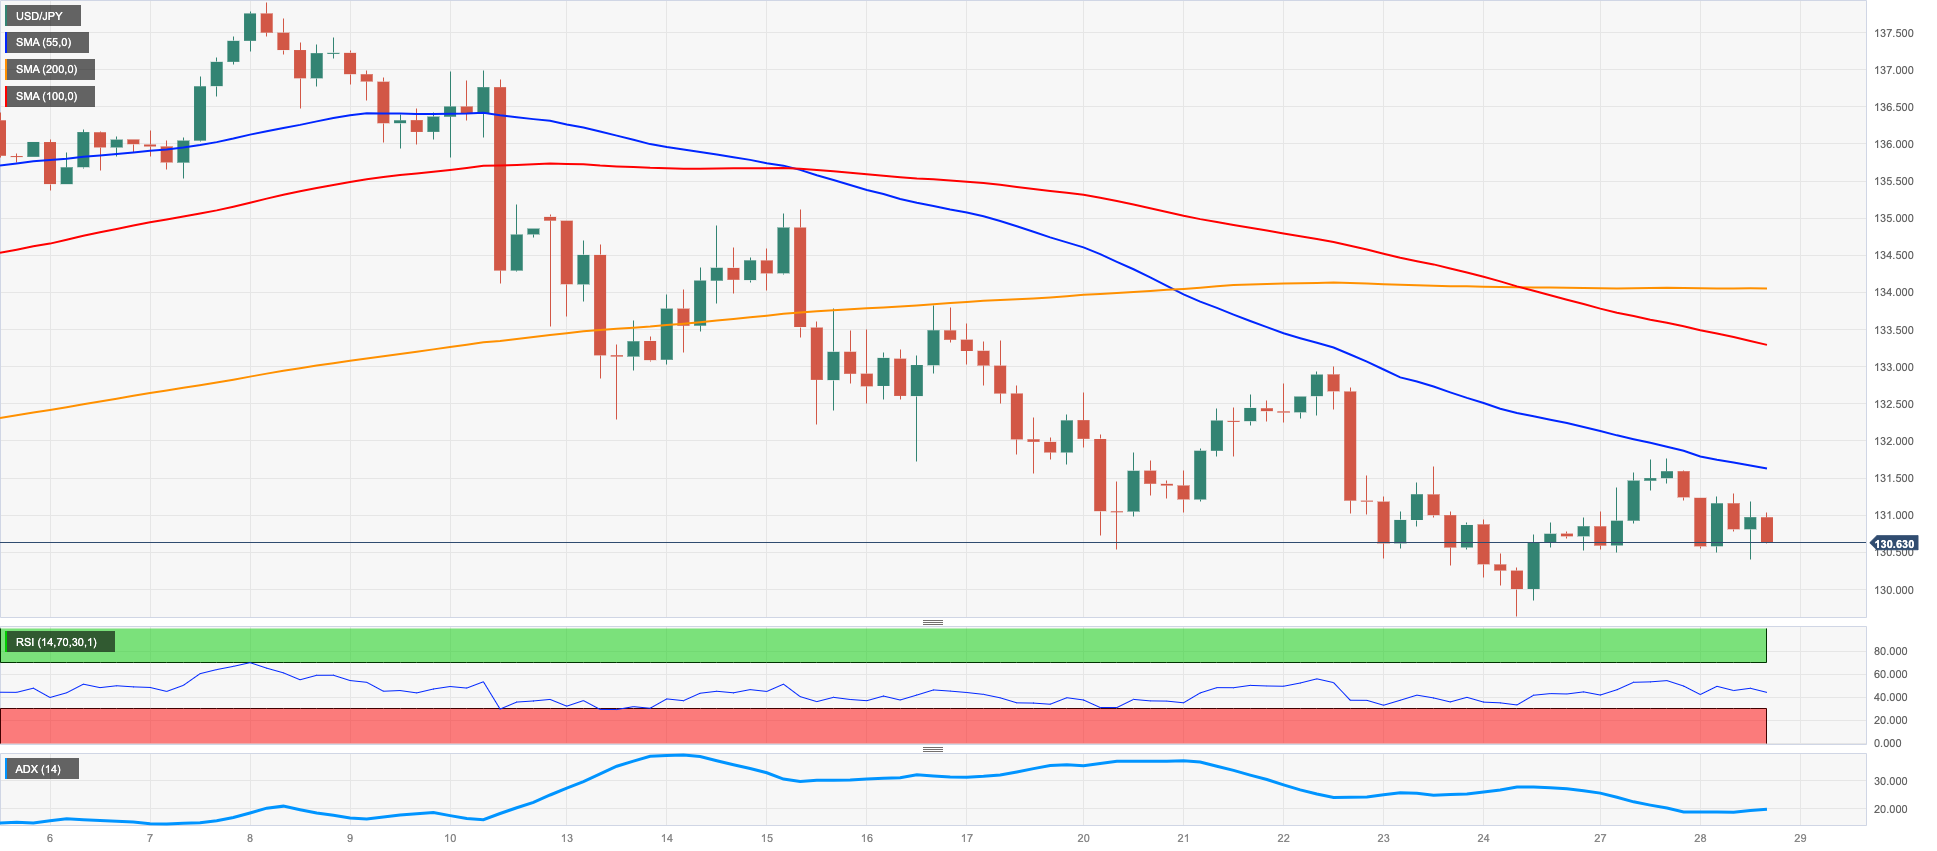
USD/JPY reversed part of the optimism seen at the beginning of the week and returned to the 130.40 region, where some decent support seems to have turned up so far.
The late bounce in US yields across the curve appears to have sparked some bouts of weakness in the Japanese yen, which remained moderately bid against the backdrop of so far unabated banking concerns.
Another daily pullback in the greenback also collaborated with the pair’s bearish move after the USD Index (DXY) saw its downtrend renewed and revisited the 102.40 region.
Unsurprisingly, there was no reaction from the FX universe after BoJ Governor H. Kuroda insisted that it is still premature to assess an exit strategy from the ultra-accommodative monetary stance.
The Japanese calendar was empty on Tuesday.
USD/JPY shows some signs of an early consolidative phase. In the meantime, there is an interim hurdle at the 55-day SMA at 132.38 ahead of the weekly peak at 133.00 (March 22) and the temporary 100-day SMA at 134.13. Once the latter is cleared, the pair could revisit the key 200-day SMA at 137.34 prior to the 2023 top at 137.91 (March 8). On the flip side, the March low at 129.63 (March 24) should hold the initial test seconded by the February low at 128.08 (February 2) and the 2023 low at 127.21 (January 16). The daily RSI deflated to the sub-40 region.
Resistance levels: 131.75 133.00 133.96 (4H chart)
Support levels: 129.63 128.08 127.21 (4H chart)
GBPUSD
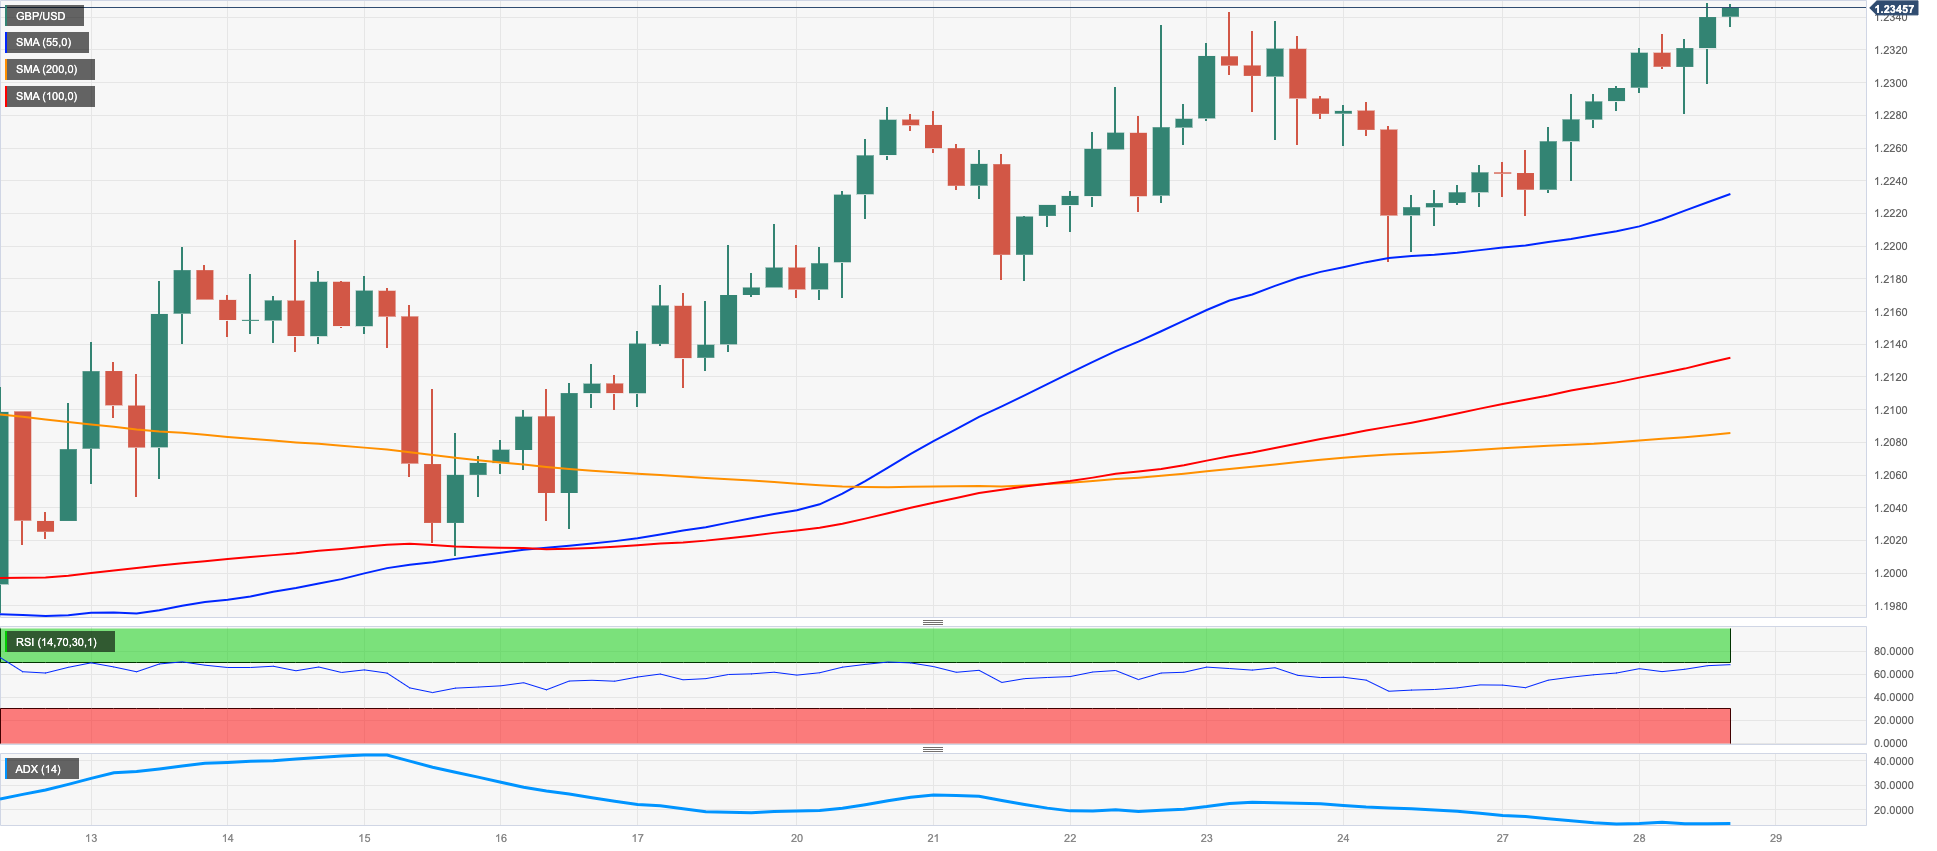
GBP/USD reclaimed the area well above 1.2300 the figure and advanced to monthly highs on the back of the persistent selling pressure hitting the greenback on Tuesday.
Indeed, the dollar remained on the back foot and extended further the negative start of the week amidst the generalized firmer tone in the risk complex.
From the BoE, Governor A. Bailey was far from hawkish after he suggested that interest rates could not return to levels they once had in response to the underlying state of the UK economy. Currently, investors penciled in a 25 bps rate hike in May and another 25 bps raise in Q3.
No data releases in the UK docket on Tuesday left all the attention to Wednesday’s release of Mortgage Approvals/Mortgage Lending figures and the speech by MPC (hawk) member C. Mann.
The ongoing rebound carries the potential to encourage GBP/USD to retest the March top at 1.2343 (March 23) ahead of the 2023 peak at 1.2447 (January 23) and the May 2022 high at 1.2666 (May 27). The surpass of the latter could put a visit to the 200-week SMA at 1.2869 back on the investors’ radar before the psychological 1.3000 mark. In opposition, the 55- and 100-day SMAs at 1.2154 and 1.2106, respectively, should offer temporary contention ahead of the weekly low at 1.2010 (March 15) and the key 200-day SMA at 1.1891. The breach of the latter could put the 2023 low at 1.1802 (March 8) to the test prior to the November 2022 low at 1.1142 (November 4). The daily RSI climbed beyond the 61 zone.
Resistance levels: 1.2349 1.2401 1.2447 (4H chart)
Support levels: 1.2189 1.2085 1.2010 (4H chart)
AUDUSD
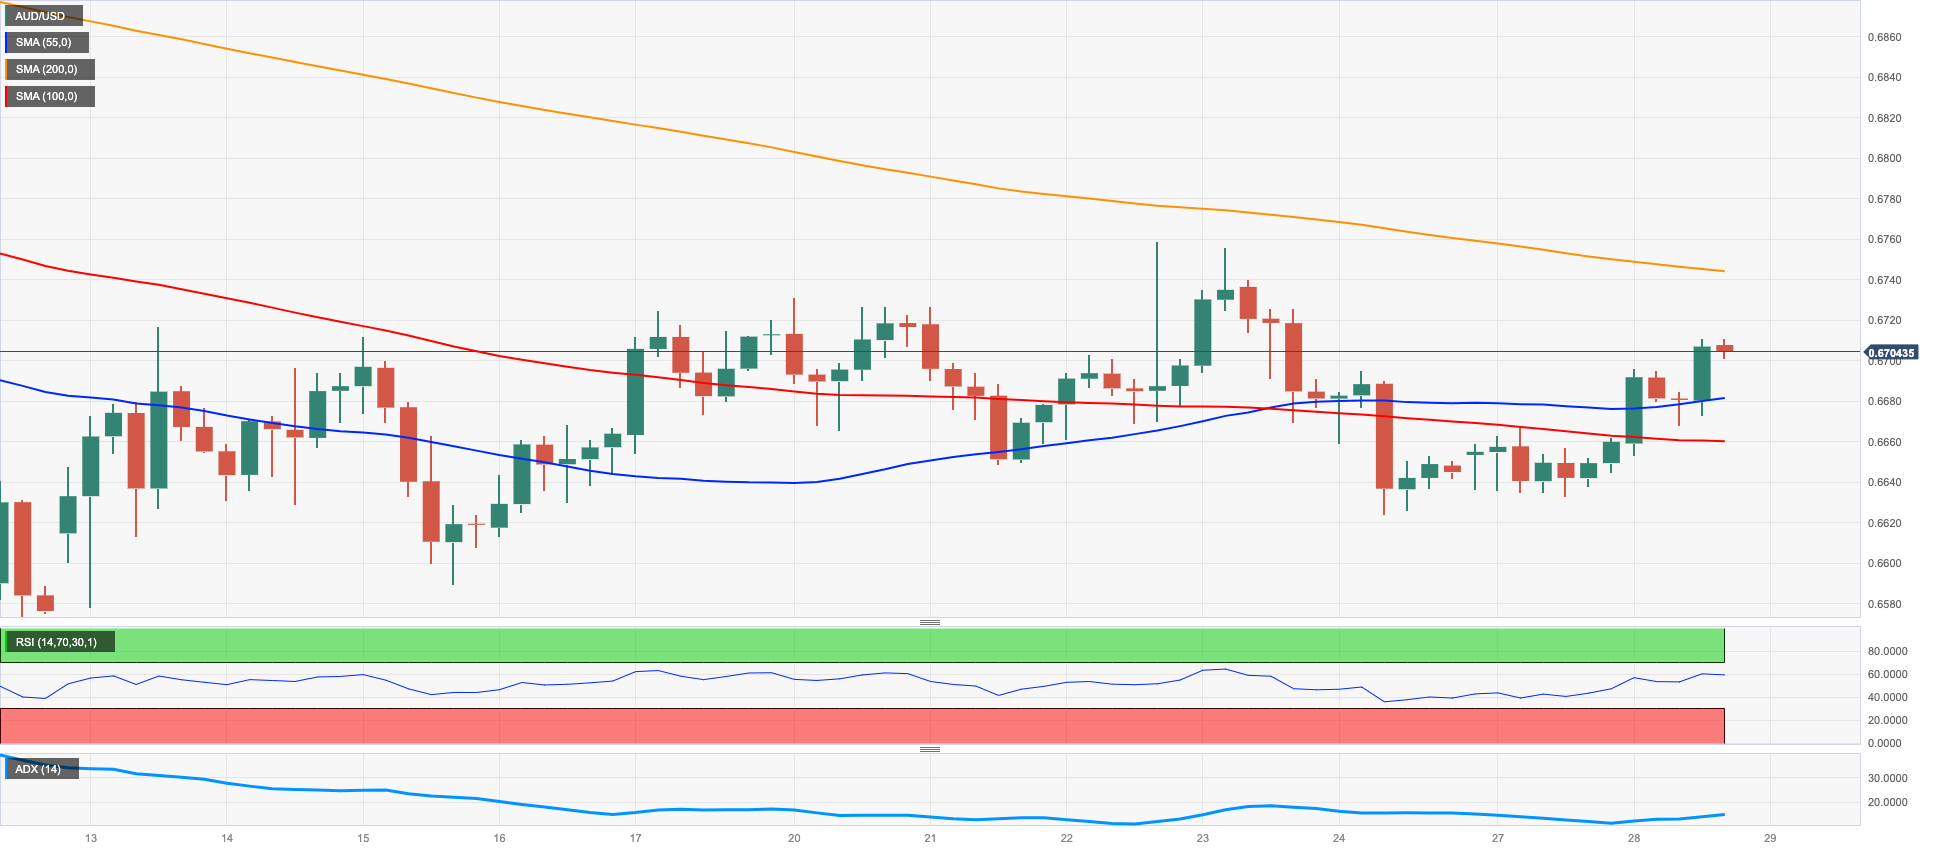
Extra improvement in the risk-associated universe coupled with further downside in the greenback helped AUD/USD pick up pace and trespass the key 0.6700 hurdle on Tuesday, or 3-day highs.
The Aussie dollar also derived extra strength from the broad-based bid bias in the commodity complex, where copper prices eased a tad and the iron ore extended the positive start of the week.
In Oz, preliminary Retail Sales surprised to the upside and expanded 0.2% MoM during February.
AUD/USD faces an important resistance zone in the mid-0.6700s, where the 200-day SMA and the weekly peak at 0.6758 (March 22) converge. Beyond this region, the pair could challenge the March high at 0.6783 (March 1) ahead of interim hurdles at the 100- and 55-day SMAs at 0.6794 and 0.6843, respectively. Further up comes the key round level at 0.7000 ahead of the weekly top at 0.7029 (February 14). Just the opposite, the 2023 low at 0.6563 (March 10) comes first seconded by the weekly low at 0.6386 (November 10 2022) and the November 2022 low at 0.6272 (November 3). The daily RSI leapt to the vicinity of the 49 yardstick.
Resistance levels: 0.6710 0.6750 0.6783 (4H chart)
Support levels: 0.6625 0.6589 0.6563 (4H chart)
GOLD
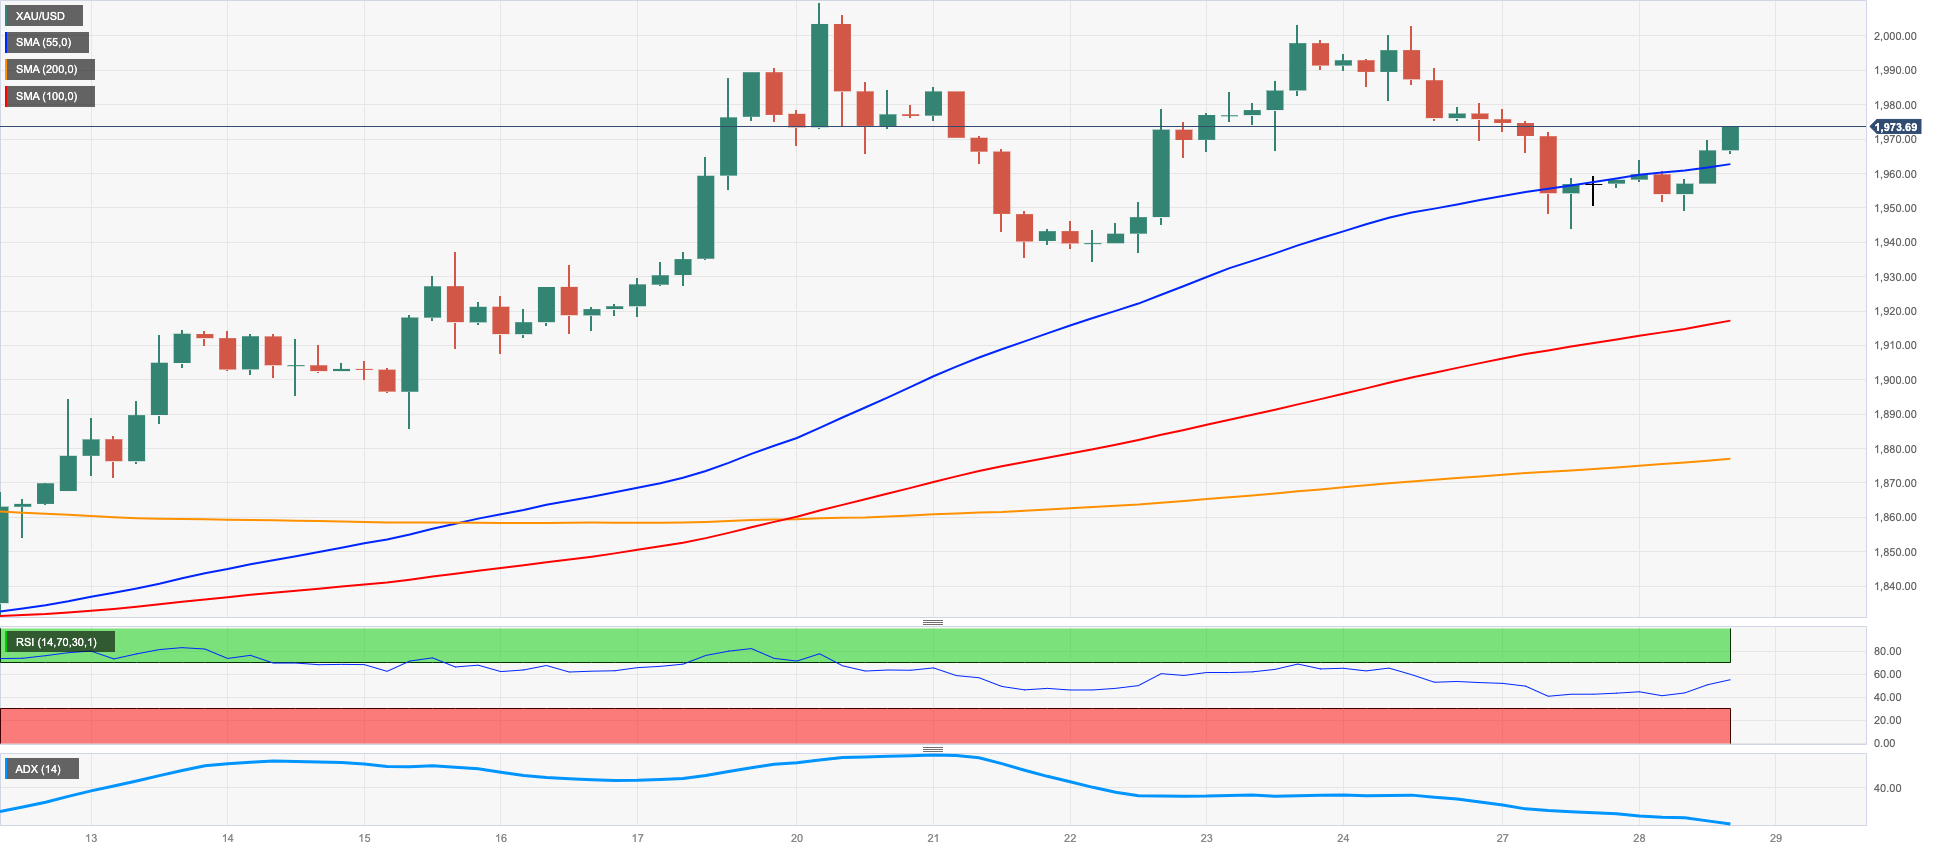
Prices of the yellow metal regained some poise and advanced to the $1970/75 region after two consecutive sessions with losses on Tuesday.
In fact, the continuous selling pressure in the greenback amidst expectations of a pause by the Fed at the May meeting supported the rebound in bullion, although the prevailing risk-on trade and the bounce in US yields seem to have limited the upside potential in the metal.
Moving forward, price action around gold should continue to track developments from the banking sector – mainly in the US and Europe – as well as the potential next steps by the Federal Reserve when it comes to further interest rate hikes. So far, consensus around a 25 bps rate hike in May appears pretty divided for the time being.
Further gains in gold should remain focused on the 2023 peak at $2009 (March 20) ahead of the 2022 high at $2070 (March 8) and the all-time top at $2075 (August 7 2020). On the contrary, the weekly low at $1934 (March 22) offers minor contention prior to the provisional 55- and 100-day SMAs at $1891 and $1843, respectively. Down from here comes the March low at $1809 (March 8) prior to the 2023 low at $1804 (February 28) and the key 200-day SMA at $1782.
Resistance levels: $1973 $2009 $2070 (4H chart)
Support levels: $1944 $1934 $1885 (4H chart)
CRUDE WTI
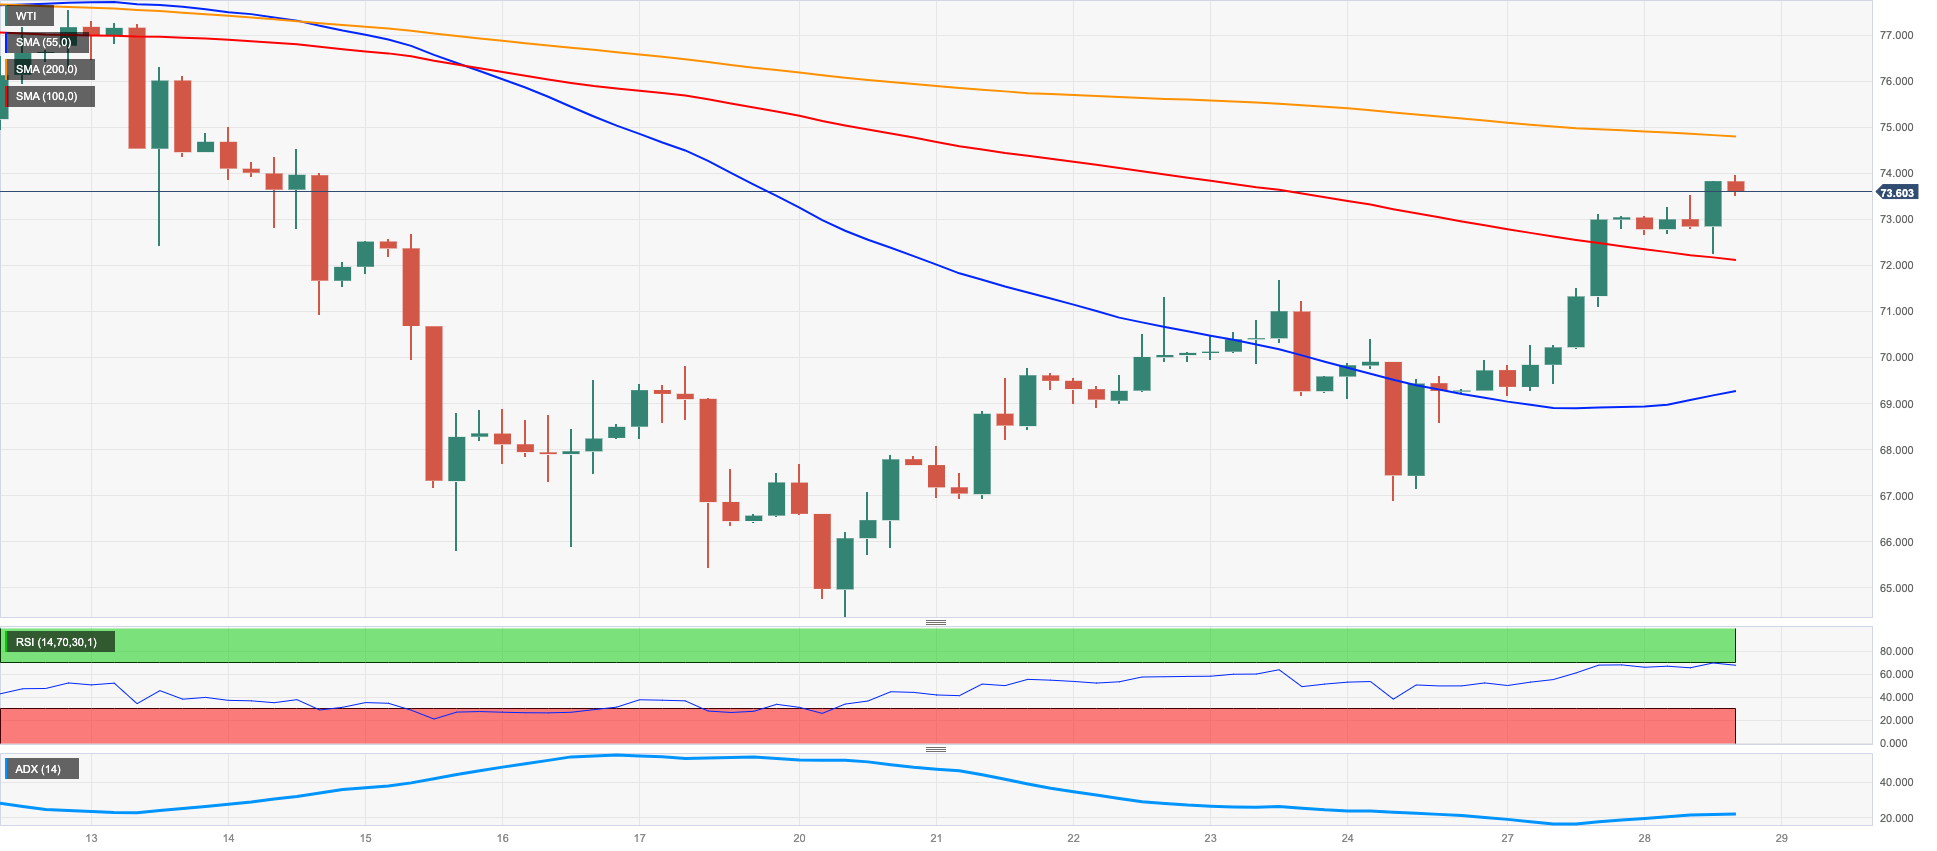
Prices of the WTI extended the rebound and rose past the $73.00 mark per barrel on Tuesday, or new multi-session peaks.
The persevering risk-on sentiment on the back of mitigated banking concerns in combination with the weaker dollar and prevailing supply disruptions affecting Iraqi exports of crude oil all propped up the continuation of the recovery in prices of the West Texas Intermediate.
In addition, the optimistic forecast of higher imports of crude oil by China for the current year also seem to have underpinned the traders’ mood.
Later in the NA session, the American Petroleum Institute (API) is expected to report on US crude oil supplies in the week to March 24.
Extra rebound in prices of the WTI should now meet the next hurdle at the temporary 55- and 100-day SMAs at $76.28 and $77.44 respectively, ahead of the March peak at $80.90 (March 7) and the 2023 high at $82.60 (January 23). On the opposite side, there is no support of note until the 2023 low at $64.41 (March 20). The breakdown of this level could spark a deeper retracement to the December 2021 low at $62.46 (December 2) ahead of the August 2021 low at $61.76 (August 23) and the key $60.00 mark per barrel.
Resistance levels: $73.89 $74.79 $78.01 (4H chart)
Support levels: $69.09 $66.79 $64.41 (4H chart)
GER40
European equities traded mostly with humble gains on Tuesday on the back of the dominating appetite for the risk complex, although cautiousness around the banking system in the old continent still remained present and somehow limited the upside in the major stock indices.
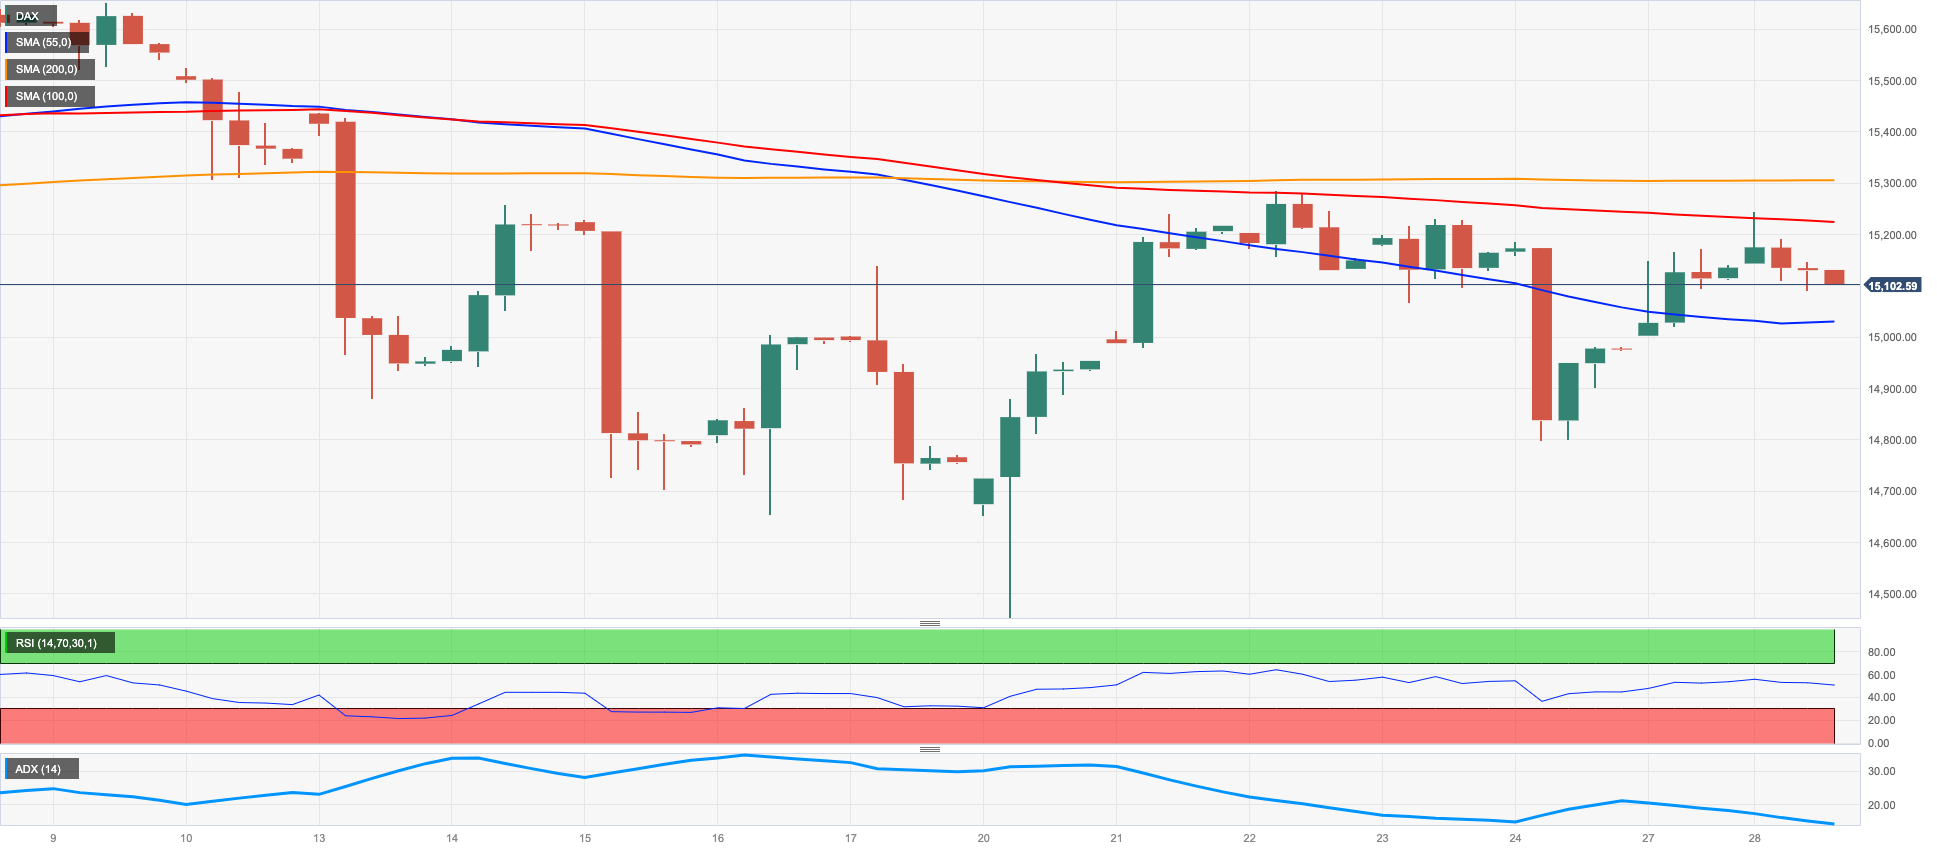
In fact, the German reference DAX40 advanced marginally above the 15100 mark, enough to extend the positive momentum for the second day in a row and keep weekly gains intact for the time being.
In the German money market, the 10-year Bund yields rose past the 2.30% mark and added to Monday’s gains, falling broadly in line with the performance of their US peers.
While the DAX40 might face some near-term range bound trade, the next up-barrier emerges at the weekly high at 15298 (March 22) ahead of the 2023 top at 15706 (March 6), which appears just before the February 2022 peak at 15736 (February 2 2022). The surpass of the latter could put the round level at 16000 back on the radar ahead of the 2022 high at 16285 (January 5). Oppositely, the breach of the temporary 100-day SMA at 14807 could pave the way for a deeper decline to the March low at 14458 (March 20) seconded by the key 200-day SMA at 13897. Once the latter is cleared, the index could challenge the December 2022 low at 13791 (December 13). The daily RSI rose slightly to the vicinity of 49.
Best Performers: Heidelbergcement, Siemens Energy AG, Continental AG
Worst Performers: Vonovia, Infineon, Qiagen
Resistance levels: 15298 15495 15706 (4H chart)
Support levels: 15079 14809 14458 (4H chart)
NASDAQ
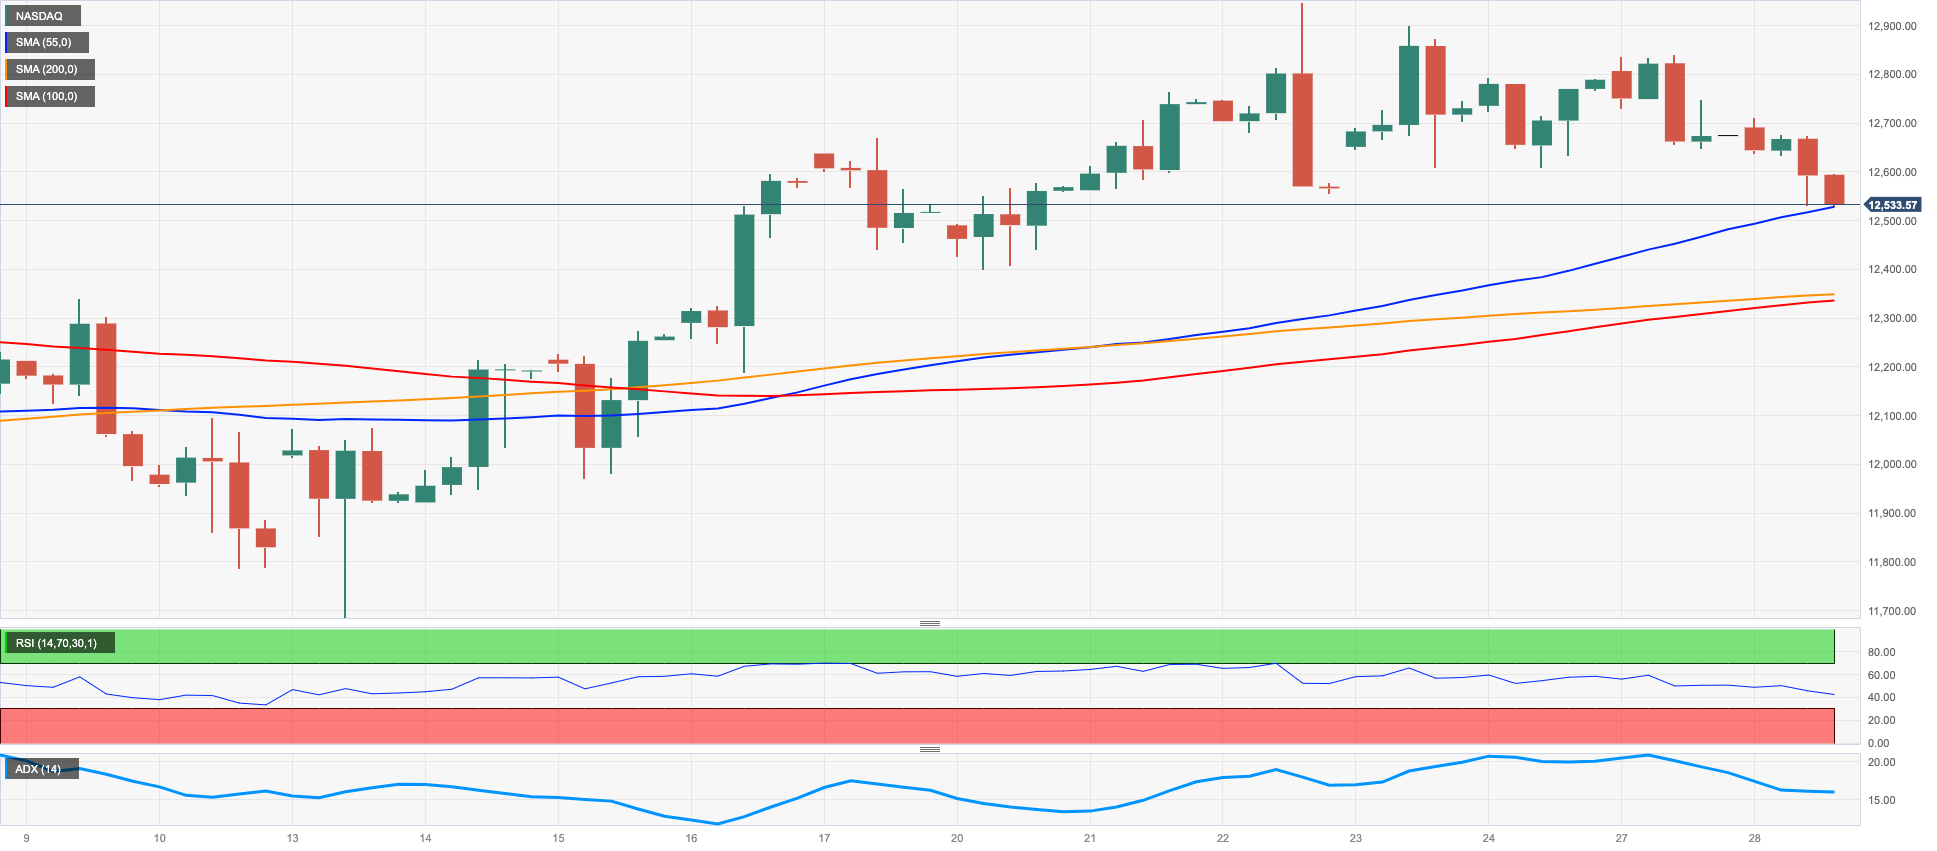
Tech equities measured by the Nasdaq 100 came under pressure, as the persistent recovery in US yields weighed on the sector on Tuesday.
The daily pullback in the index adds to the bearish move seen at the beginning of the week despite the better tone in the risk complex, the likelihood that a Fed’s pivot could be closer and the weaker dollar.
In case losses pick up pace, the Nasdaq 100 could revisit the provisional 55-day SMA at 12151 ahead of the key 200-day SMA at 11906 and the March low at 11695 (March 13). Once the latter is cleared, the index could confront weekly lows at 11550 (January 25) and 11251 (January 19) before the 2023 low at 10696 (January 6) and the December 2022 low at 10671 (December 22). On the other hand, the big magnet for bulls remains at the 2023 high at 12943 (March 22) just ahead of the round level at 13000 and seconded by the weekly top at 13175 (August 26 2022). The daily RSI lost further ground and approached 55.
Top Gainers: JD.com Inc Adr, Walgreen Boots, Datadog
Top Losers: Lucid Group, AMD, Lam Research
Resistance levels: 12943 13175 13720 (4H chart)
Support levels: 12407 11783 11695 (4H chart)
DOW JONES
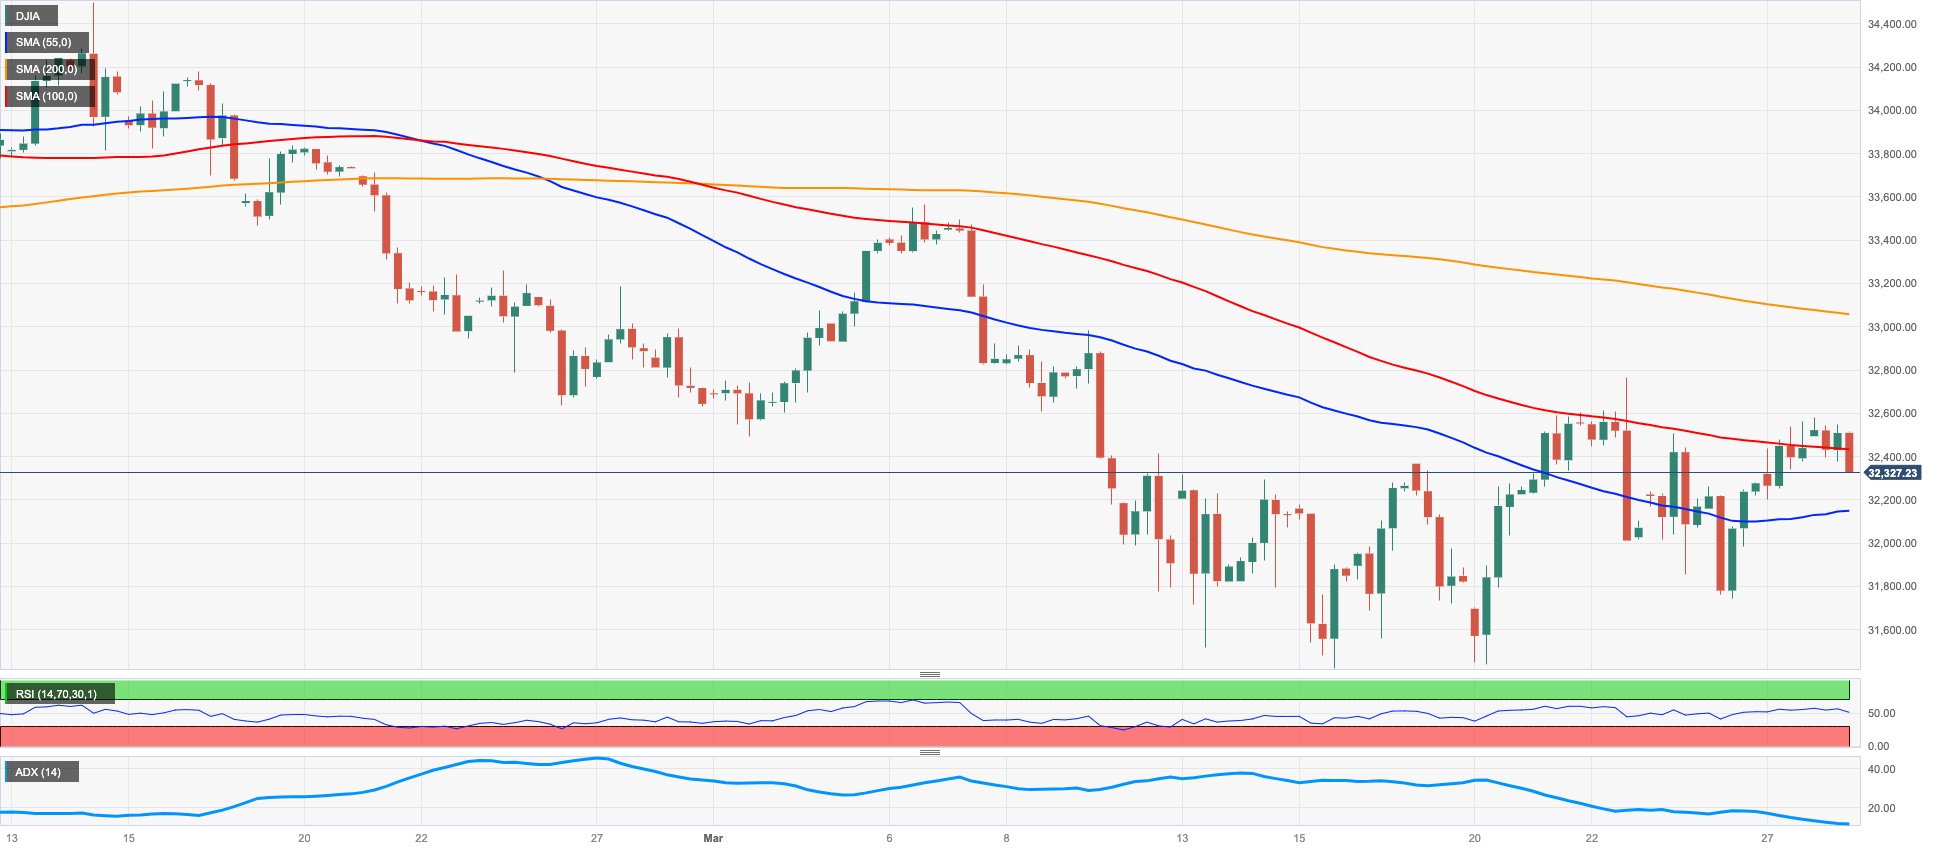
US equities traded in a bearish fashion on turnaround Tuesday, as the Dow Jones deflated 0.28% to 32342 while the S&P500 retreated 0.52% to 3956 and the tech-reference Nasdaq Composite dropped 1.01% to 11650.
In fact, somewhat easing banking jitters and another poor session of the dollar appear to have been insufficient to keep stocks on the bid side on Tuesday, while the late bounce in US yields across the curve reignited some downside pressure in growth/techs shares.
No changes to the topside in the Dow Jones, as the index remains initially focused on the weekly peak at 32761 (March 23) ahead of the March top at 33572 (March 6) and the 2023 peak at 34342 (January 13). North from here comes the December 2022 high at 34712 (December 13) prior to the April 2022 top at 35492 (April 21). By contrast, a convincing drop below the 200-day SMA at 32357 should prompt a test of the 2023 low at 31429 (March 15) to emerge on the horizon ahead of the 30000 mark and the 2022 low at 28660 (October 13). The daily RSI grind lower and flirted with the 46 area.
Top Performers: Walgreen Boots, Dow, Boeing
Worst Performers: American Express, Apple, Microsoft
Resistance levels: 32761 33310 33572 (4H chart)
Support levels: 31805 31429 28660 (4H chart)
MACROECONOMIC EVENTS

All Information & Updates provided by:

All information relating to the financial markets available on this page has been prepared and issued by FXStreet (Forexstreet SL, Spain, Reg: B62498233) on the basis of publicly available information and all information believed to be reliable and does not conflict with Kuwaiti local laws, and all necessary care has been taken to before the company to ensure that the facts mentioned are correct from the source.
NCM Investment nor any of its directors or employees shall in any way be held responsible for the contents of this news, and the information contained on this page is intended only to provide clients with publicly available information and should not be construed as investment advice, report or analysis and/or constitute an offer or invitation to buy or sell financial instruments of any kind.
RISK WARNING: Forex and CFDs are highly risky leveraged products, as losses can exceed deposits. Please ensure you understand all the risks and take independent advice if necessary. NCM will segregate the clients based on the criteria of the regulator and its bylaws. NCM does not provide any advisory service; the material published does not constitute advice or a recommendation for a transaction in any financial instrument. NCM accepts no responsibility for any use of the content presented and any consequences of that use. Anyone acting on the information provided does so at their own risk.