
- Contact Us:
-

-

-

-


Daily Market Updates
30 Mar 2023
USDJPY
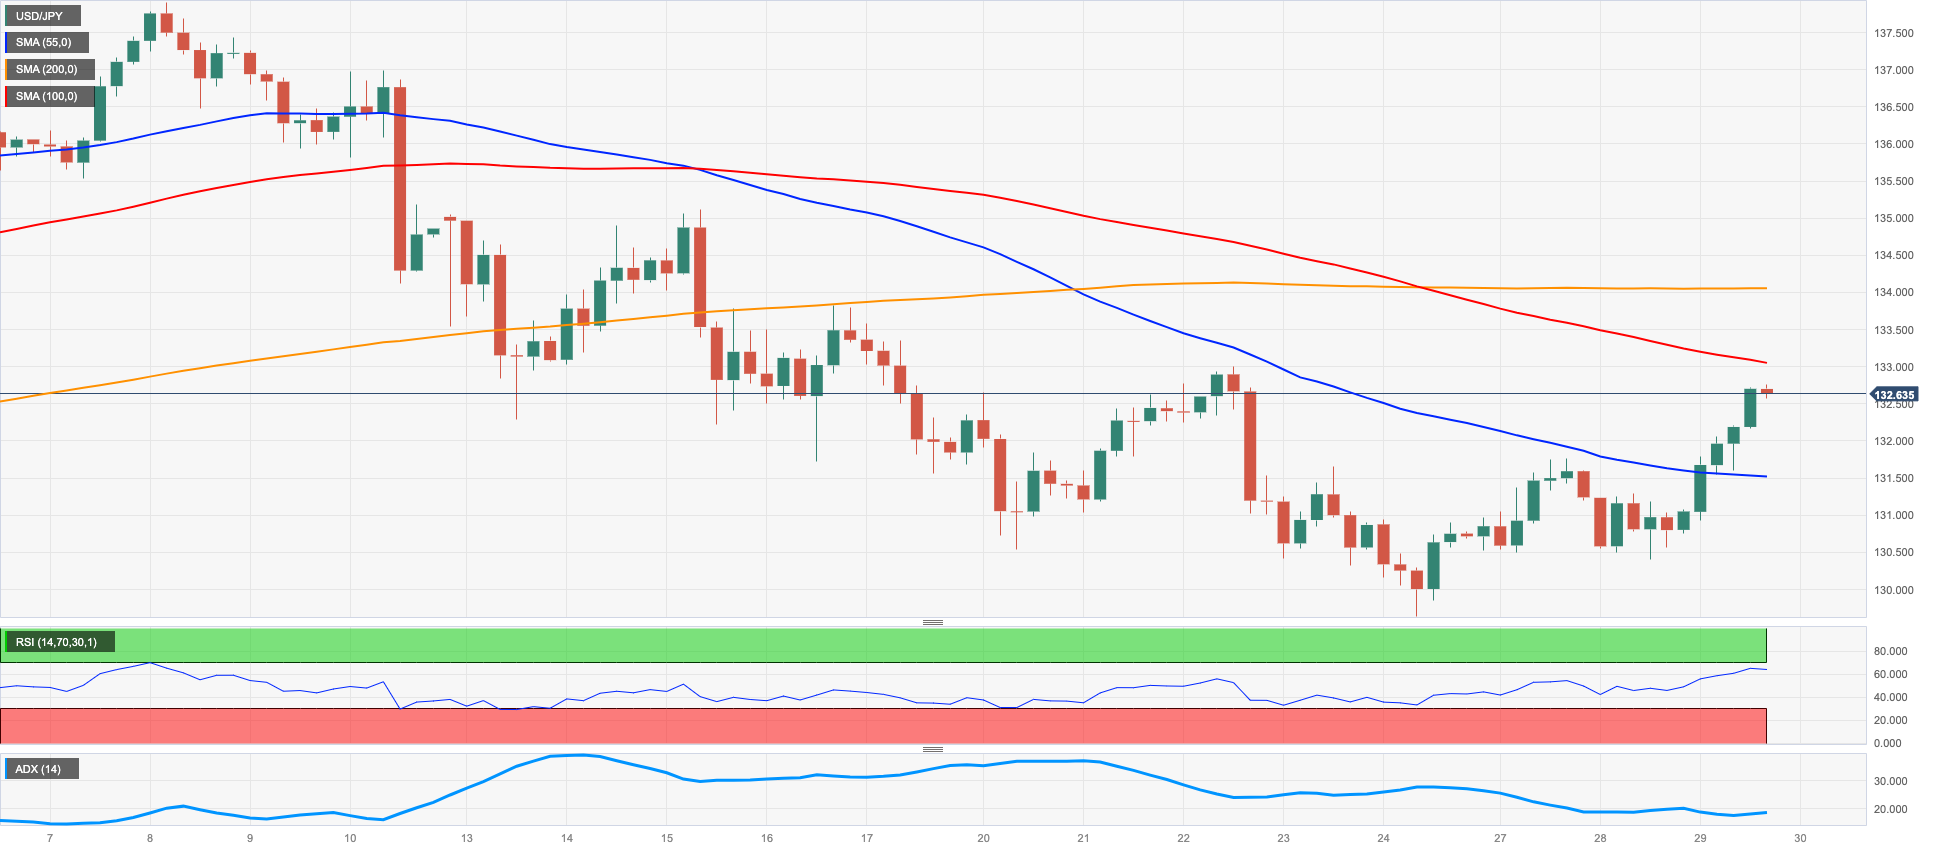
USD/JPY rose markedly over 1% and clinched new multi-day highs well past the 132.00 barrier on Wednesday. Spot, at the same time, managed to flirt with the temporary 55-day SMA (132.38).
The strong rebound in the greenback lent legs to the pair despite US yields slightly trimmed part of the recent move higher across the curve.
From the BoJ, Governor Kuroda said that large-scale easing has boosted the economy and prices, while Deputy Governor Uchida added that the bank could lose ¥50T on its balance sheet if the 10-year yields climb to 2%.
There were no data releases in the Japanese calendar on Wednesday.
The acute daily uptick now prompts USD/JPY to challenge the weekly high at 133.00 (March 22) ahead of the provisional 100-day SMA at 134.133.99. Further up appears the key 200-day SMA at 137.32 seconded by the 2023 peak at 137.91 (March 8). In opposition, bears should keep the focus on the March low at 129.63 (March 24). Once cleared, the pair could then dispute the February low at 128.08 (February 2) prior to the 2023 low at 127.21 (January 16). The daily RSI gathered pace and leapt past 48.
Resistance levels: 132.76 133.00 133.98 (4H chart)
Support levels: 129.63 128.08 127.21 (4H chart)
GBPUSD
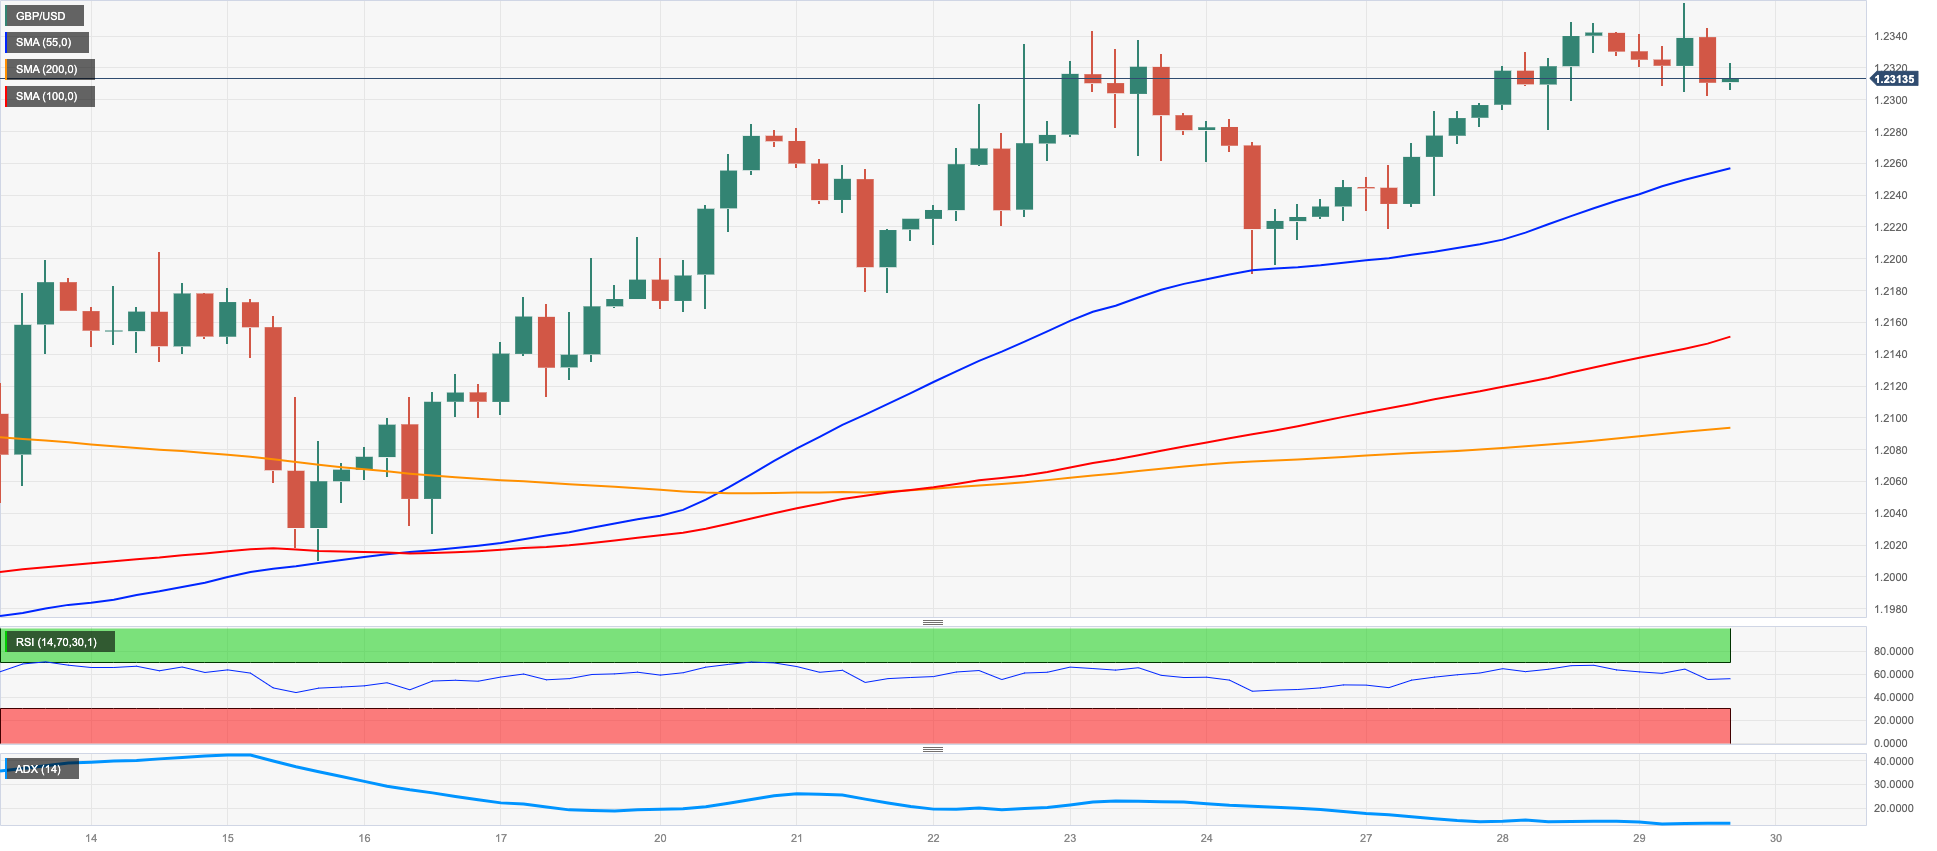
GBP/USD succumbed to the bounce in the buck and set aside two consecutive daily gains on Wednesday, although it managed well to maintain business above the key 1.2300 hurdle.
Once again, the firm performance around the greenback allowed the resumption of some weakness in the risk complex and put the monthly rally in the Sterling to the test midweek.
On another note, the BoE published its Financial Policy Summary and Record and noted that UK businesses are resilient to higher debt costs, while less households face stress than thought by the end of 2022. In addition, the BoE said that UK banks have large liquid assets buffers and added that there is a pressing need to boos resilience in investment funds.
In addition, Chancellor J.Hunt noted that core inflation is expected to be harder to tame, while he disregarded the idea that central banks might be overacting to inflation pressures
In the UK, Mortgage Approvals surprised to the upside and rose by 43.54K in February and Mortgage Lending shrank to £0.74B in the same period.
Considering the recent price action, GBP/USD now targets the 2023 high at 1.2447 (January 23) ahead of the May 2022 top at 1.2666 (May 27). North from here, Cable could embark on a potential test of the 200-week SMA at 1.2869 prior to the psychological 1.3000 yardstick. Having said that, there are provisional support levels at the 55- and 100-day SMAs at 1.2158 and 1.2116, respectively, followed by the weekly low at 1.2010 (March 15) and the key 200-day SMA at 1.1892. A drop below this level exposes the 2023 low at 1.1802 (March 8) ahead of the November 2022 low at 1.1142 (November 4). The daily RSI retreated to the sub-60 zone.
Resistance levels: 1.2358 1.2401 1.2447 (4H chart)
Support levels: 1.2245 1.2189 1.2091 (4H chart)
AUDUSD
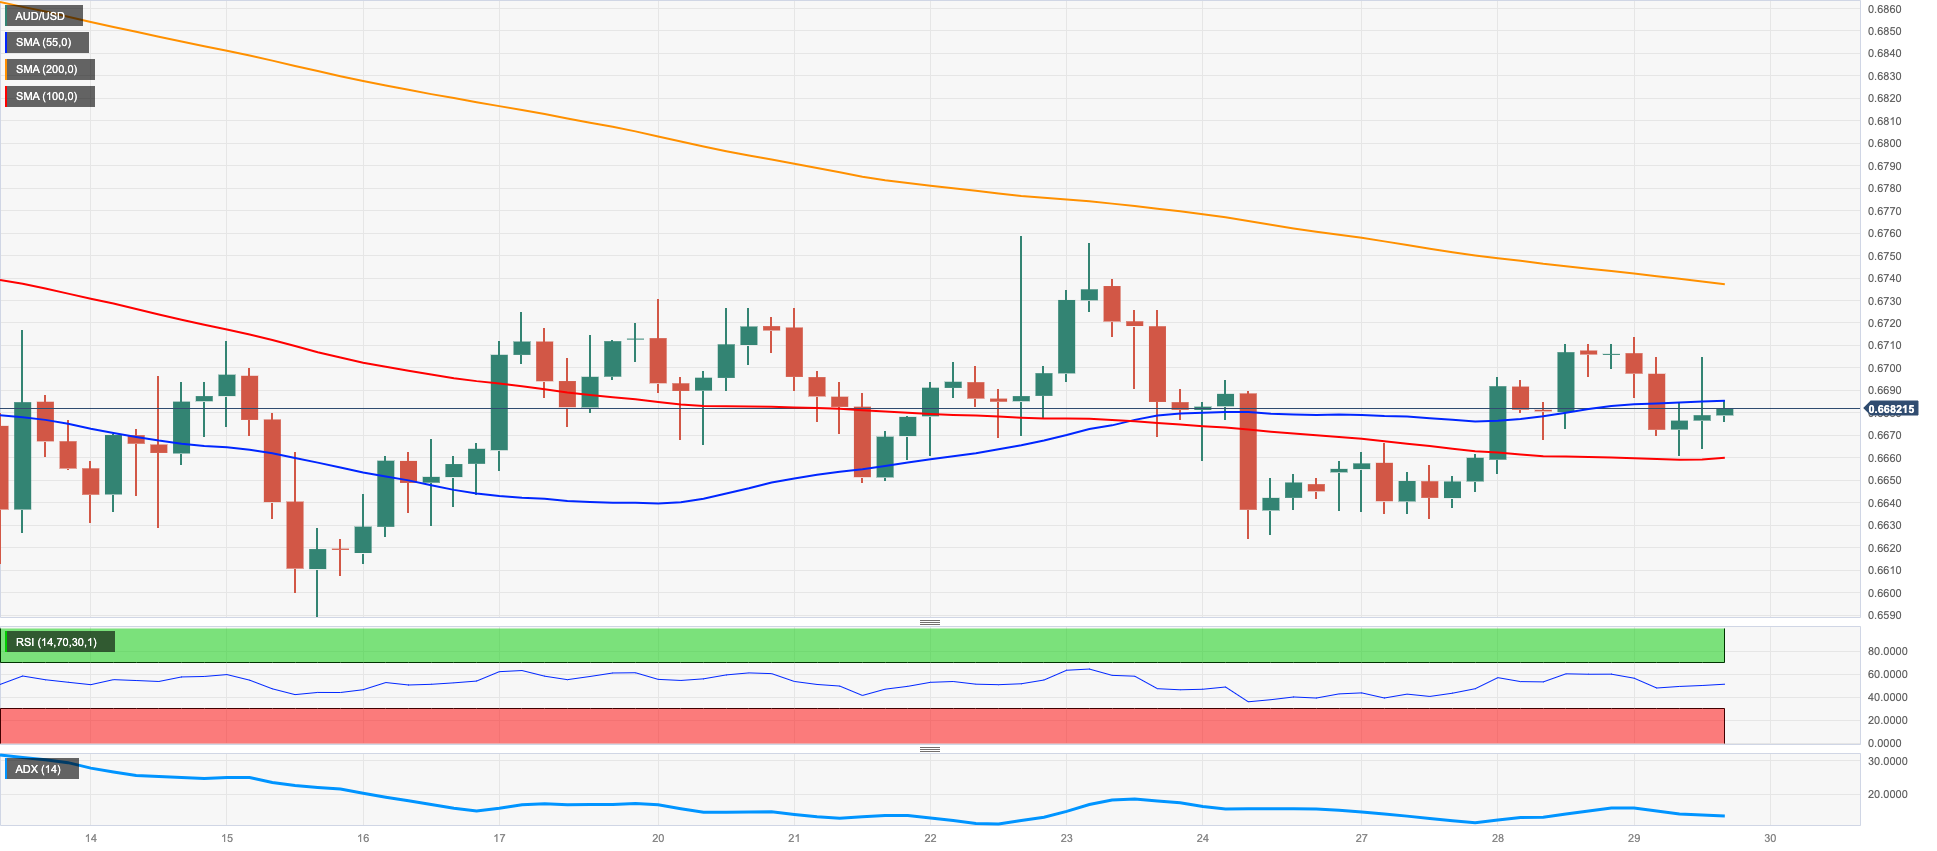
The moderate recovery in the greenback weighed on the risk-associated universe and sponsored a decent knee-jerk in AUD/USD to the 0.6665/60 band on Wednesday, where some decent support turned up.
In fact, the Aussie dollar managed to reverse the initial pessimism following lower-than-expected inflation figures in the Australian economy, which seem to have underpinned opinions that the RBA could refrain from acting on rates at its next event on April 4.
On the latter, the Monthly CPI Indicator rose 6.8% in February, down from January’s 7.4%.
Collaborating with the poor activity around the pair emerged the irresolute note in the commodity space, where copper prices dropped marginally and the iron ore remained within some consolidation range.
Immediately to the upside in AUD/USD aligns the key 200-day SMA at 0.6752 closely followed by the weekly high at 0.6758 (March 22). The surpass of the latter exposes a potential move to the March top at 0.6783 (March 1) prior to provisional up-barriers at the 100- and 55-day SMAs at 0.6797 and 0.6839, respectively. Extra gains are expected to revisit the key round level at 0.7000 before the weekly peak at 0.7029 (February 14). On the flip side, the next support of importance is not seen before the 2023 low at 0.6563 (March 10) followed by the weekly low at 0.6386 (November 10 2022) and the November 2022 low at 0.6272 (November 3). The daily RSI grinded lower to the sub-47 area.
Resistance levels: 0.6713 0.6758 0.6783 (4H chart)
Support levels: 0.6625 0.6589 0.6563 (4H chart)
GOLD
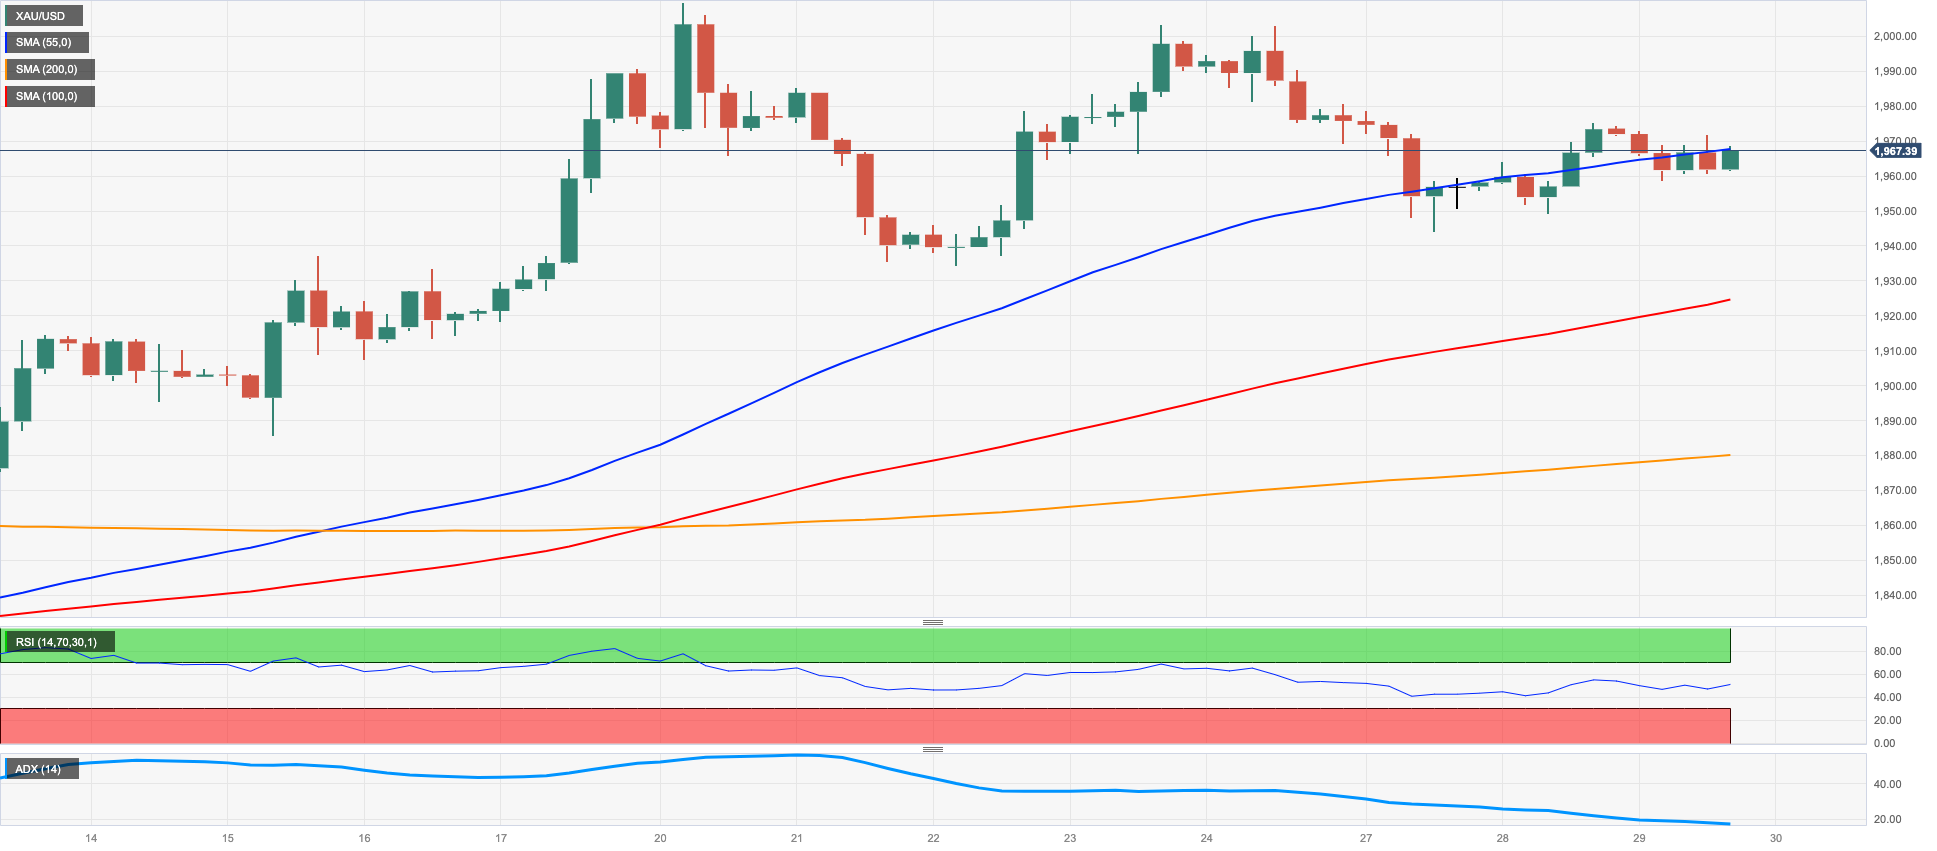
Gold prices partially reversed Tuesday’s uptick and some selling pressure dragged it back to the $1960 region per ounce troy on Wednesday.
The firm tone in the dollar reignited the selling interest around the precious metal along with diminishing banking concerns, while the mixed/bearish mood surrounding US yields also seem to have limited the downside in bullion midweek.
The next risk event for the yellow metal emerges at the publication of US inflation figures for the month of February, this time tracked by the PCE, and due on Friday. In addition, gold continues to track developments around the next FOMC event in May, where speculation around a potential pause of the hiking cycle remains on the rise.
There are no changes to the topside in gold, as the immediate hurdle is still at the 2023 high at $2009 (March 20) before the 2022 top at $2070 (March 8) and the all-time peak at $2075 (August 7 2020). Just the opposite, there is a minor support at the weekly low at $1934 (March 22) followed by interim contention levels at the 55- and 100-day SMAs at $1892 and $1846, respectively. The breakdown of this region exposes a deeper drop to the March low at $1809 (March 8) seconded by the 2023 low at $1804 (February 28) and the key 200-day SMA at $1782.
Resistance levels: $1975 $2009 $2070 (4H chart)
Support levels: $1944 $1934 $1885 (4H chart)
CRUDE WTI
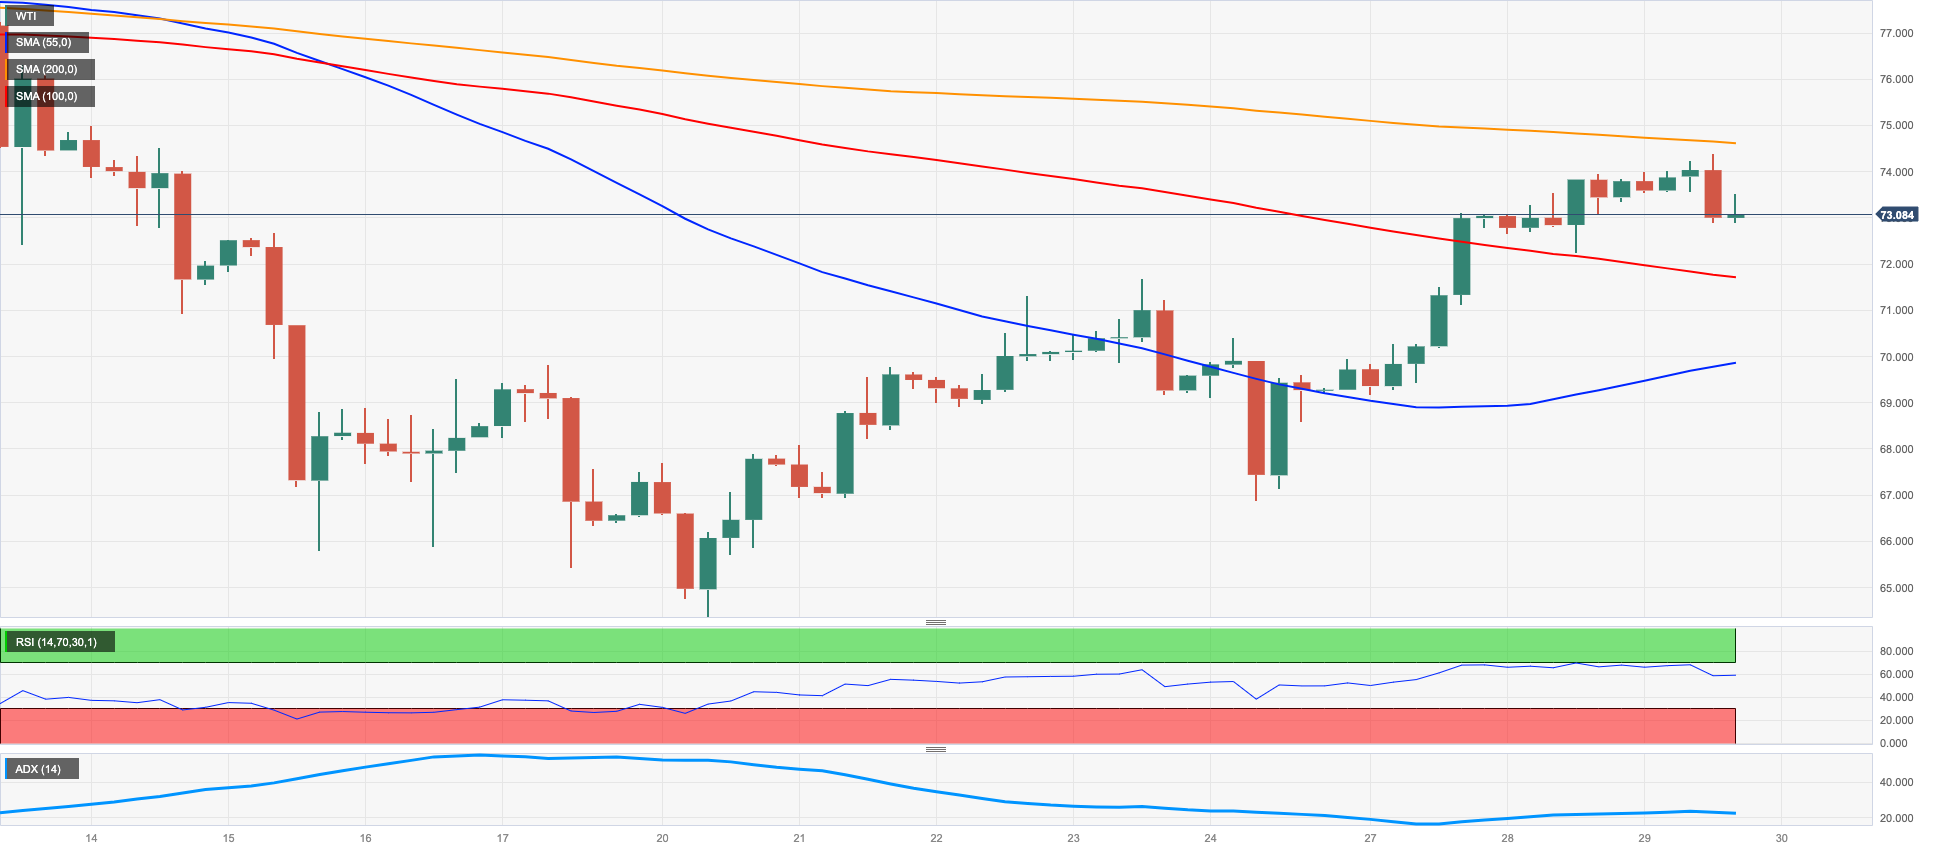
Renewed supply concerns continued to bolster the upbeat mood among traders, as Iraqi exports of crude oil from the Kurdistan region remain halted since Saturday. Crude oil prices managed to surpass the $74.00 to print new 2-week highs, although the move fizzled out afterwards and let some weakness return to the market.
Also bolstering the move to fresh tops past the $74.00 mark per barrel of the WTI appeared alleviated banking jitters, which in turn morphed into extra support for the risk-linked galaxy.
Finally, a larger-than-expected weekly drop in US crude oil supplies also lent initial wings to the commodity on Wednesday. On this, and per the latest EIA report, US crude oil inventories shrank by 7.489M barrels in the week to March 24, while supplies at Cushing dropped by 1.632m barrels, Weekly Distillate Stocks rose 0.281M barrels and gasoline stockpiles went down by 2.904M barrels.
The WTI recorded a new March top at $74.32 (March 29). The surpass of this level could open the door to a test of the interim 55- and 100-day SMAs at $76.20 and $77.25 respectively, prior to the March high at $80.90 (March 7) and the 2023 top at $82.60 (January 23). The other way around, the 2023 low at $64.41 (March 20) remains the big magnet for crude oil bears ahead of the December 2021 low at $62.46 (December 2) and the August 2021 low at $61.76 (August 23). Down from here emerges the key $60.00 mark per barrel.
Resistance levels: $74.32 $78.01 $80.90 (4H chart)
Support levels: $72.16 $69.75 $66.79 (4H chart)
GER40
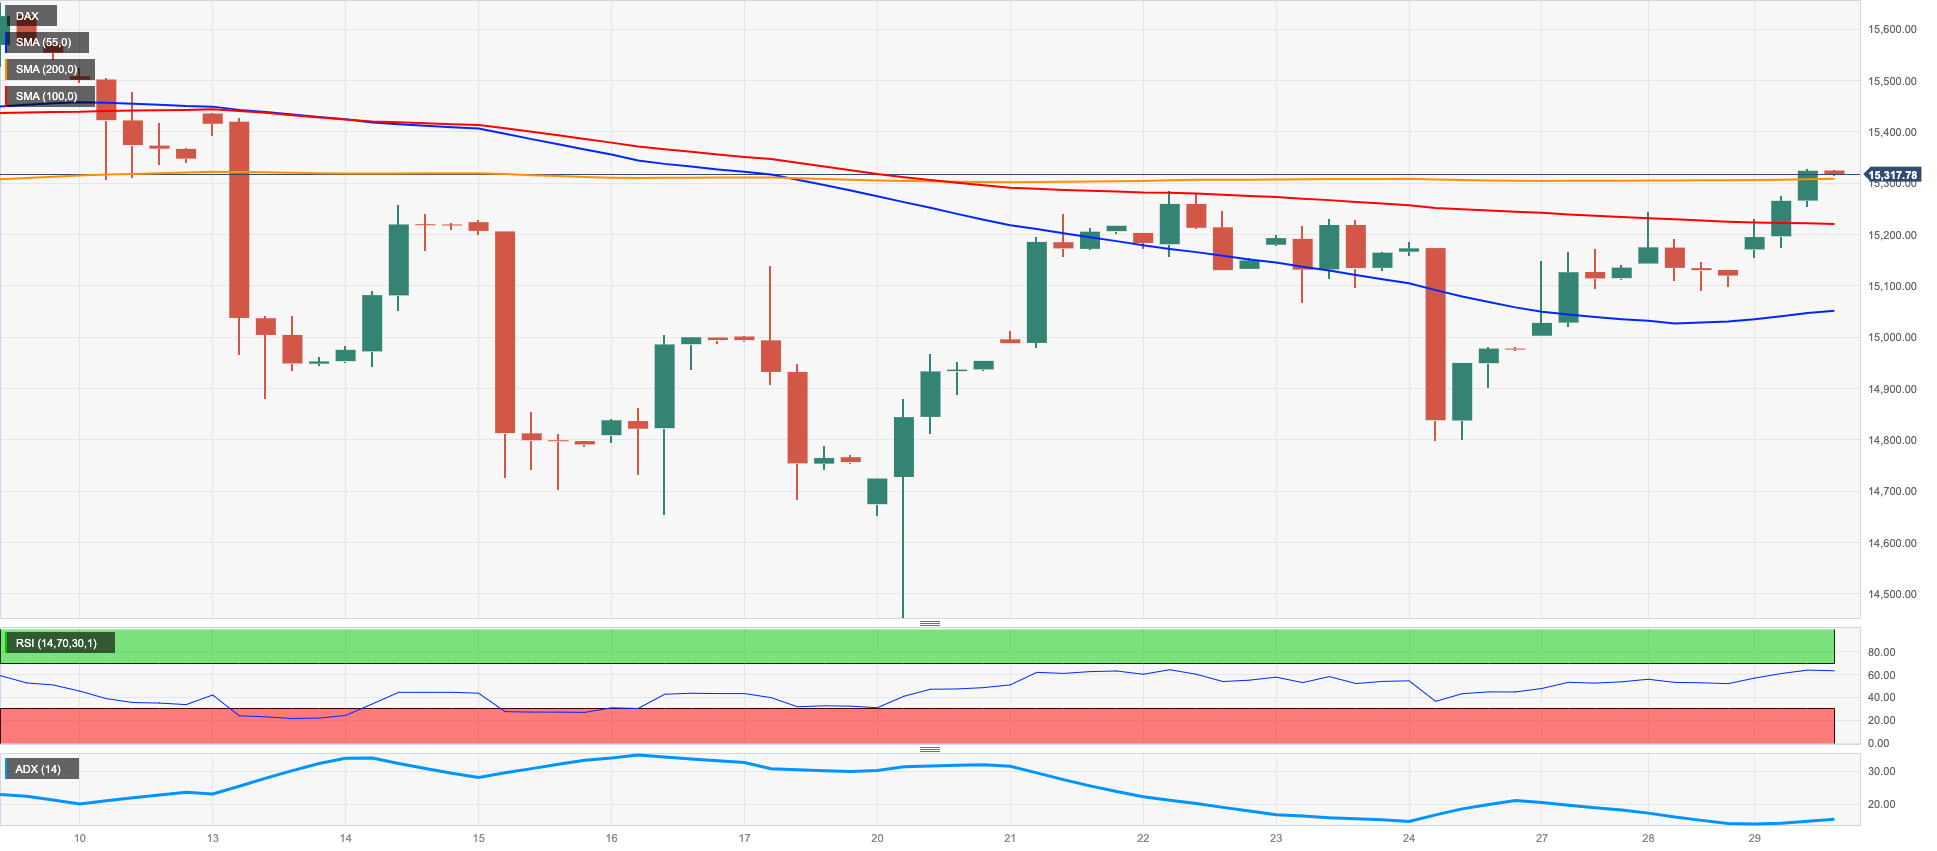
German equities gauged by the DAX40 advanced to 2-week highs past the 15300 region on Wednesday, adding to the weekly bounce and re-shifting the attention to the 2023 top around 15700 recorded earlier in the month.
Indeed, German equities rose in line with their European peers propped up by the renewed optimism among market participants, mainly on the back of easing concerns surrounding the banking sector.
The third uptick in a row in the index came in tandem with extra gains in the German 10-year Bund yields, this time approaching the 2.35% region.
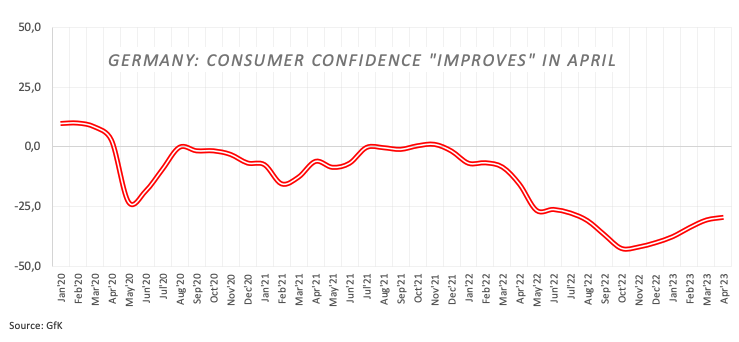
In Germany, Consumer Confidence measured by GfK improved a tad to -29.5 in April (from -30.6) in what was the sole release in the daily calendar.
Further recovery in the DAX40 could confront the 2023 peak at 15706 (March 6) closely followed by the February 2022 high at 15736 (February 2 2022). Up from here emerges the round level at 16000 prior to the 2022 top at 16285 (January 5). By contrast, the minor support at 14809 (March 24) appears reinforced by the provisional 100-day SMA (14823) and comes ahead of the March low at 14458 (March 20) and the key 200-day SMA at 13907. The loss of the latter could put the December 2022 low at 13791 (December 13) to the test. The daily RSI advanced north of the 53 region.
Best Performers: Infineon, Vonovia, Adidas
Worst Performers: Daimler, Siemens Healthineers, Daimler Truck Holding
Resistance levels: 15298 15495 15706 (4H chart)
Support levels: 15079 14809 14458 (4H chart)
NASDAQ
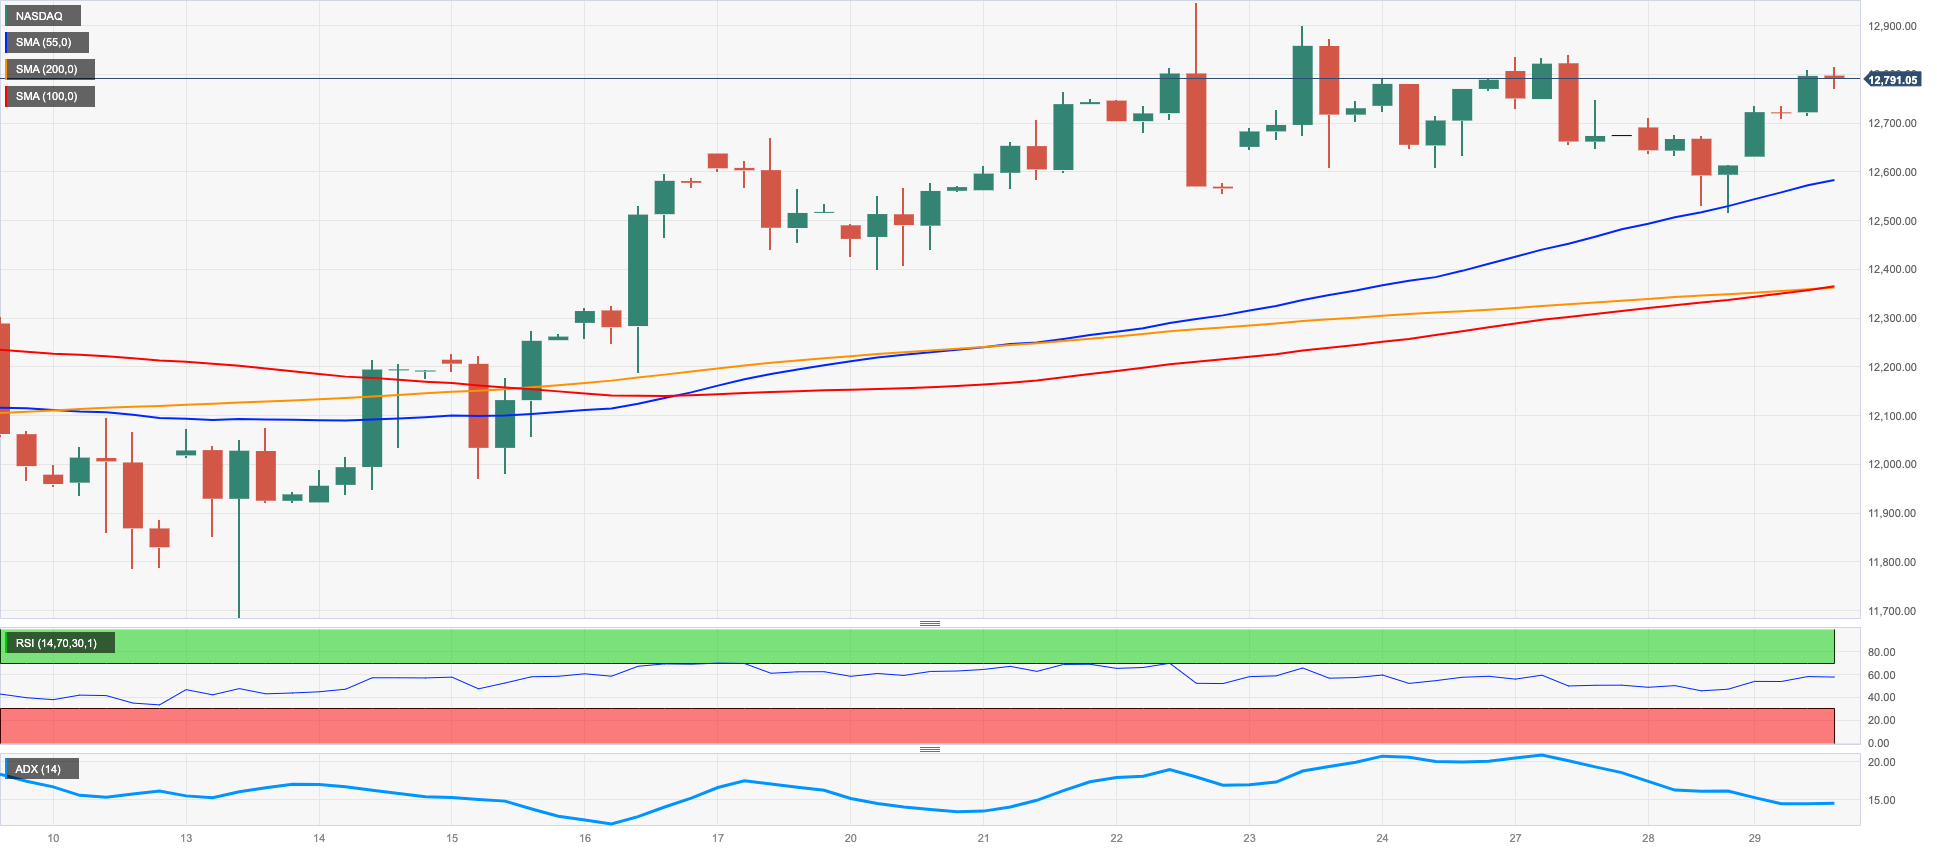
The tech reference Nasdaq 100 rose sharply and flirted once again with the 12800 region on Wednesday.
The mixed performance of US yields in combination with easing banking worries helped the index leave behind two consecutive daily pullbacks and refocus on the upside, in line with the rest of its US peers.
The Nasdaq now seems to look at another test of the 2023 top at 12943 (March 22) prior to the round level at 13000 and ahead of the weekly peak at 13175 (August 26 2022). Oppositely, there is initial contention at the interim 55-day SMA at 12182 prior to the key 200-day SMA at 11911 and the March low at 11695 (March 13). The breach of this region could prompt weekly lows at 11550 (January 25) and 11251 (January 19) to emerge on the horizon ahead of the 2023 low at 10696 (January 6) and the December 2022 low at 10671 (December 22). The daily RSI regained balance and moved past 61.
Top Gainers: Lululemon Athletica, Rivian Automotive, Micron
Top Losers: Ross Stores, Regeneron Pharma, JD.com Inc Adr
Resistance levels: 12943 13175 13720 (4H chart)
Support levels: 12407 11797 11695 (4H chart)
DOW JONES
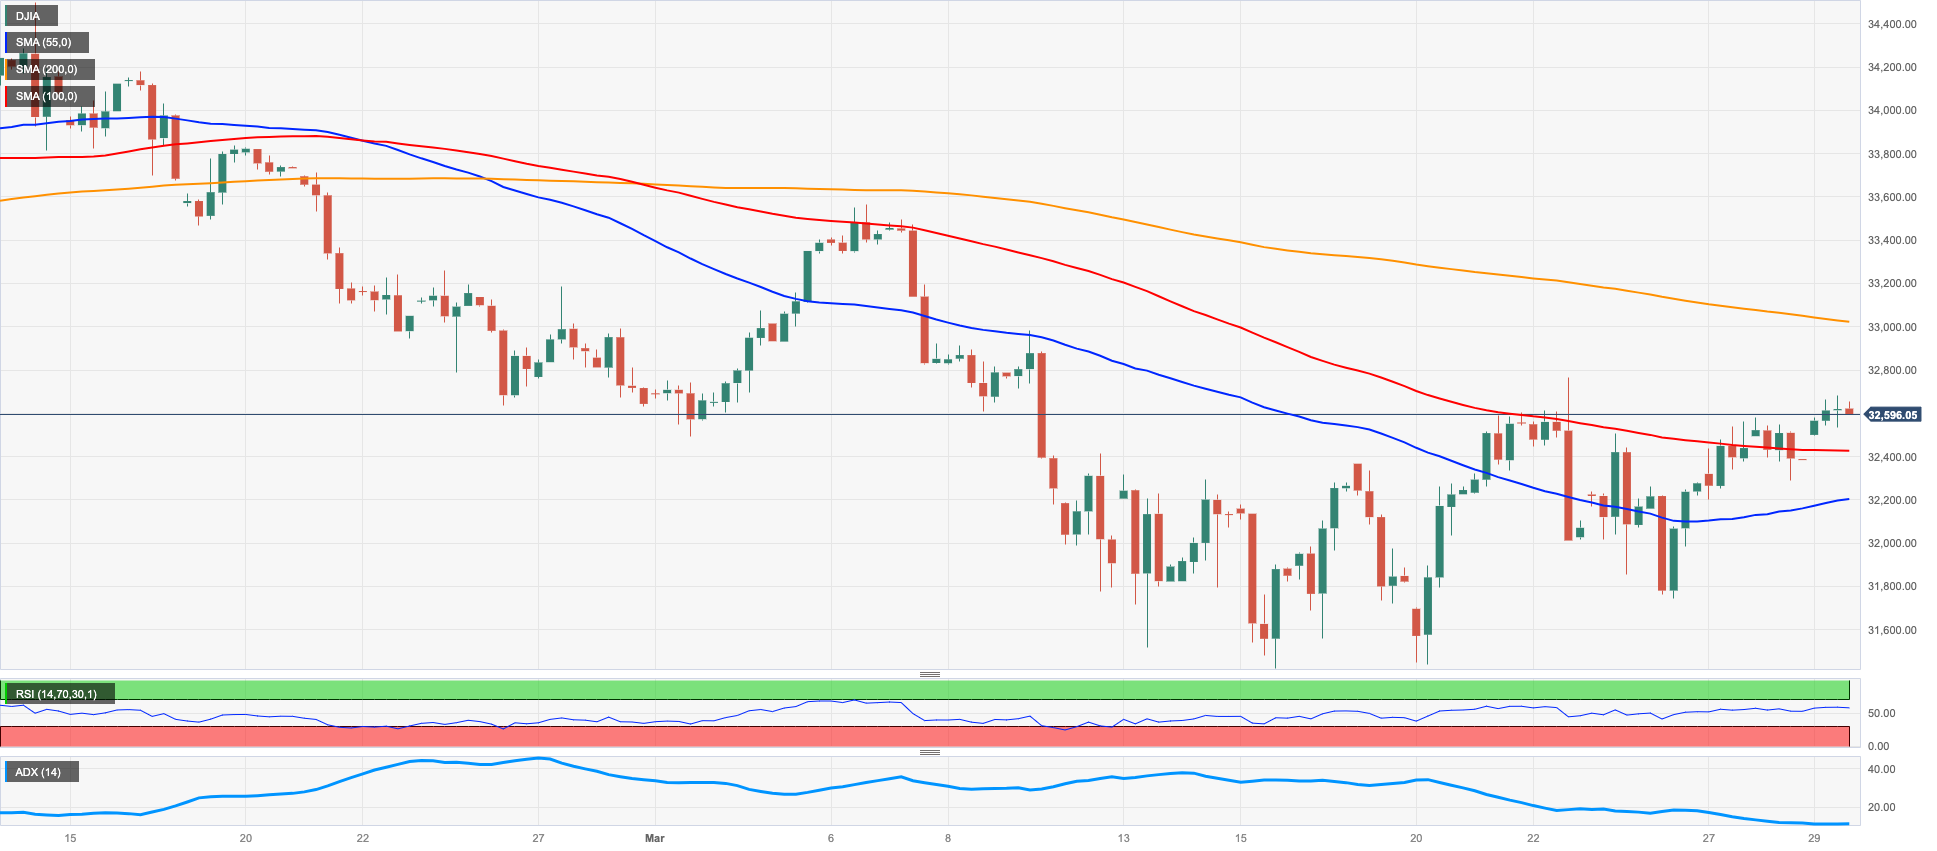
Stocks measured by the US benchmark Dow Jones left behind Tuesday’s small downtick and resumed the weekly upside on the back of diminishing concerns around the US and European banking systems.
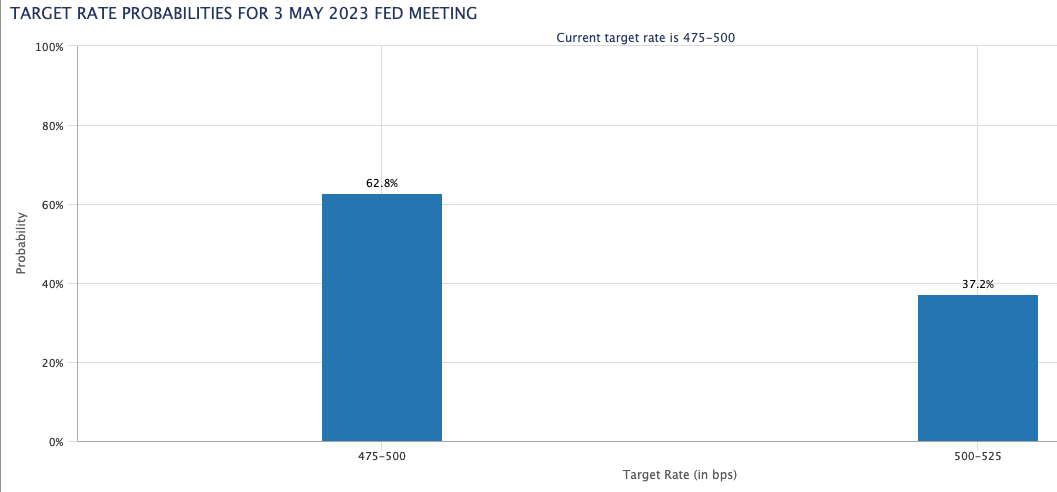
In addition, expectations of a potential impasse at the next FOMC event in May also boosted the appetite for the risk-associated assets on Wednesday. On this, CME Group’s FedWatch Tool sees the probability of the Fed leaving the interest rate unchanged at around 60% (vs. nearly 40% of a 25 bps rate hike).
All in all, the Dow Jones advanced 0.59% to 32584, the S&P500 gained 1.02% to 4012 and the tech-heavy Nasdaq Composite rose 1.36% to 11875.
Next on the upside for the Dow Jones emerges the weekly high at 32761 (March 23) before the March peak at 33572 (March 6) and the 2023 high at 34342 (January 13). Once the latter is cleared, the index could then challenge the December 2022 top at 34712 (December 13) followed by the April 2022 peak at 35492 (April 21). On the opposite side, the loss of the 200-day SMA at 32362 could pave the way for a move to the 2023 low at 31429 (March 15) prior to the 30000 mark and seconded by the 2022 low at 28660 (October 13). The daily RSI gathered pace and trespassed the 50 mark.
Top Performers: Intel, American Express, Travelers
Worst Performers: UnitedHealth, Merck&Co, IBM
Resistance levels: 32761 33308 33572 (4H chart)
Support levels: 31805 31429 28660 (4H chart)
MACROECONOMIC EVENTS

All Information & Updates provided by:

All information relating to the financial markets available on this page has been prepared and issued by FXStreet (Forexstreet SL, Spain, Reg: B62498233) on the basis of publicly available information and all information believed to be reliable and does not conflict with Kuwaiti local laws, and all necessary care has been taken to before the company to ensure that the facts mentioned are correct from the source.
NCM Investment nor any of its directors or employees shall in any way be held responsible for the contents of this news, and the information contained on this page is intended only to provide clients with publicly available information and should not be construed as investment advice, report or analysis and/or constitute an offer or invitation to buy or sell financial instruments of any kind.
RISK WARNING: Forex and CFDs are highly risky leveraged products, as losses can exceed deposits. Please ensure you understand all the risks and take independent advice if necessary. NCM will segregate the clients based on the criteria of the regulator and its bylaws. NCM does not provide any advisory service; the material published does not constitute advice or a recommendation for a transaction in any financial instrument. NCM accepts no responsibility for any use of the content presented and any consequences of that use. Anyone acting on the information provided does so at their own risk.