
- Contact Us:
-

-

-

-


Daily Market Updates
31 Mar 2023
USDJPY
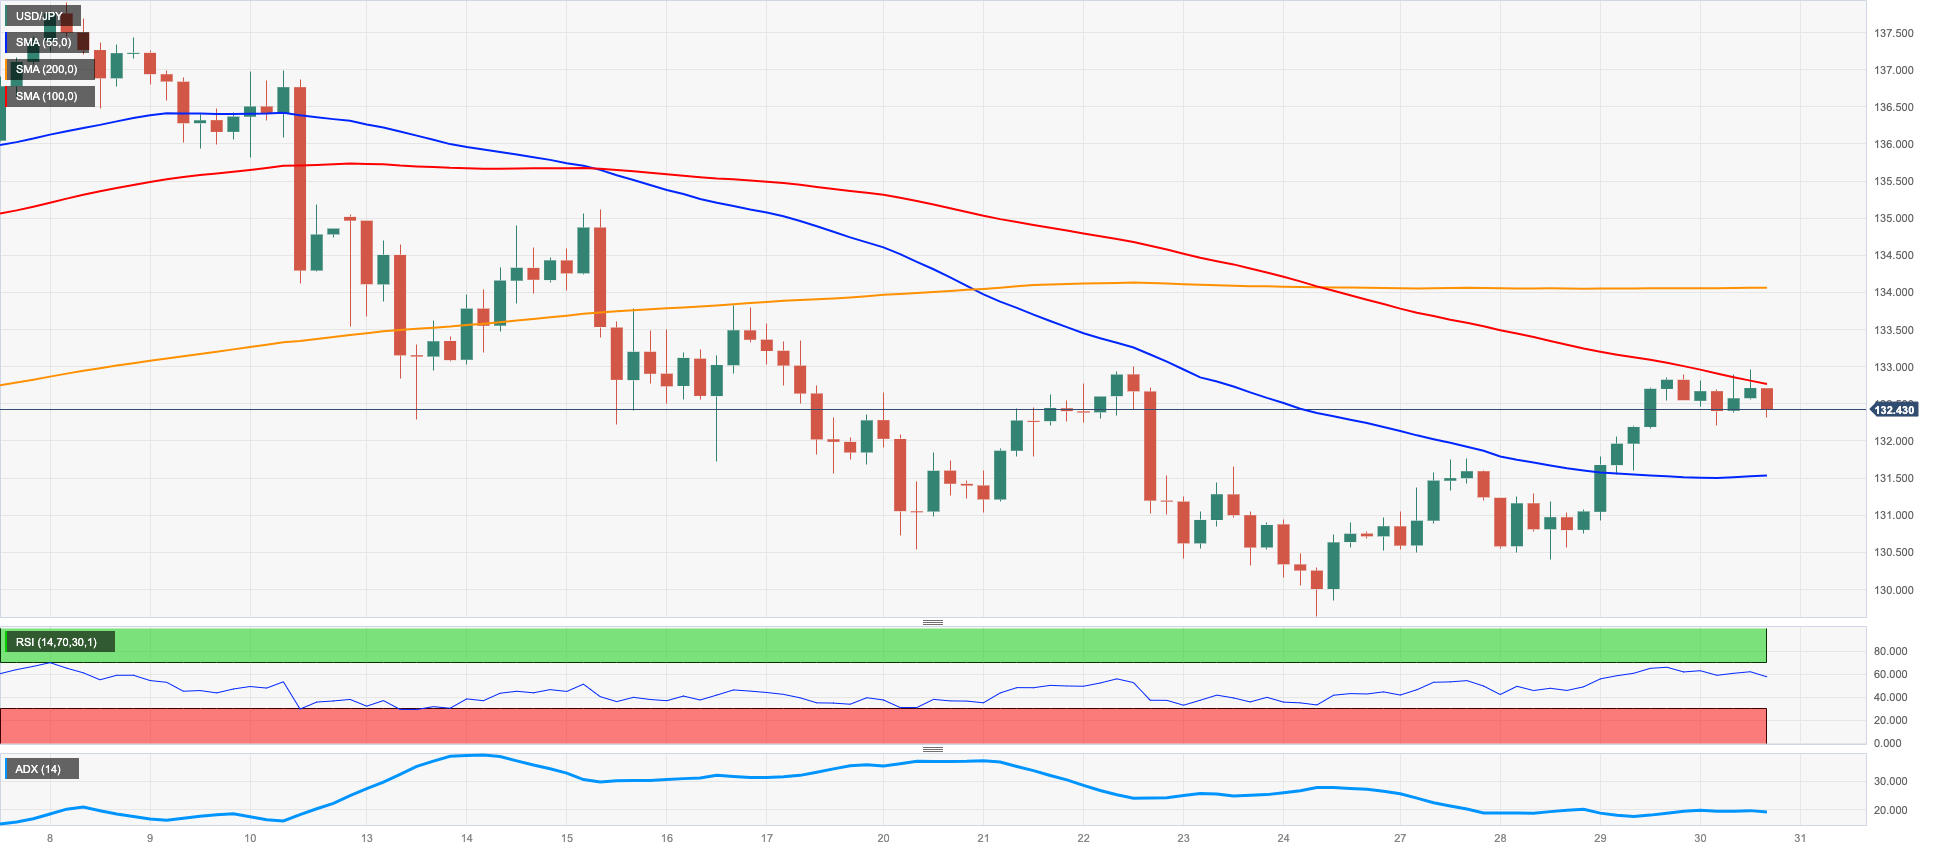
USD/JPY could not sustain Wednesday’s pronounced uptick and instead faltered just pips away from the key 134.00 barrier on Thursday, sparking a decent correction afterwards.
The sharp decline in the greenback in combination with the utter lack of traction in either direction in US yields did not help the pair’s price action, which was equally propped up by further consolidation in the JGB 10-year yields.
In the Japanese docket, Foreign Bond Investment rose ¥1182B in the week to March 25.
USD/JPY recorded a new weekly high at 132.96 on March 30 just ahead of another weekly top at 133.00 (March 22). Further north comes the interim 100-day SMA at 134.92 prior to the key 200-day SMA at 137.31 and the 2023 high at 137.91 (March 8). Having said that, the March low at 129.63 (March 24) still emerges as the immediate contention zone ahead of the February low at 128.08 (February 2) and the 2023 low at 127.21 (January 16). The daily RSI lost composure and breached the 48 mark.
Resistance levels: 132.96 133.82 134.01 (4H chart)
Support levels: 131.57 130.40 129.63 (4H chart)
GBPUSD
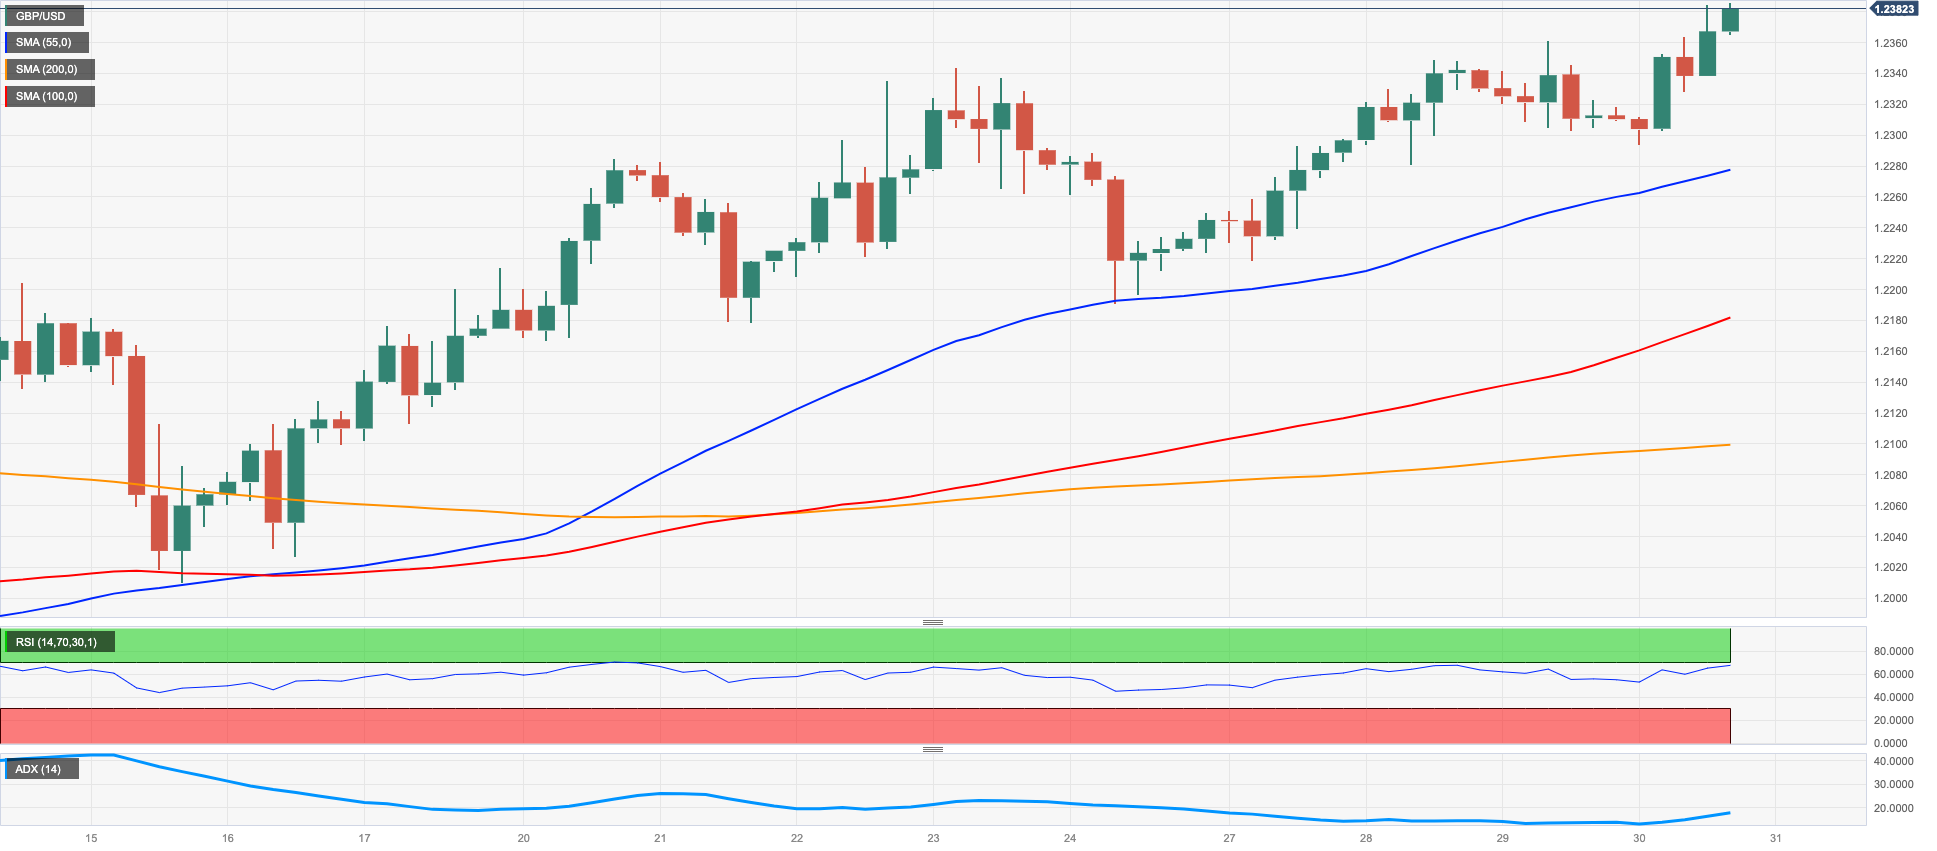
The intense selling interest dragged the greenback further south and forced the USD Index (DXY) to retest the proximity of the 102.00, all morphing into extra support for the risk-linked galaxy on Thursday.
That said, GBP/USD gathered extra steam and rose to multi-week highs to the vicinity of 1.2400 the figure, extending at the same time the monthly recovery for the third week in a row.
Data wise in the UK, the only release saw Car Production expand 13.1% in the year to February.
Further upside in GBP/USD could put a probable test of the 2023 top at 1.2447 (January 23) back on the investors’ radar prior to the May 2022 peak at 1.2666 (May 27). Further up emerges the 200-week SMA at 1.2870, which is considered the last defense of an assault of the psychological 1.3000 mark. On the other hand, the 55- and 100-day SMAs at 1.2160 and 1.2122 are expected to offer temporary contention, respectively, ahead of the weekly low at 1.2010 (March 15) and the key 200-day SMA at 1.1892. The loss of this region could put the 2023 low at 1.1802 (March 8) to the test before the November 2022 low at 1.1142 (November 4). The daily RSI improved past the 62 level.
Resistance levels: 1.2386 1.2401 1.2447 (4H chart)
Support levels: 1.2293 1.2189 1.2100 (4H chart)
AUDUSD
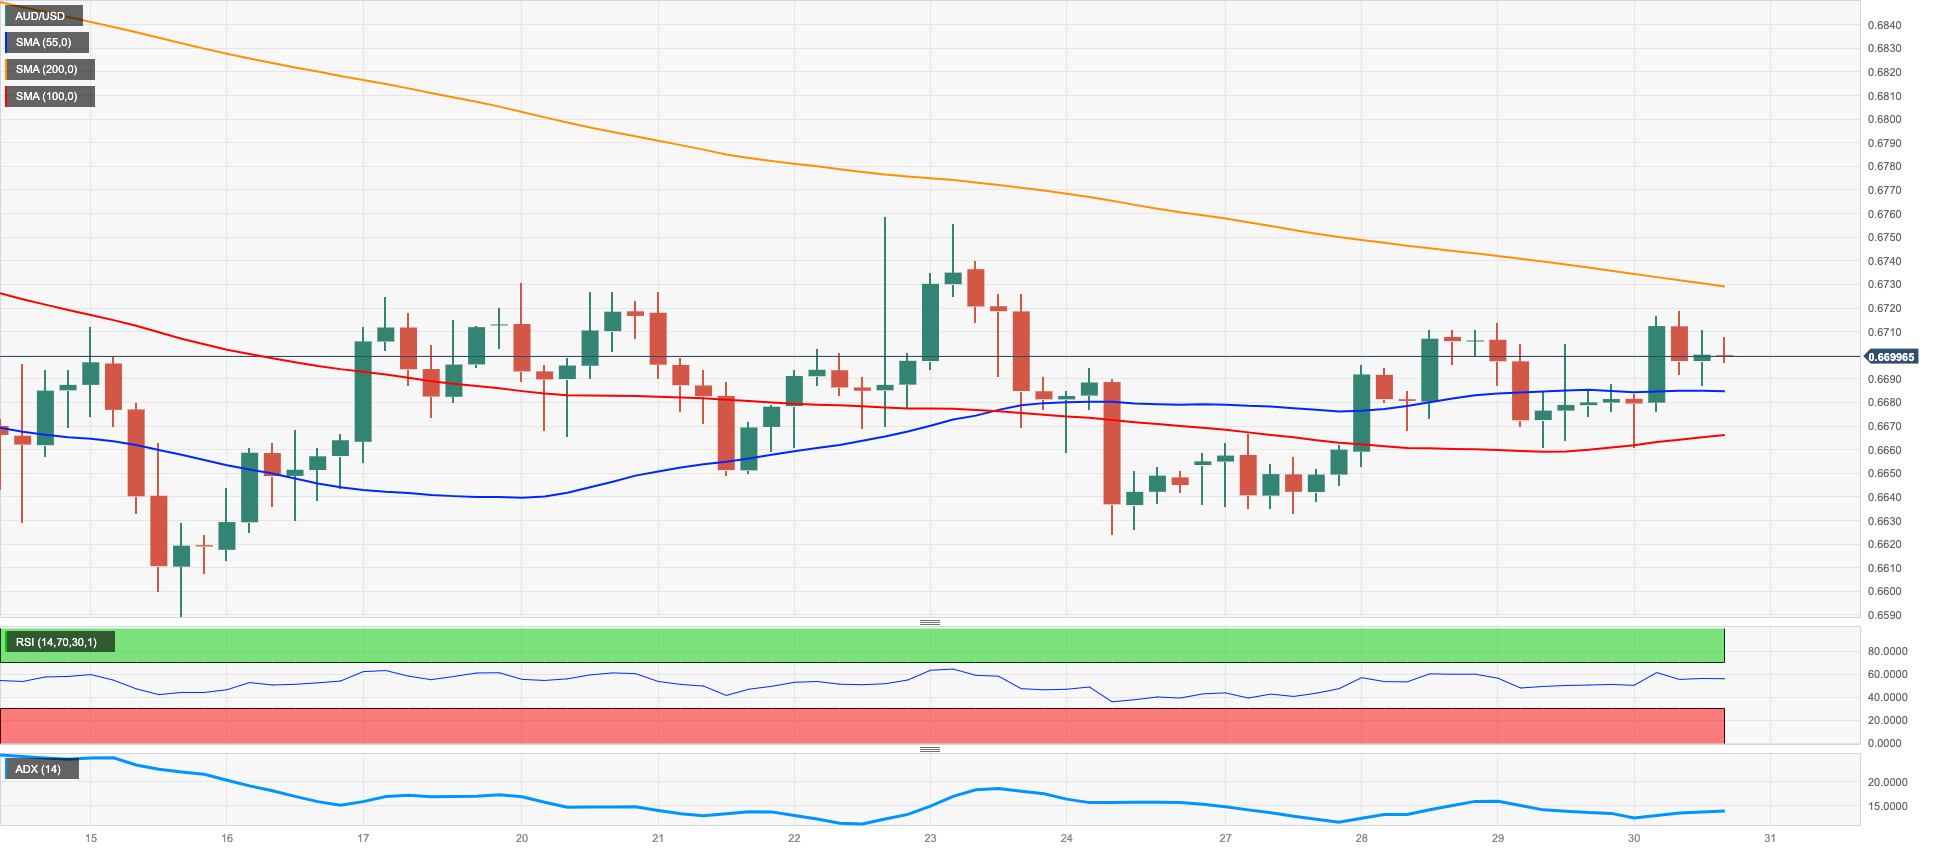
AUD/USD recouped ground lost on Wednesday and advanced north of the 0.6700 barrier on Thursday, briefly printing at the same time new weekly peaks.
The intense drop in the greenback opened the door to further recovery in the Aussie dollar and the rest of its risky peers, although the bearish/flat sentiment in the commodity universe somehow limited the upside potential in spot.
The Australian calendar was empty on Thursday.
AUD/USD seems to be navigating within a consolidative phase. That said, the next up barrier emerges at the key 200-day SMA at 0.6751, which precedes the weekly top at 0.6758 (March 22) and the March peak at 0.6783 (March 1). The surpass of the latter could expose the provisional 100- and 55-day SMAs at 0.6798 and 0.6834, respectively before the key round level at 0.7000 and the weekly high at 0.7029 (February 14). In opposition, there are no support levels of note until the 2023 low at 0.6563 (March 10) prior to the weekly low at 0.6386 (November 10 2022) and the November 2022 low at 0.6272 (November 3). The daily RSI climbed north of the 48 zone.
Resistance levels: 0.6718 0.6753 0.6783 (4H chart)
Support levels: 0.6625 0.6589 0.6563 (4H chart)
GOLD
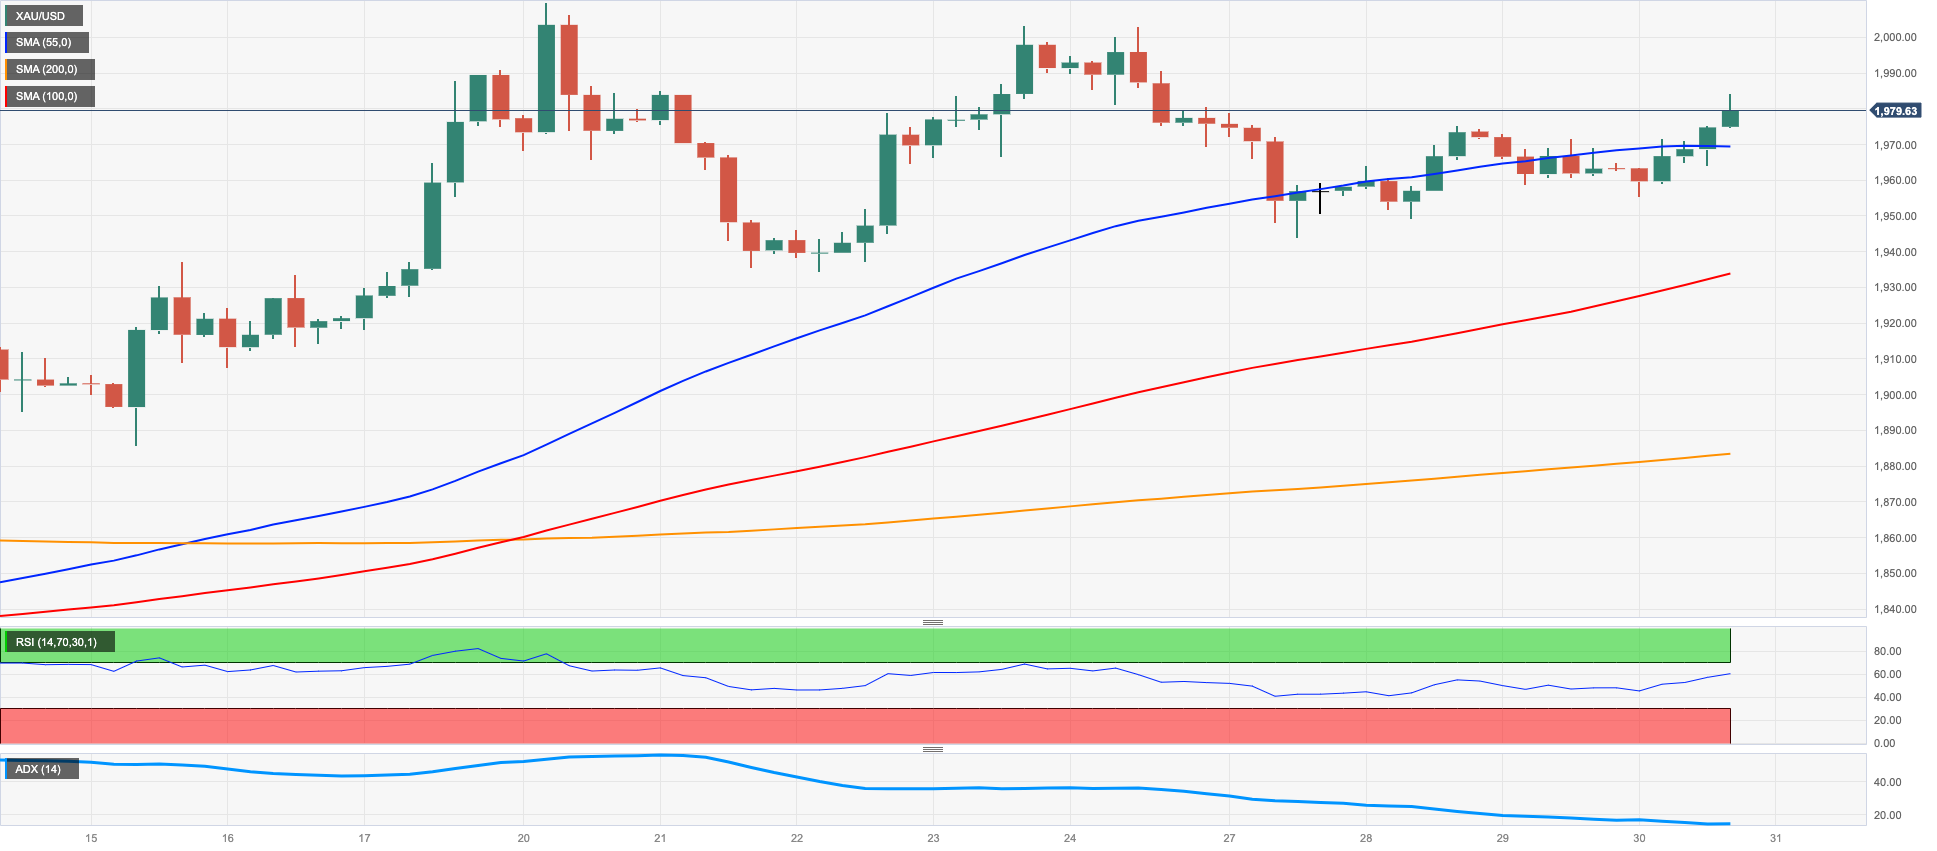
The weaker note in the greenback coupled with the lack of traction in US yields prompted the yellow metal to resume the upside past the $1980 mark per ounce troy on Thursday.
Indeed, bullion reversed Wednesday’s pullback and advanced to weekly peaks also underpinned by rising speculation that the Fed might pause its tightening process as soon as at the May gathering.
So far, and according to CME Group’s FedWatch Tool, the likelihood of that scenario hovers around 55% vs. nearly 45% of chances of another 25 bps rate hike.
In the meantime, the yellow metal is expected to remain cautious ahead of the release of US inflation figures tracked by the PCE on March 31.
Immediately to the upside in gold comes the 2023 top at $2009 (March 20) ahead of the 2022 peak at $2070 (March 8) and the all-time high at $2075 (August 7 2020). On the flip side, there is an initial support at the weekly low at $1934 (March 22) prior to the temporary 55- and 100-day SMAs at $1894 and $1849, respectively. Down from here emerges the March low at $1809 (March 8) ahead of the 2023 low at $1804 (February 28) and the key 200-day SMA at $1783.
Resistance levels: $1984 $2009 $2070 (4H chart)
Support levels: $1944 $1934 $1885 (4H chart)
CRUDE WTI
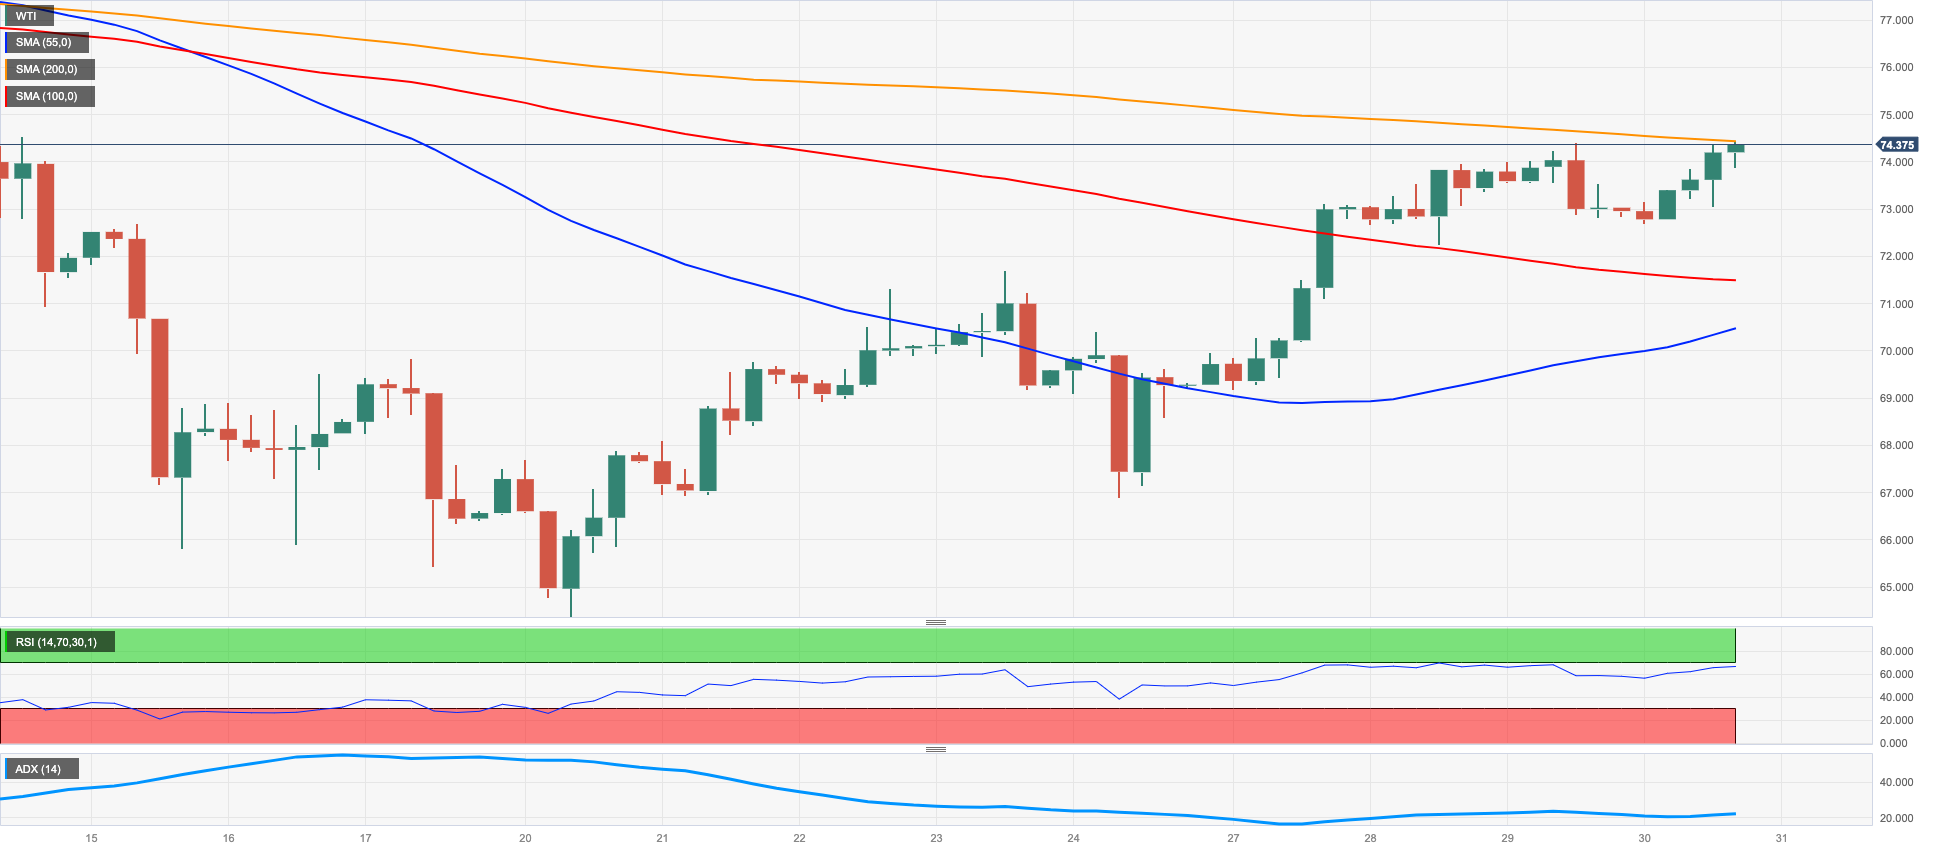
Prices of the barrel of the American benchmark for the sweet light crude oil edged higher and regained the area above the $74.00 mark per barrel on Thursday and remained well in place to close the second consecutive week with gains after bottoming out near the $64.00 mark a couple of weeks ago.
Since the beginning of the week, the better tone in crude oil prices has been underpinned by news citing Iraq halted its exports of crude in the Kurdistan region.
Also collaborating with the firm performance of the commodity emerged the noticeable drop in weekly US crude oil supplies – as per the latest EIA report – as well as the persistent downward bias in the US dollar.
Moving forward, traders expect the OPEC+ to keep the current status quo unchanged at its meeting on April 3.
Once prices of the WTI clear the March peak at $74.35 (March 30), the commodity could then challenge the provisional 55- and 100-day SMAs at $76.12 and $77.10 respectively, seconded by the March top at $80.90 (March 7) and the 2023 peak at $82.60 (January 23). On the contrary, the initial support appears at the 2023 low at $64.41 (March 20) prior to the December 2021 low at $62.46 (December 2). The breach of the latter could open the door to the August 2021 low at $61.76 (August 23) before the key $60.00 mark per barrel.
Resistance levels: $74.49 $78.01 $80.90 (4H chart)
Support levels: $72.16 $70.27 $66.79 (4H chart)
GER40
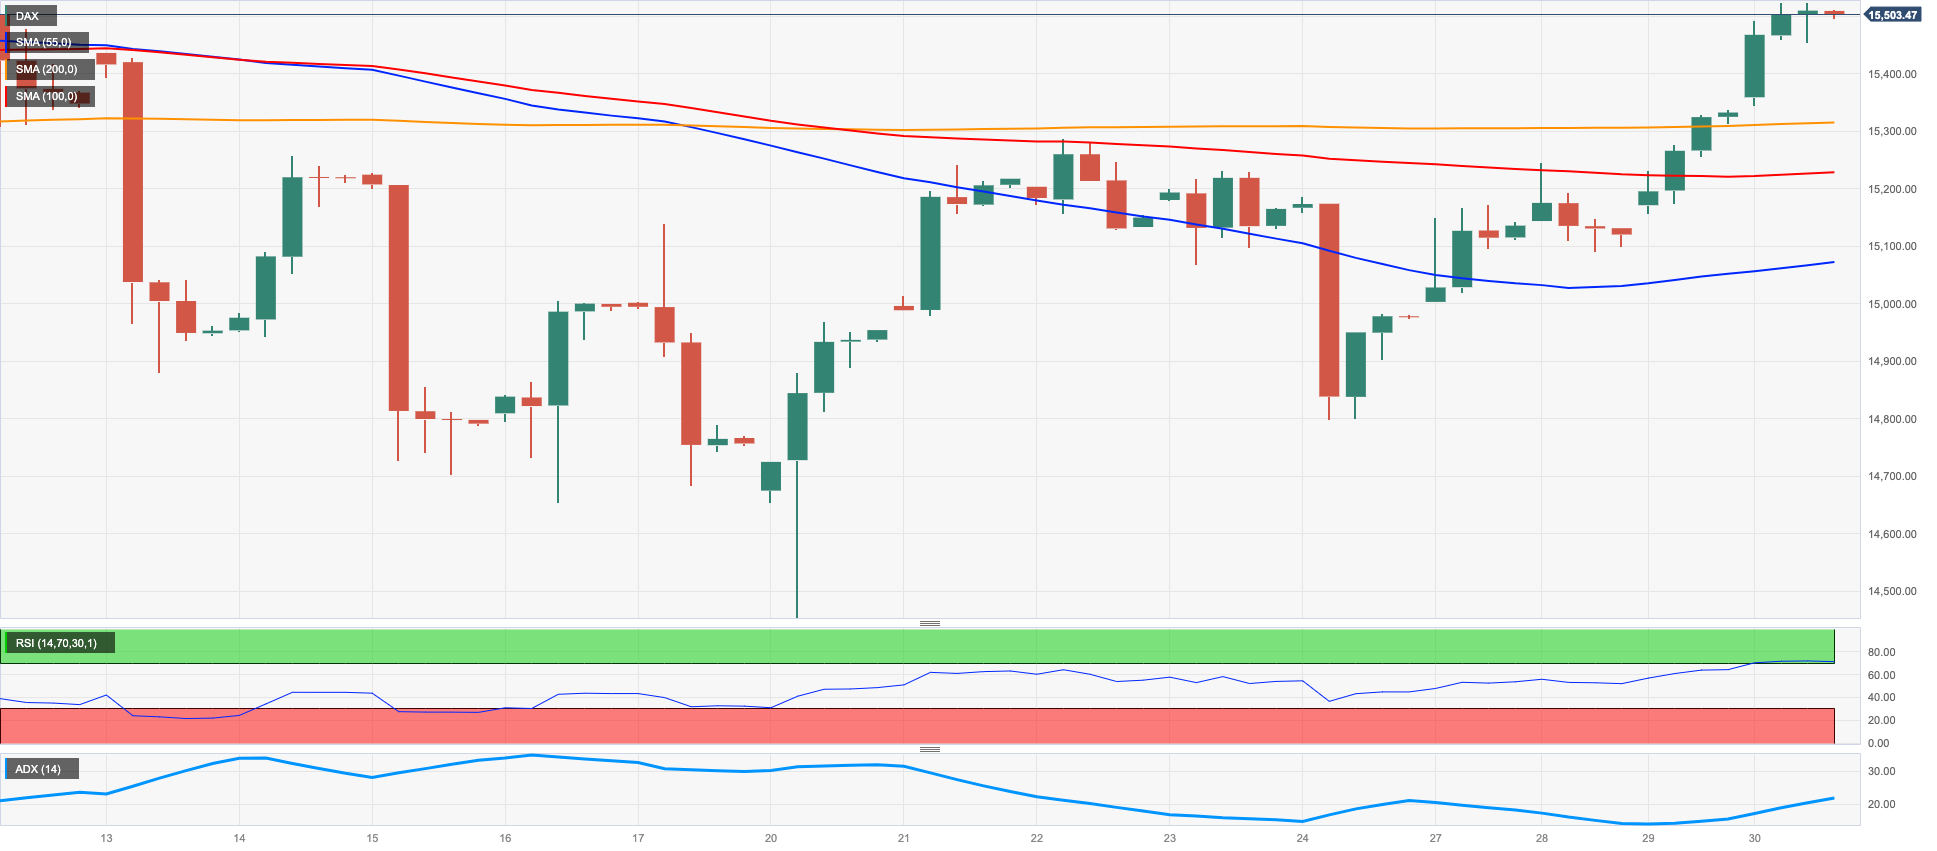
Still diminishing banking concerns propped up another positive session in European stocks on Thursday.
Against that, the German benchmark DAX40 closed at fresh 3-week highs past the 15500 level on Thursday, extending the positive streak to the fourth session.
In Germany, inflation remains sticky after advanced prints now see the CPI rising 7.4% YoY in March and 0.8% vs. the previous month. Despite rising more than expected, consumer prices did lose traction when compared with the February readings.
In the domestic bond market, the 10-year Bund yields edged higher for the fourth session in a row and poked with the 2.40% zone.
The DAX40 is now expected to confront the 2023 high at 15706 (March 6) once the March top at 15536 is cleared. North from here turns up the February 2022 peak at 15736 (February 2 2022) ahead of the round level at 16000 and the 2022 high at 16285 (January 5). On the opposite side, the 100-day SMA at 14842 should offer initial and interim contention before the minor support at 14809 (March 24) and the March low at 14458 (March 20). The breakdown of this level could put the key 200-day SMA at 13919 back on the traders’ radar ahead of the December 2022 low at 13791 (December 13). The daily RSI surpassed the 57 yardstick.
Best Performers: Adidas, Infineon, Zalando SE
Worst Performers: Deutsche Boerse, Symrise AG, Dr Ing hf F Porsche Pfd
Resistance levels: 15536 15706 15736 (4H chart)
Support levels: 15122 14809 14458 (4H chart)
NASDAQ
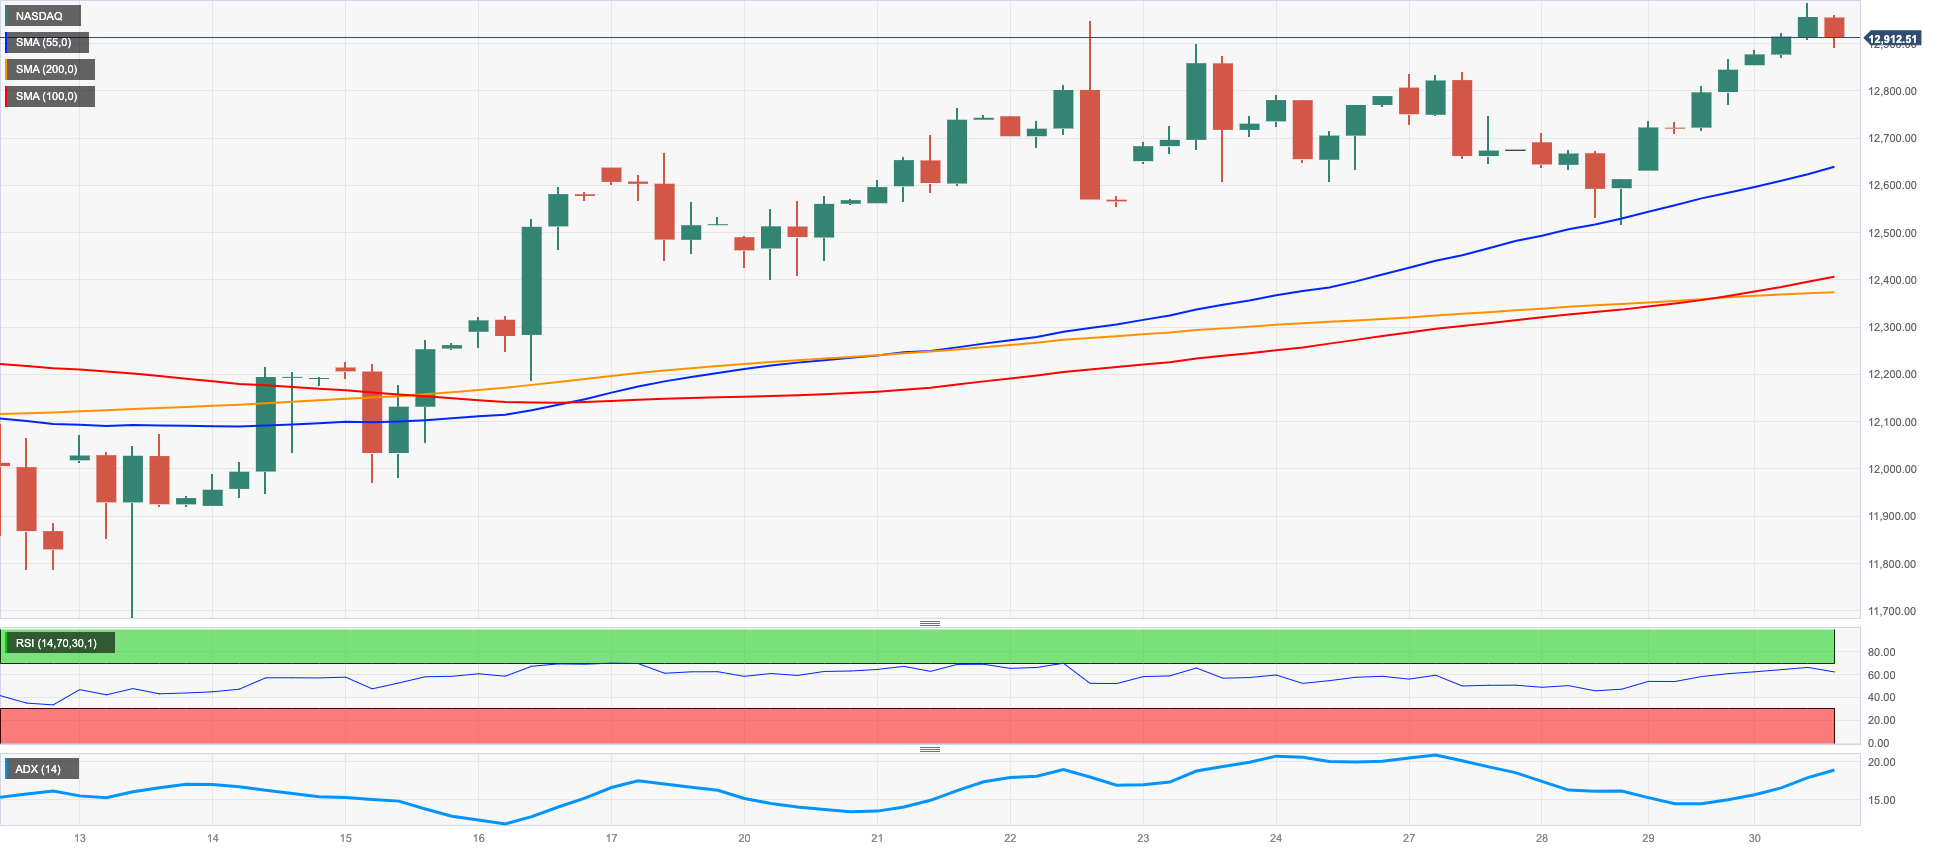
The weaker dollar in combination with the vacillating price action in US yields and declining banking concerns all helped the tech reference Nasdaq 100 to print new 2023 peaks just below the 13000 hurdle on Thursday.
In addition, speculation of a potential pivot in the Fed’s normalization programme kept the upbeat sentiment well and sound among traders and collaborated with the upside in the index to levels last traded back in August 2022.
Next on the upside for the Nasdaq emerges the round level at 13000, which is closely followed by the weekly high at 13175 (August 26 2022) and the August 2022 top at 13720 (August 16). By contrast, the weekly low at 12517 (March 28) should offer minor support ahead of the temporary 55-day SMA at 12213 and the key 200-day SMA at 11919. Further down appears the March low at 11695 (March 13) ahead of weekly lows at 11550 (January 25) and 11251 (January 19) and the 2023 low at 10696 (January 6). The daily RSI rose past the 63 level.
Top Gainers: JD.com Inc Adr, PDD Holdings DRC, Zoom Video
Top Losers: Paychex, Micron, Regeneron Pharma,
Resistance levels: 12987 13175 13720 (4H chart)
Support levels: 12517 11826 11695 (4H chart)
DOW JONES
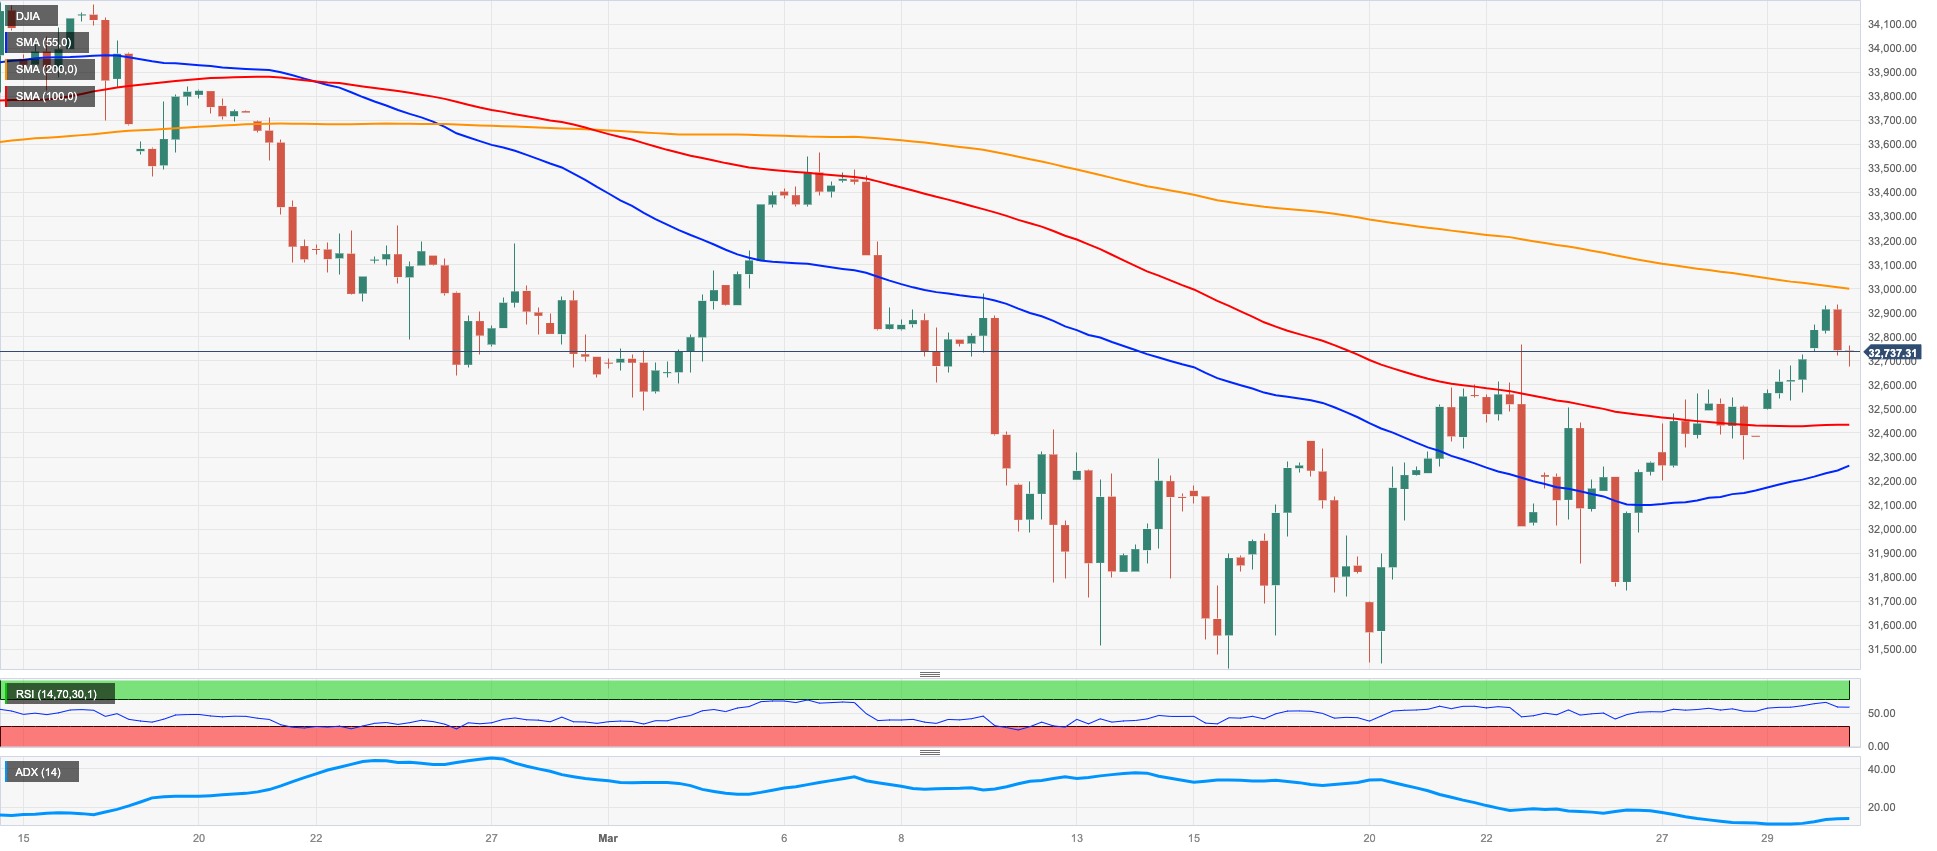
Equities tracked by the three major US stock indices traded with humble gains and advanced to new multi-day highs on Thursday.
Indeed, investors were caught between declining US yields, the weaker dollar, prudence ahead of the release of Friday’s PCE and expectation of a potential impasse by the Fed at its meeting in May.
Some comments from Boston Fed S. Collins (2025 voter, centrist) appear to have reinforced the above after she suggested the Fed might raise rates one more time and then hold steady for the rest of the year amidst the current context of elevated inflation. By the same token, she also ruled out rate cuts this year.
Overall, the Dow Jones rose 0.13% to 32760, the S&P500 advanced 0.21% to 4036 and the tech-reference Nasdaq Composite gained 0.54% to 11989.
The Dow Jones clocked a new weekly peak at 32905 (March 30). If the index leaves this level behind, it could prompt a test of the March high at 33572 (March 6) to emerge on the horizon prior to the 2023 top at 34342 (January 13) and the December 2022 peak at 34712 (December 13). North from here emerges the April 2022 high at 35492 (April 21). The other way around, the breach of the 200-day SMA at 32374 could put the 2023 low at 31429 (March 15) to the test before the 30000 mark and the 2022 low at 28660 (October 13). The daily RSI eased a tad to the sub-52 area.
Top Performers: Intel, Walgreen Boots, Walt Disney
Worst Performers: American Express, JPMorgan, Visa A
Resistance levels: 32905 33315 33572 (4H chart)
Support levels: 31805 31429 28660 (4H chart)
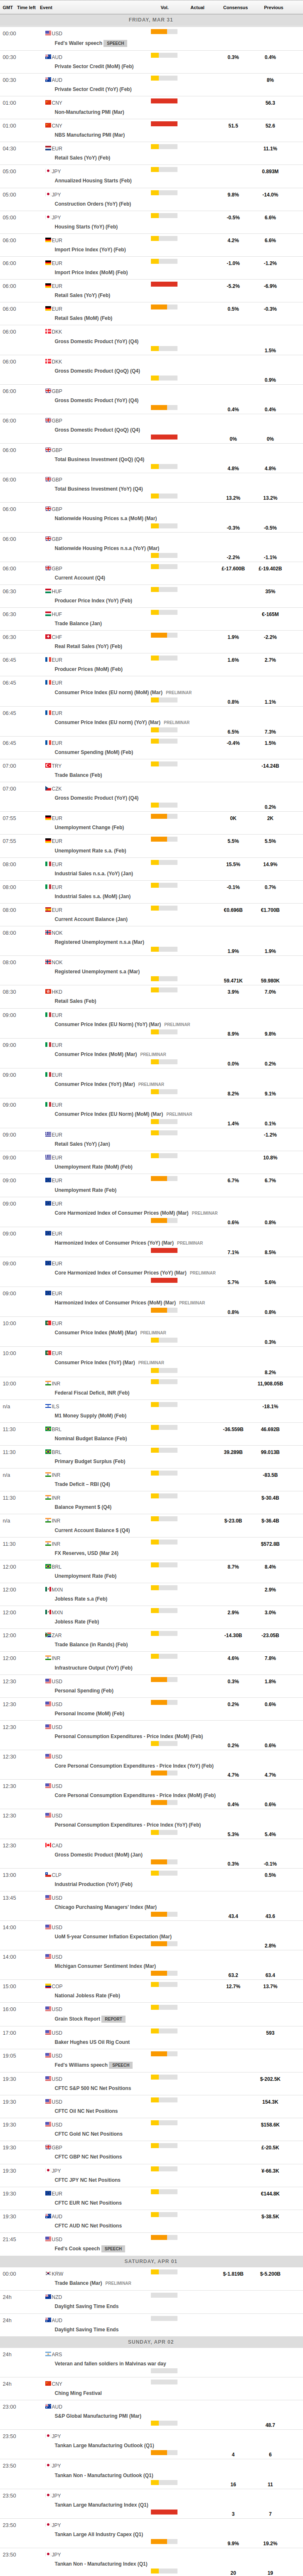
MACROECONOMIC EVENTS
All Information & Updates provided by:

All information relating to the financial markets available on this page has been prepared and issued by FXStreet (Forexstreet SL, Spain, Reg: B62498233) on the basis of publicly available information and all information believed to be reliable and does not conflict with Kuwaiti local laws, and all necessary care has been taken to before the company to ensure that the facts mentioned are correct from the source.
NCM Investment nor any of its directors or employees shall in any way be held responsible for the contents of this news, and the information contained on this page is intended only to provide clients with publicly available information and should not be construed as investment advice, report or analysis and/or constitute an offer or invitation to buy or sell financial instruments of any kind.
RISK WARNING: Forex and CFDs are highly risky leveraged products, as losses can exceed deposits. Please ensure you understand all the risks and take independent advice if necessary. NCM will segregate the clients based on the criteria of the regulator and its bylaws. NCM does not provide any advisory service; the material published does not constitute advice or a recommendation for a transaction in any financial instrument. NCM accepts no responsibility for any use of the content presented and any consequences of that use. Anyone acting on the information provided does so at their own risk.