
- Contact Us:
-

-

-

-


Daily Market Updates
03 Apr 2023
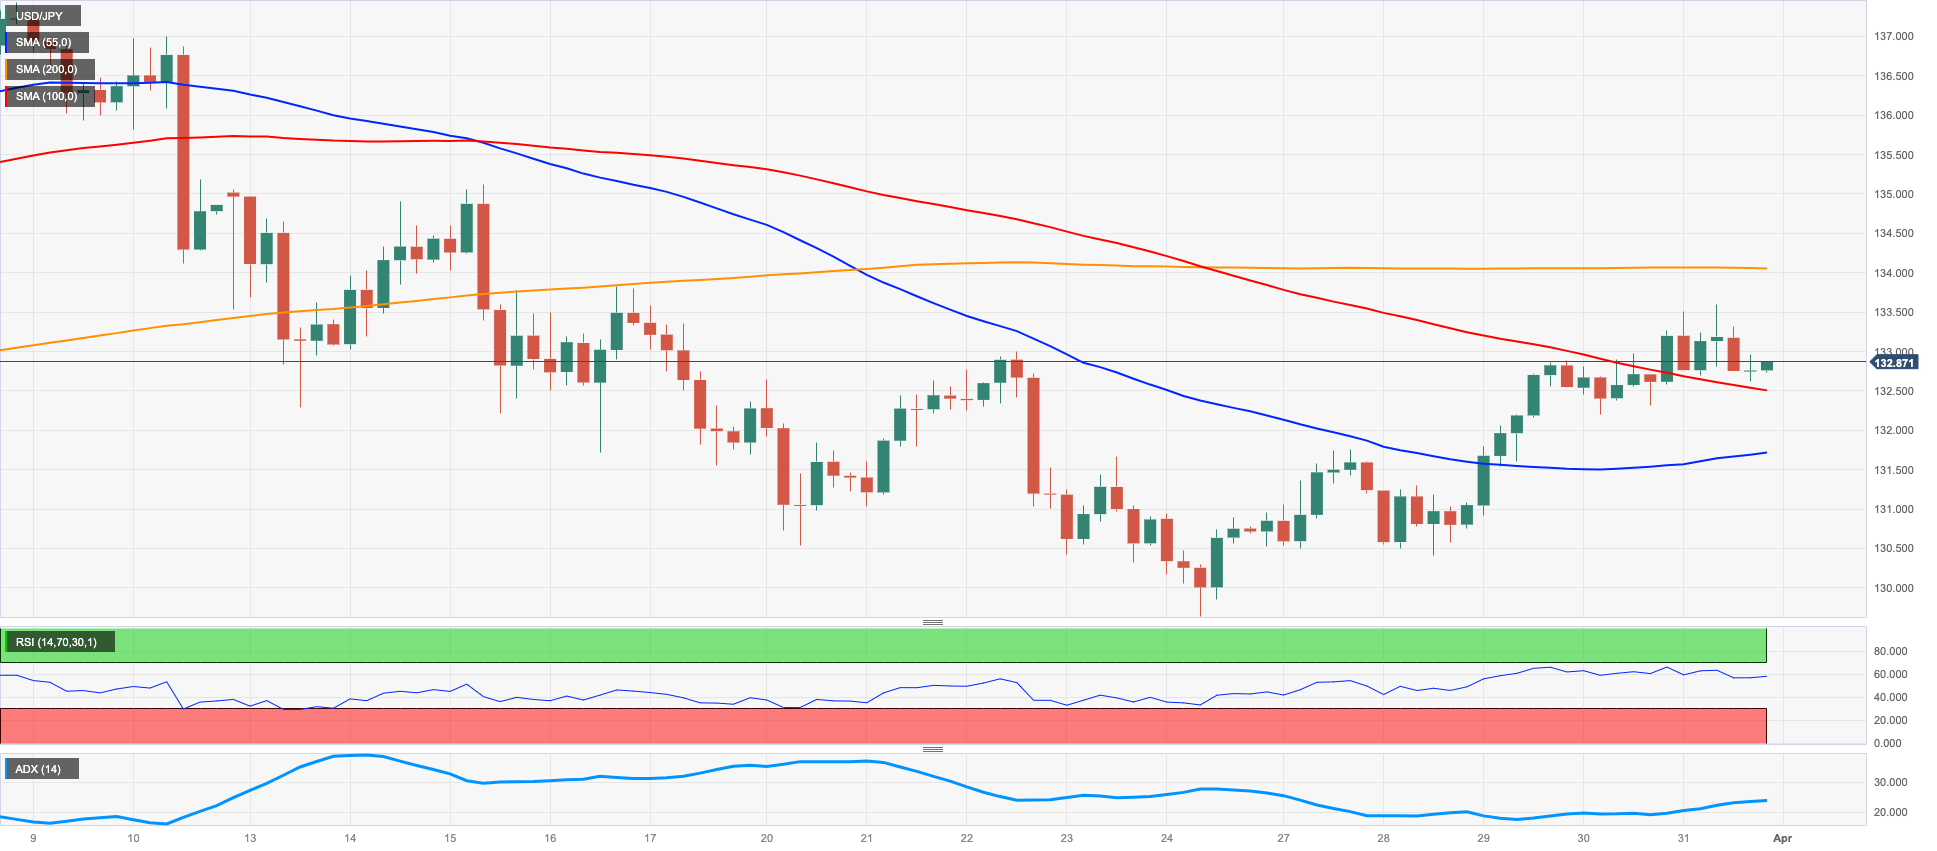
USDJPY
Following the move to 2-week peaks near 133.60 during the European morning, USD/JPY embarked on a corrective decline pari passu with the equally gradual retracement in US yields across the curve on Friday.
That said, spot ended the session with marginal gains around 132.70, while the strong rebound in the greenback failed to lend support to the pair in a context dominated by the risk-off sentiment in the global markets.
In the Japanese money market, the JGB 10-year yields extended the consolidative range below the 0.35% for yet another session.
In the docket, the Unemployment Rate ticked higher to 2.6% in February and the Job/applications ratio eased to 1.34. In addition, preliminary Industrial Production is expected to contract 0.6% in the same month and Retail Sales expanded 6.6% in the year to February.
The surpass of the weekly top at 133.59 could motivate USD/JPY to rapidly test the provisional 100-day SMA at 133.85 ahead of the key 200-day SMA at 137.30 seconded by the 2023 peak at 137.91 (March 8). On the other hand, the immediate support emerges at the March low at 129.63 (March 24) prior to the February low at 128.08 (February 2) and the 2023 low at 127.21 (January 16). The daily RSI looked stable around the 50 region.
Resistance levels: 133.59 134.03 135.11 (4H chart)
Support levels: 132.19 131.79 130.40 (4H chart)
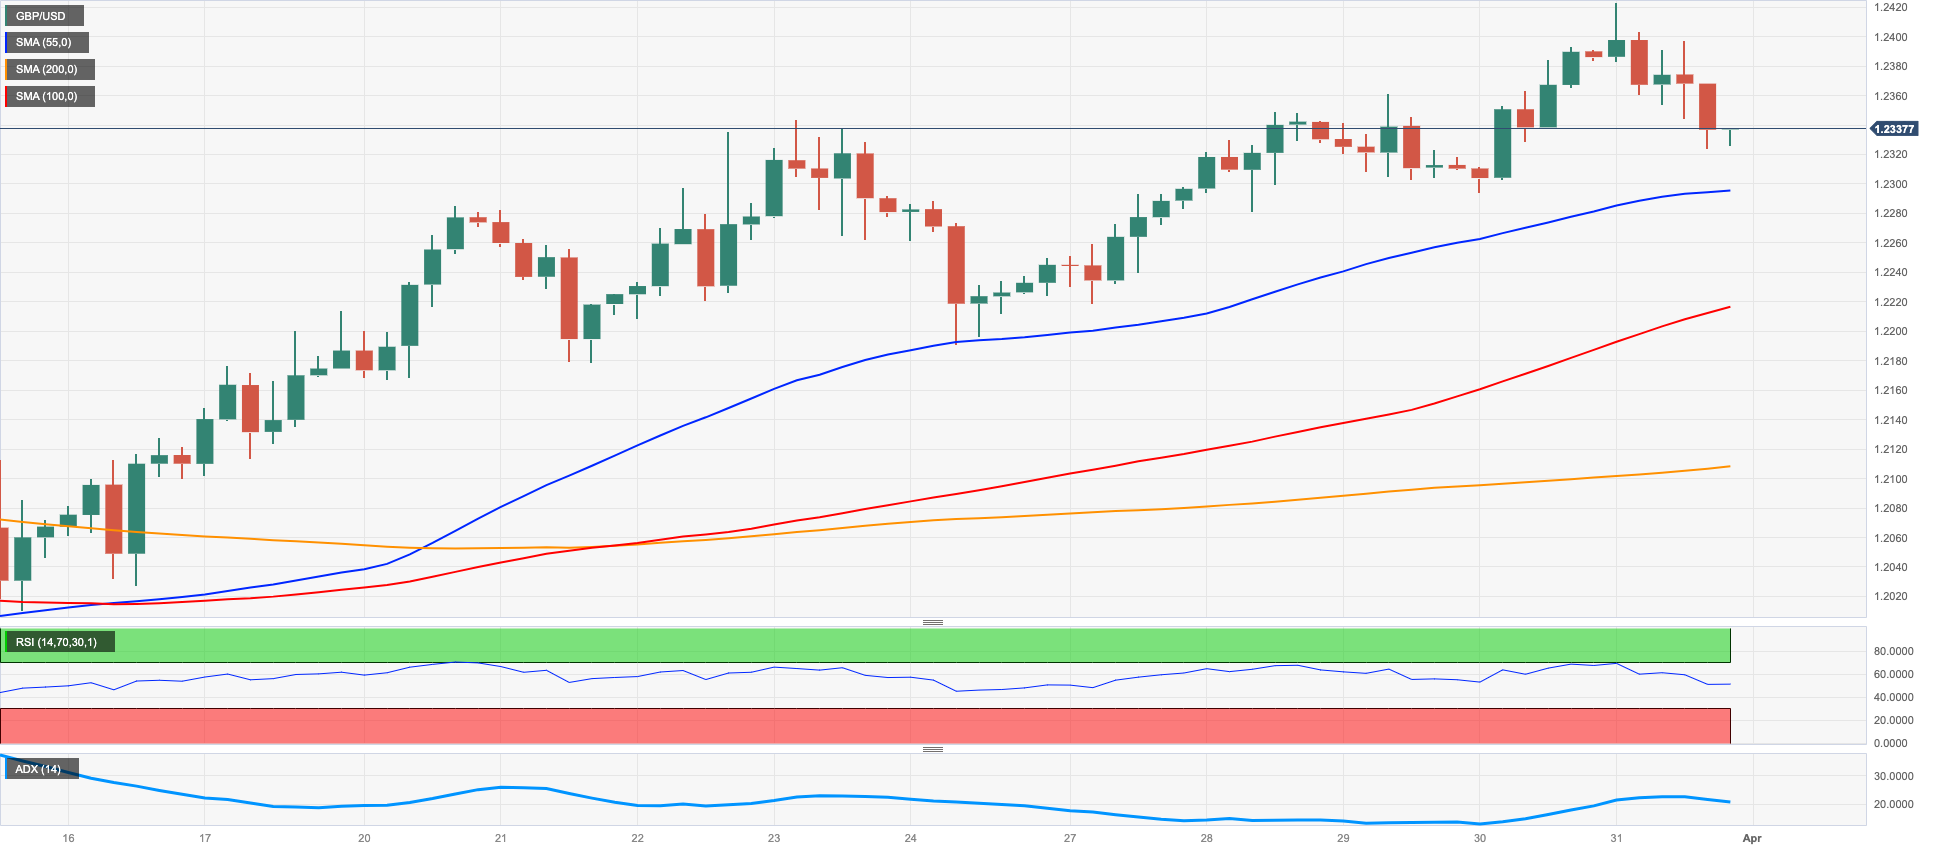
GBPUSD
GBP/USD briefly surpassed the key 1.2400 the figure to chart new multi-week highs during the Asian trading hours, although the Sterling later succumbed to the marked rebound in the greenback.
In fact, Cable ended Friday’s session with moderate losses amidst the persistent bounce in the USD Index (DXY) in an atmosphere where the risk-off trade prevailed.
There were no data releases scheduled in the UK calendar on Friday, leaving the attention to Monday’s publication of the final Manufacturing PMI for the month of March.
GBP/USD recorded a new March top at 1.2423 (March 31) and therefore leaves the door open to a potential visit to the 2023 peak at 1.2447 (January 23) ahead of the May 2022 high at 1.2666 (May 27). The surpass of the latter could pave the way for a move to the 200-week SMA at 1.2870 just ahead of the psychological 1.3000 yardstick. Oppositely, there are interim support levels at the 55- and 100-day SMAs at 1.2163 and 1.2128, respectively, prior to the weekly low at 1.2010 (March 15) and the key 200-day SMA at 1.1893. Further down comes the 2023 low at 1.1802 (March 8) seconded by the November 2022 low at 1.1142 (November 4). The daily RSI lost ground and dropped below 59.
Resistance levels: 1.2423 1.2447 1.2666 (4H chart)
Support levels: 1.2324 1.2293 1.2189 (4H chart)
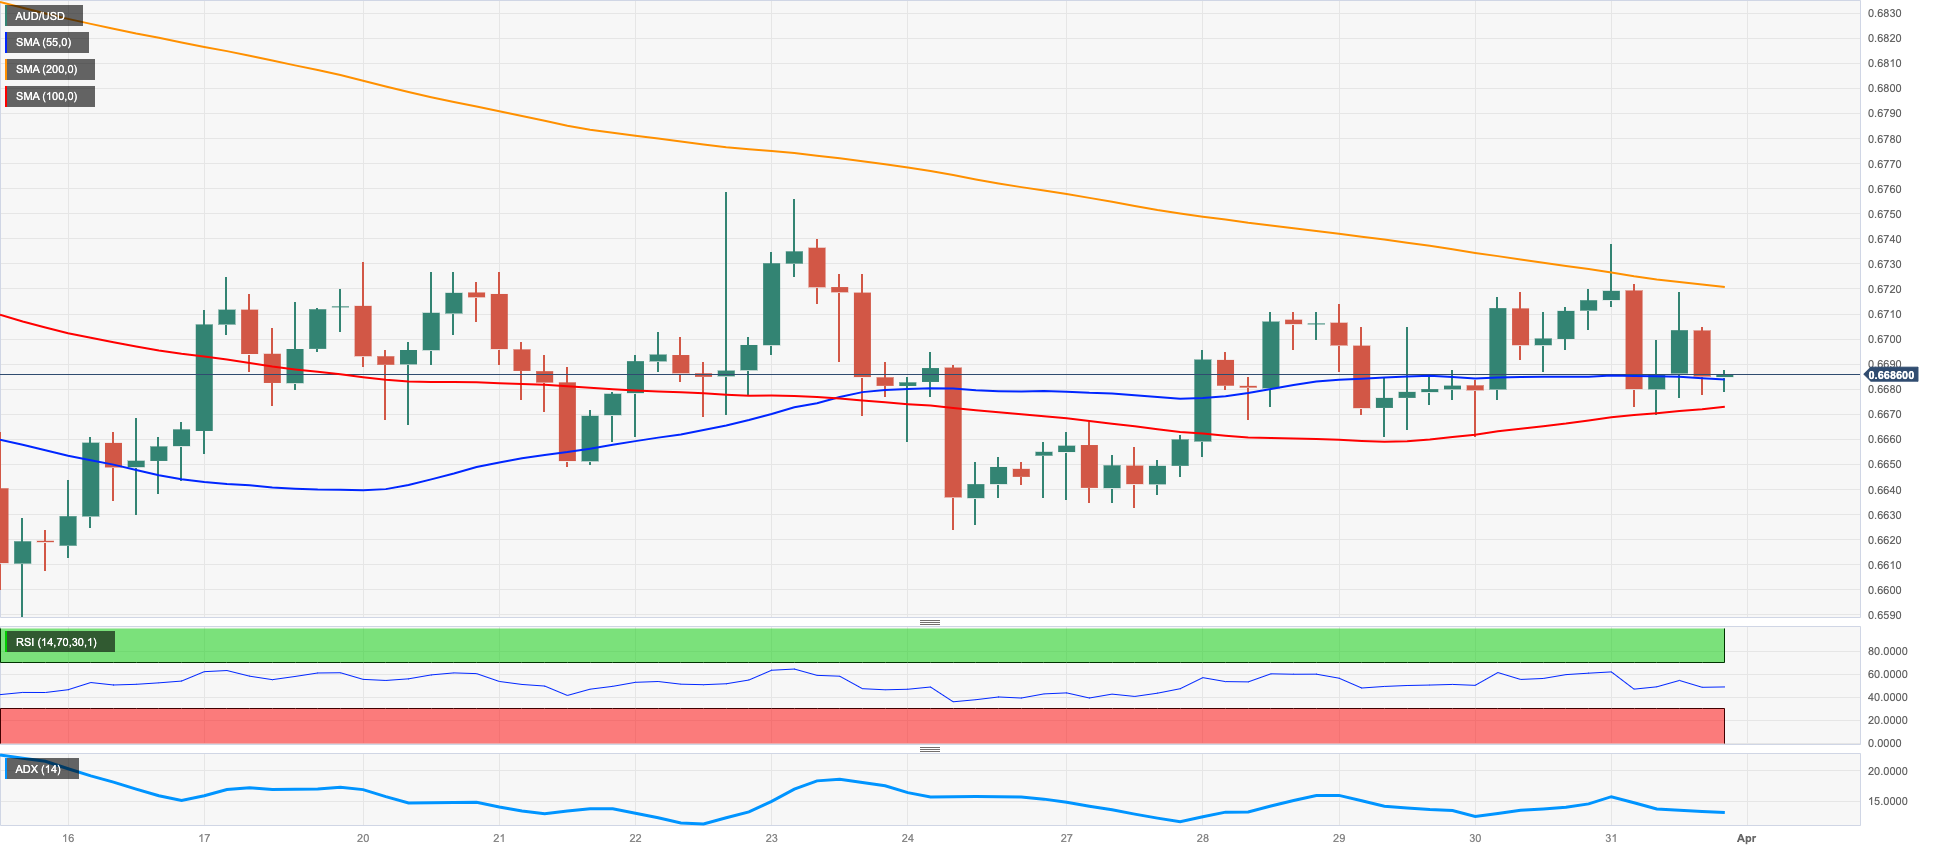
AUDUSD
The strong bounce in the dollar kept the price action in the risk complex depressed and sponsored a marked decline in AUD/USD back below the 0.6700 region on Friday.
Despite the knee-jerk, the pair managed to close the week with decent gains and erode the previous retracement.
In addition, the mixed tone in the commodity complex did not help the Aussie dollar either after copper prices extended the upbeat mood and prices of the iron ore grinded slightly lower
In Oz, Housing Starts contracted at a yearly 0.3% in February, while Private Sector Credit expanded 0.3% MoM in the same month and 7.6% over the last twelve months.
AUD/USD remains within a consolidation theme for the time being. Against that, the immediate contention emerges at the 2023 low at 0.6563 (March 10) ahead of the weekly low at 0.6386 (November 10 2022) and the November 2022 low at 0.6272 (November 3). Having said that, the key 200-day SMA at 0.6749 should offer initial resistance prior to the weekly peak at 0.6758 (March 22) seconded by the March high at 0.6783 (March 1). Beyond this level aligns the interim 100- and 55-day SMAs at 0.6798 and 0.6829, respectively, ahead of the key round level at 0.7000 and followed by the weekly top at 0.7029 (February 14). The daily RSI ticked lower to the sub-47 zone.
Resistance levels: 0.6737 0.6758 0.6783 (4H chart)
Support levels: 0.6661 0.6625 0.6589 (4H chart)
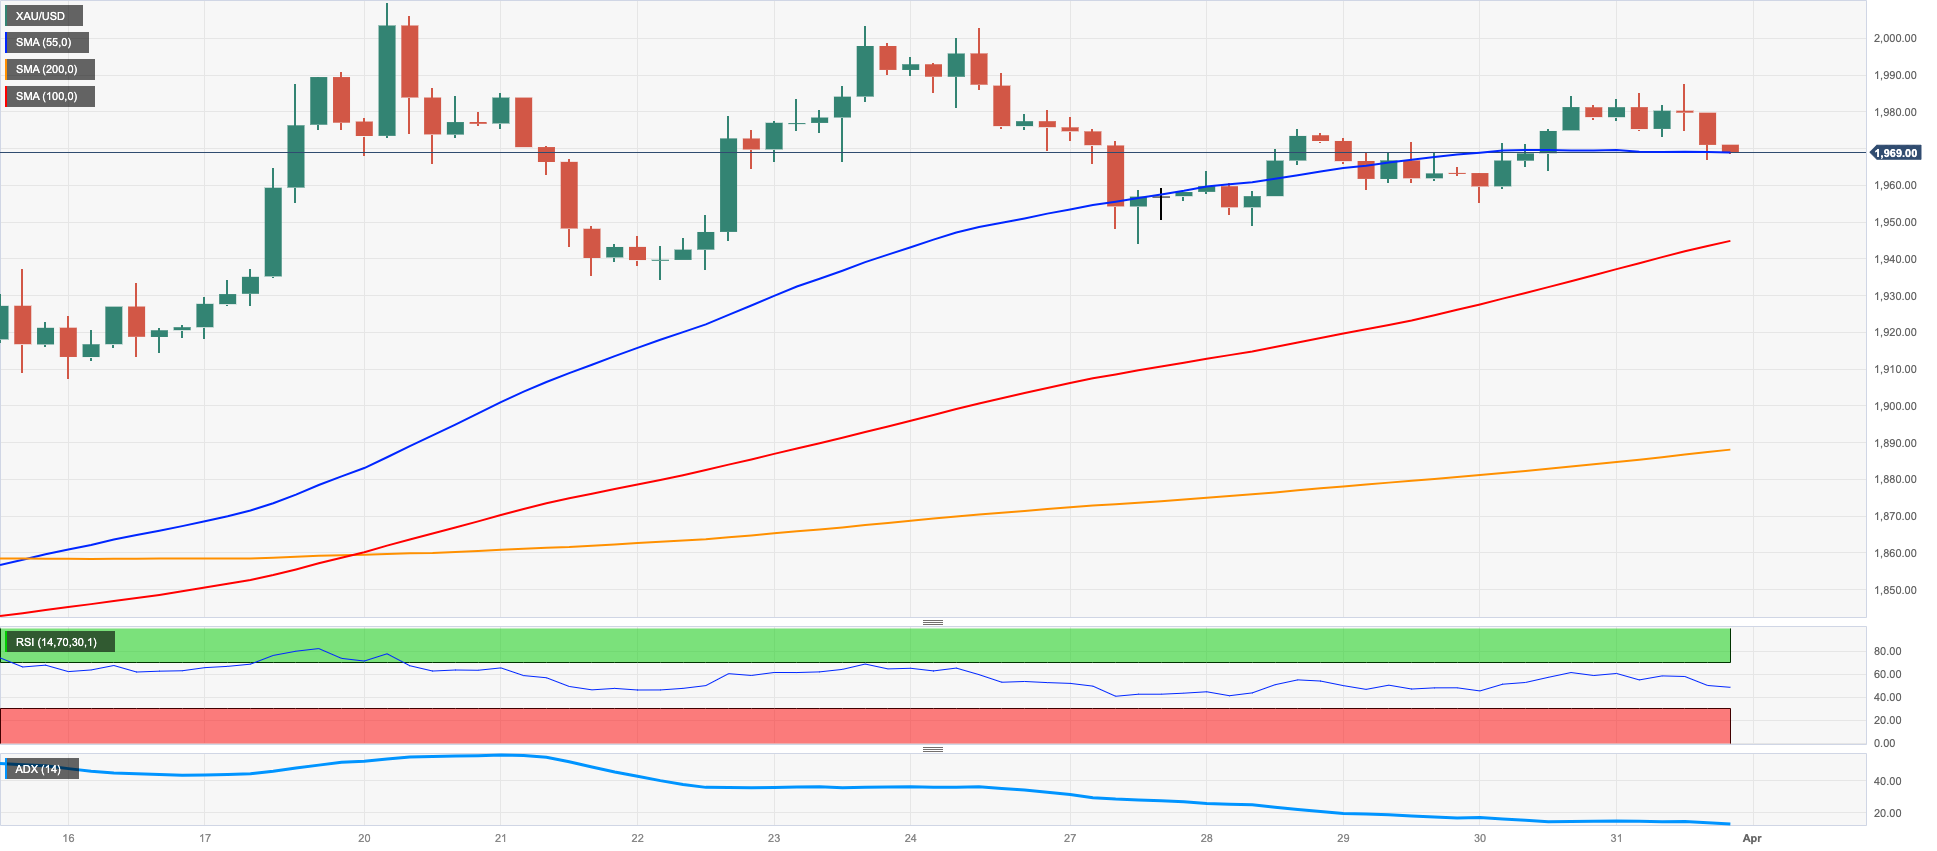
GOLD
Renewed weakness prompted the precious metal to lose ground for the second week in a row despite maintaining the trade in the upper end of the range and well above the key $1900 mark per ounce troy.
The pronounced rebound in the dollar put the yellow metal under pressure and sparked the resumption of the selling bias at the end of the week, although the decline in US yields appears to have somewhat limited the downside.
Price action around the precious metal is expected to keep tracking developments from the Fed and the potential next steps regarding its normalization process, with opinions among market participants still pretty divided between a 25 bps rate raise and an “on hold” stance.
There are no changes to the topside in gold, as the next up barrier still emerges at the 2023 peak at $2009 (March 20) seconded by the 2022 high at $2070 (March 8) and the all-time top at $2075 (August 7 2020). In opposition, the weekly low at $1934 (March 22) comes first seconded by the interim 55- and 100-day SMAs at $1895 and $1851, respectively. The loss of the latter puts the March low at $1809 (March 8) back on the traders’ radar before the 2023 low at $1804 (February 28) and the key 200-day SMA at $1784.
Resistance levels: $1987 $2009 $2070 (4H chart)
Support levels: $1944 $1934 $1885 (4H chart)
CRUDE WTI
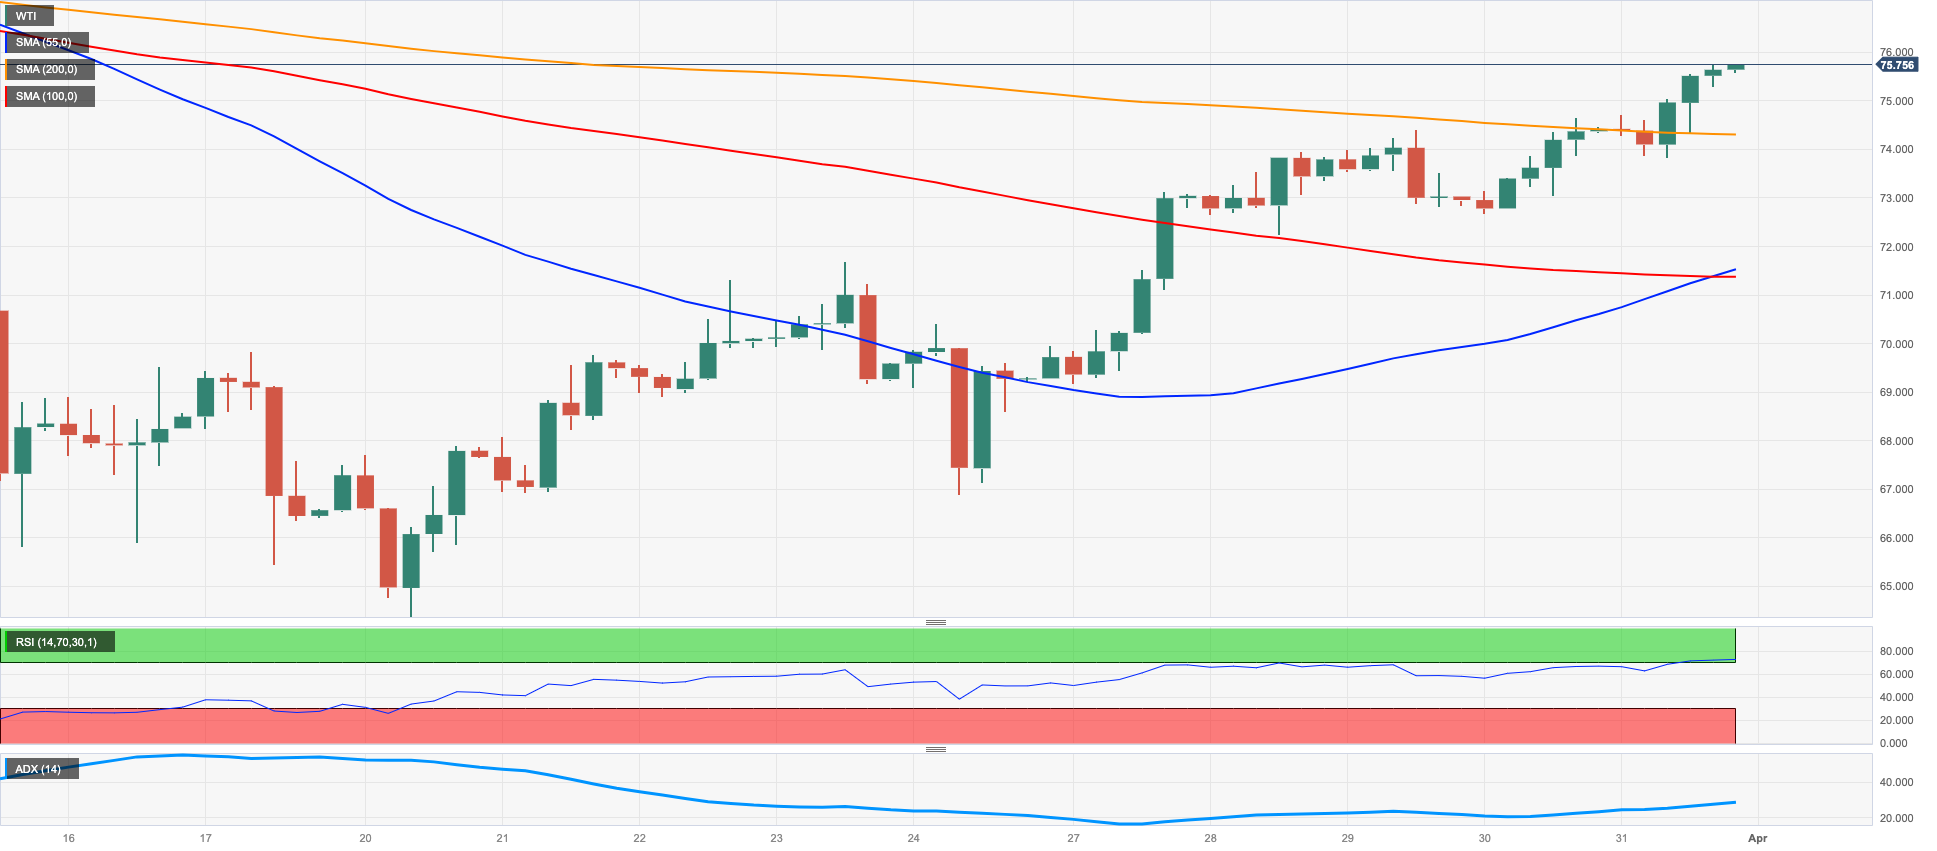
WTI prices rose to fresh 2-week highs past the $75.00 mark per barrel on Friday amidst persistent supply jitters and renewed optimism in the wake of another sign that US inflation pressures are diminishing, this time measured by the PCE.
In fact, supply disruptions in Iraq's Kurdistan region remained unabated at the end of the week and lent further legs to the upside bias in the commodity, while recession fears dwindled on the back of speculation that the Fed could pause its tightening monetary stance.
Somewhat adding to the upbeat mood among traders, the OPEC+ is largely anticipated to leave the current status quo unchanged when it meet on April 3.
In the calendar, driller Baker Hughes said the total US active oil rigs went down by 1 to 592 in the week to March 31.
Despite the pronounced pick-up in prices observed in the last couple of weeks, crude oil closed its five consecutive month with losses in March, including a breach of the key 200-month SMA ($72.57).
Next on the upside for WTI prices now aligns the interim 100-day SMAs at $77.00 ahead of the March peak at $80.90 (March 7) and the 2023 high at $82.60 (January 23). The breakout of the latter could prompt a potential visit to the December 2022 top at $83.32 (December 1) to emerge on the horizon prior to the November 2022 peak at $93.73 (November 7). Just the opposite, there is a minor contention at $66.86 (March 24) seconded by the 2023 low at $64.41 (March 20) and ahead of the December 2021 low at $62.46 (December 2). South from here emerges the August 2021 low at $61.76 (August 23) followed by the key $60.00 mark per barrel.
Resistance levels: $75.68 $78.01 $80.90 (4H chart)
Support levels: $74.33 $72.57 $66.79 (4H chart)
GER40
European equities extended the weekly recovery and ended the week in a very positive mood.
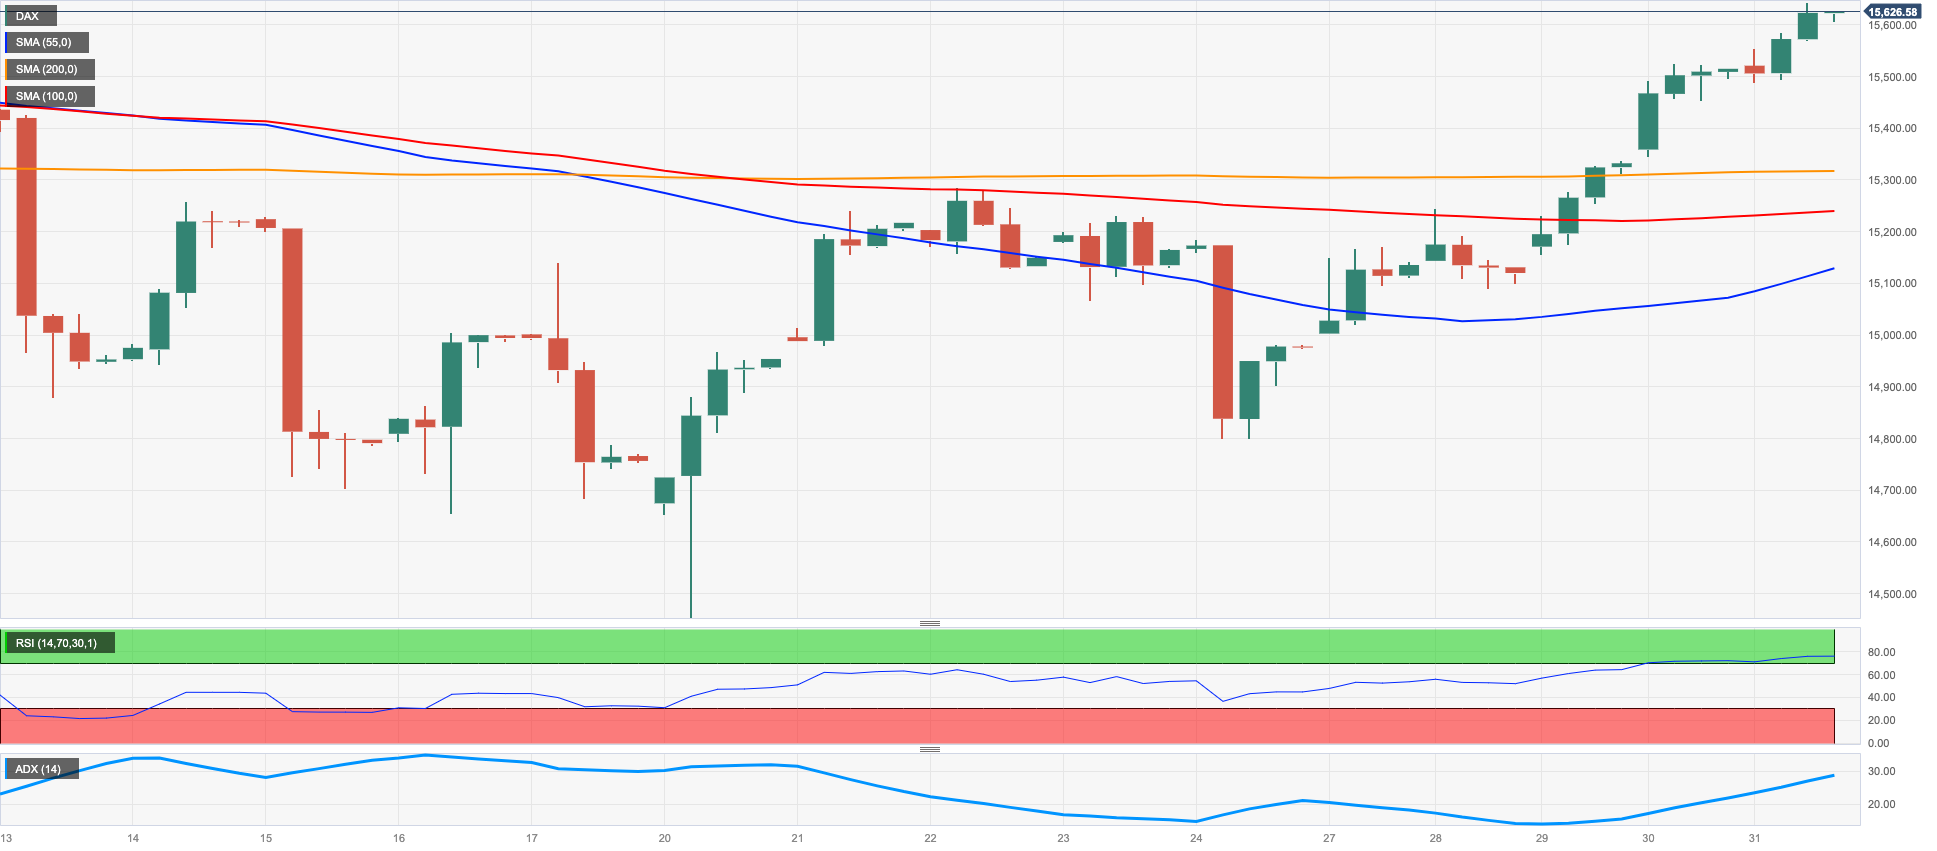
That said, the German benchmark DAX40 printed the fifth consecutive daily gain and rose past the 15600 region, just below the so far 2023 tops.
Easing banking jitters coupled with diminishing inflation pressures in both the US and the EU boosted the optimism among investors and lent support to the view of an impasse in the Fed’s hiking cycle and the ECB.
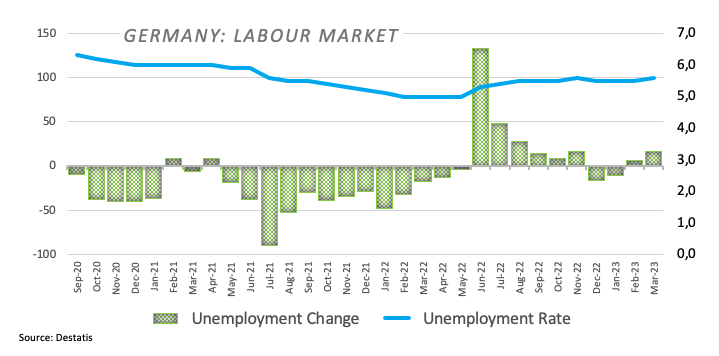
In Germany, Retail Sales in Germany shrank 7.1% in the year to February, while the Unemployment Rate rose to 5.6% and the Unemployment Change increased by 16K people, both prints for the month of March.
In line with the rest of their peers, the 10-year Bund yields reversed a 4-day positive streak and closed below the 2.30% mark.
Extra gains in the DAX40 now target the 2023 top at 15706 (March 6) prior to the February 2022 high at 15736 (February 2 2022) and the round level at 16000. Beyond this region aligns the 2022 top at 16285 (January 5). The other way around, the 55- and 100-day SMAs at 15279 and 14856, respectively, precede the minor support at 14809 (March 24) prior to the March low at 14458 (March 20) and the key 200-day SMA at 13932. The daily RSI picked up pace and flirted with 60.
Best Performers: Adidas, Zalando SE, Fresenius SE
Worst Performers: Sartorius AG VZO, Infineon, Porsche
Resistance levels: 15659 15706 15736 (4H chart)
Support levels: 15147 14809 14458 (4H chart)
NASDAQ
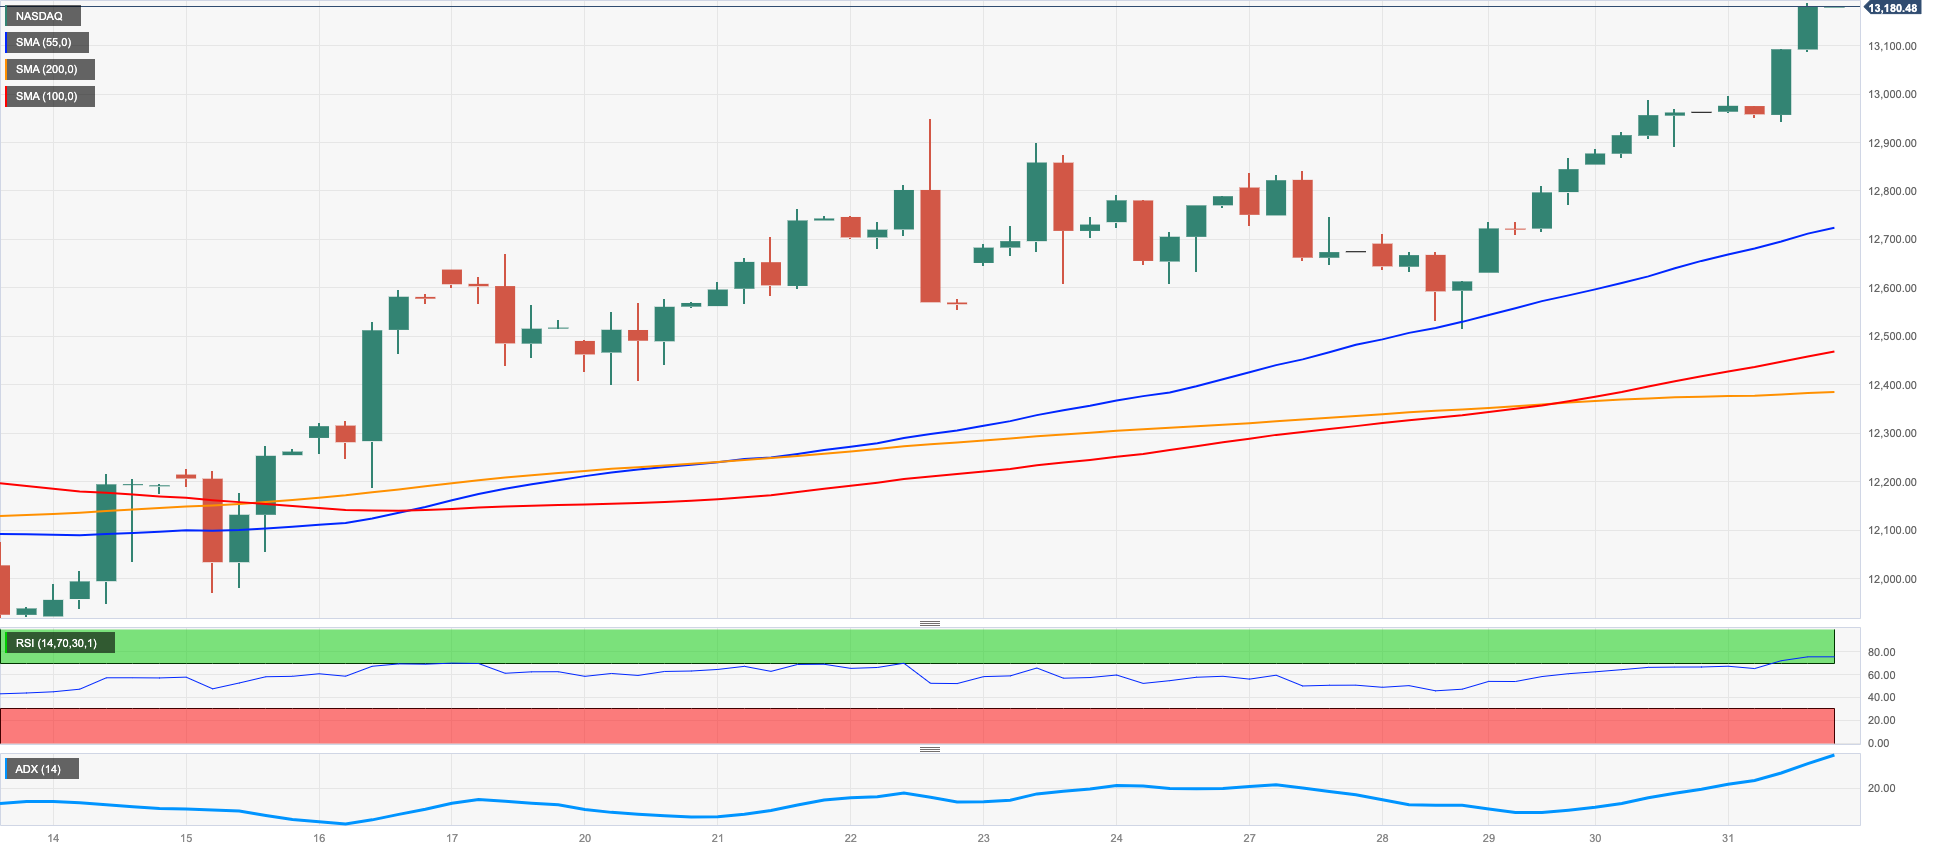
The generalized view that the Fed could introduce a pivot in its current restrictive monetary policy in combination with another weak print from US inflation all boosted the sentiment in the tech sector and lifted the reference Nasdaq 100 to levels last traded back in late August near the 13200 area on Friday.
In the same line, declining US yields across the curve also lent fresh legs to tech equities and propped up the move higher in the index.
Further upside in the Nasdaq 100 now targets the August 2022 peak at 13720 (August 16) seconded by the round level at 14000 and the March 2022 high at 15265 (March 29). On the opposite side, there is an immediate support at the weekly low at 12517 (March 28) prior to the temporary 55-day SMA at 12247 and the key 200-day SMA at 11929. If losses accelerate, then the index could slip back to the March low at 11695 (March 13) before weekly lows at 11550 (January 25) and 11251 (January 19), all ahead of the 2023 low at 10696 (January 6). The daily RSI poked with the 69 area.
Top Gainers: Rivian Automotive, Align, Datadog
Top Losers: Micron, JD.com Inc Adr, Cintas
Resistance levels: 13188 13720 14277 (4H chart)
Support levels: 12517 11851 11695 (4H chart)
DOW JONES
All three US stock benchmark indices closed in a “sea of green” on Friday, ending the first quarter of the year in a positive note and in multi-week peaks at the same time.
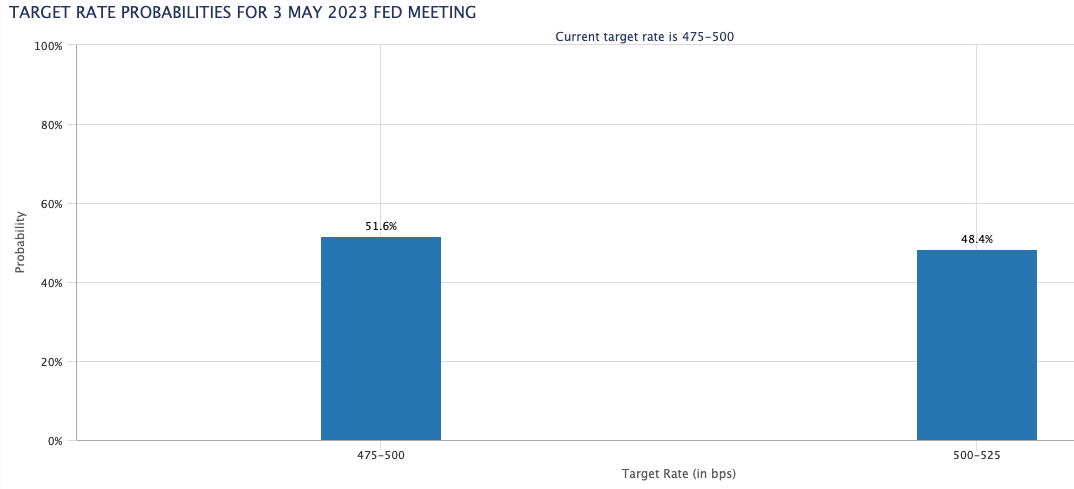
In fact, another soft print from US inflation figures – this time tracked by the PCE – reinvigorated speculation that the Federal Reserve might enter a pause-mode when it comes to its current tightening stance sooner rather than later.
According to CME Group’s FedWatch Tool, the probability that the Fed could leave rates unchanged at the May 3 meeting hovers around the 52%.
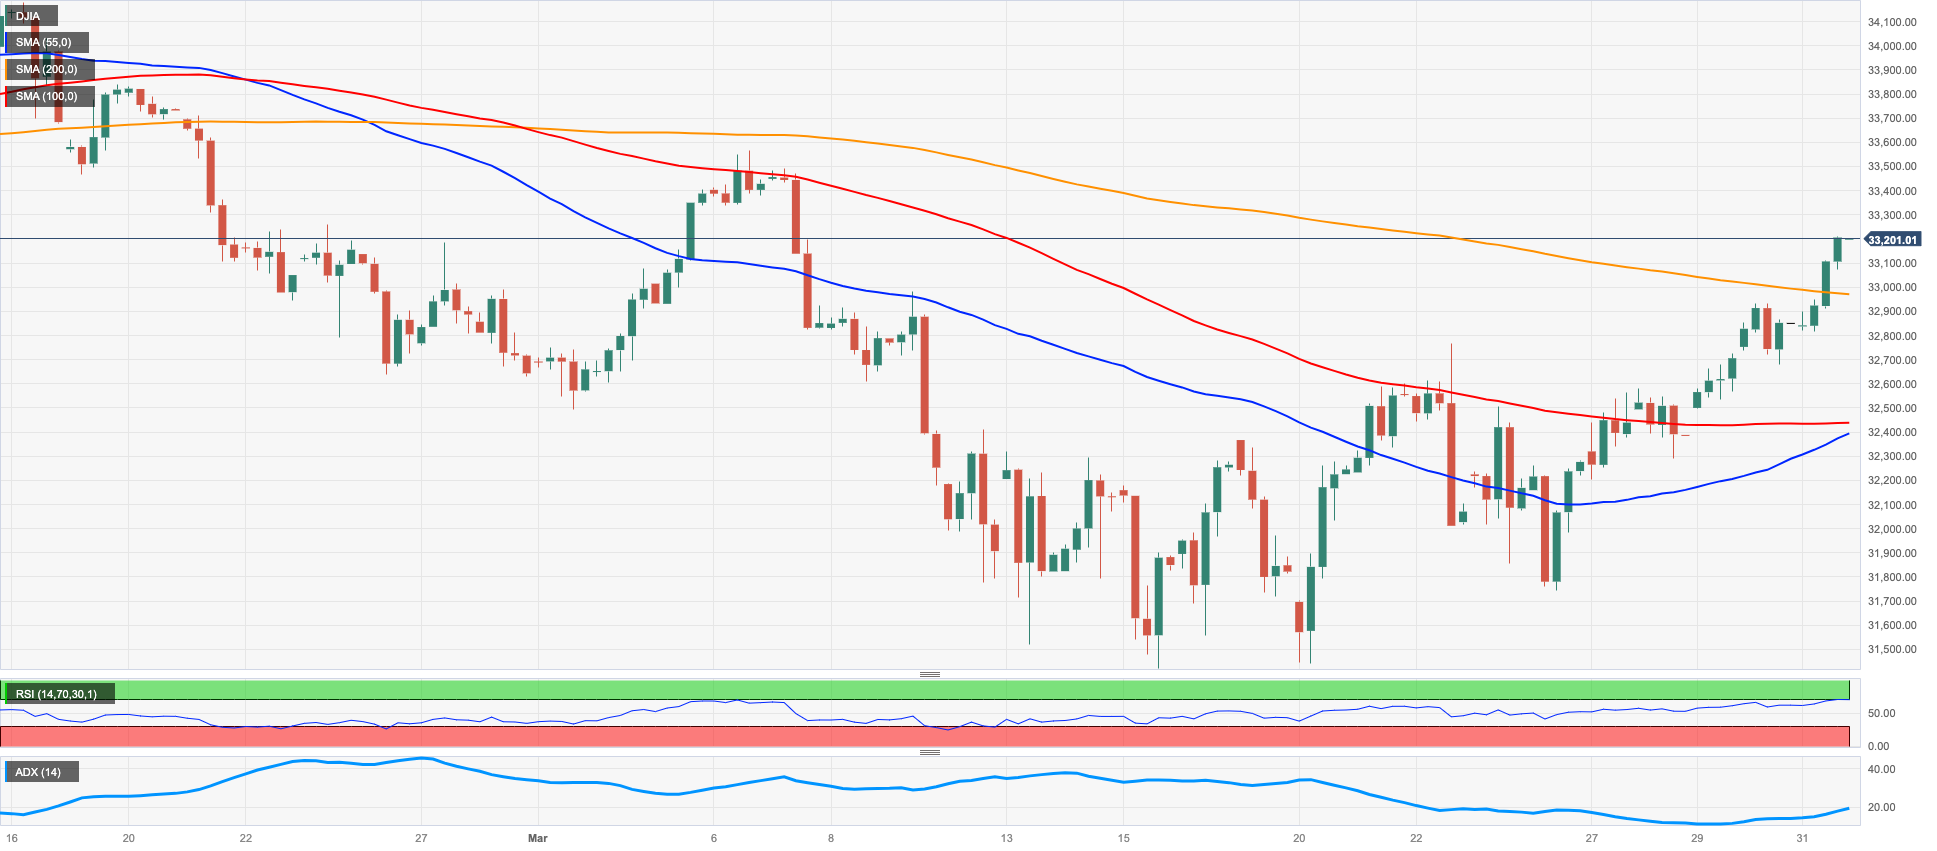
All in all, the Dow Jones advanced 1.26% to 33274, the S&P500 gained 1.44% to 4109 and the tech-heavy Nasdaq Composite rose 1.74% to 12221.
The Dow Jones advanced further and closed Friday’s session at shouting distance from the provisional 100-day SMA at 33352. If the index breaks above this region, it could then spark a move to the March top at 33572 (March 6) ahead of the 2023 peak at 34342 (January 13) and the December 2022 high at 34712 (December 13). Further up aligns the April 2022 top at 35492 (April 21). On the contrary, once 32541 zone is cleared, the 200-day SMA at 32389 could emerge on the horizon prior to the 2023 low at 31429 (March 15) ahead of the 30000 mark and the 2022 low at 28660 (October 13). The daily RSI rebounded to the 59 zone.
Top Performers: Home Depot, 3M, Nike
Worst Performers: Walgreen Boots, Amgen, Coca-Cola
Resistance levels: 33328 33572 34334 (4H chart)
Support levels: 32541 31805 31429 (4H chart)
MACROECONOMIC EVENTS

All Information & Updates provided by:

All information relating to the financial markets available on this page has been prepared and issued by FXStreet (Forexstreet SL, Spain, Reg: B62498233) on the basis of publicly available information and all information believed to be reliable and does not conflict with Kuwaiti local laws, and all necessary care has been taken to before the company to ensure that the facts mentioned are correct from the source.
NCM Investment nor any of its directors or employees shall in any way be held responsible for the contents of this news, and the information contained on this page is intended only to provide clients with publicly available information and should not be construed as investment advice, report or analysis and/or constitute an offer or invitation to buy or sell financial instruments of any kind.
RISK WARNING: Forex and CFDs are highly risky leveraged products, as losses can exceed deposits. Please ensure you understand all the risks and take independent advice if necessary. NCM will segregate the clients based on the criteria of the regulator and its bylaws. NCM does not provide any advisory service; the material published does not constitute advice or a recommendation for a transaction in any financial instrument. NCM accepts no responsibility for any use of the content presented and any consequences of that use. Anyone acting on the information provided does so at their own risk.