
- Contact Us:
-

-

-

-


Daily Market Updates
04 Apr 2023
USDJPY
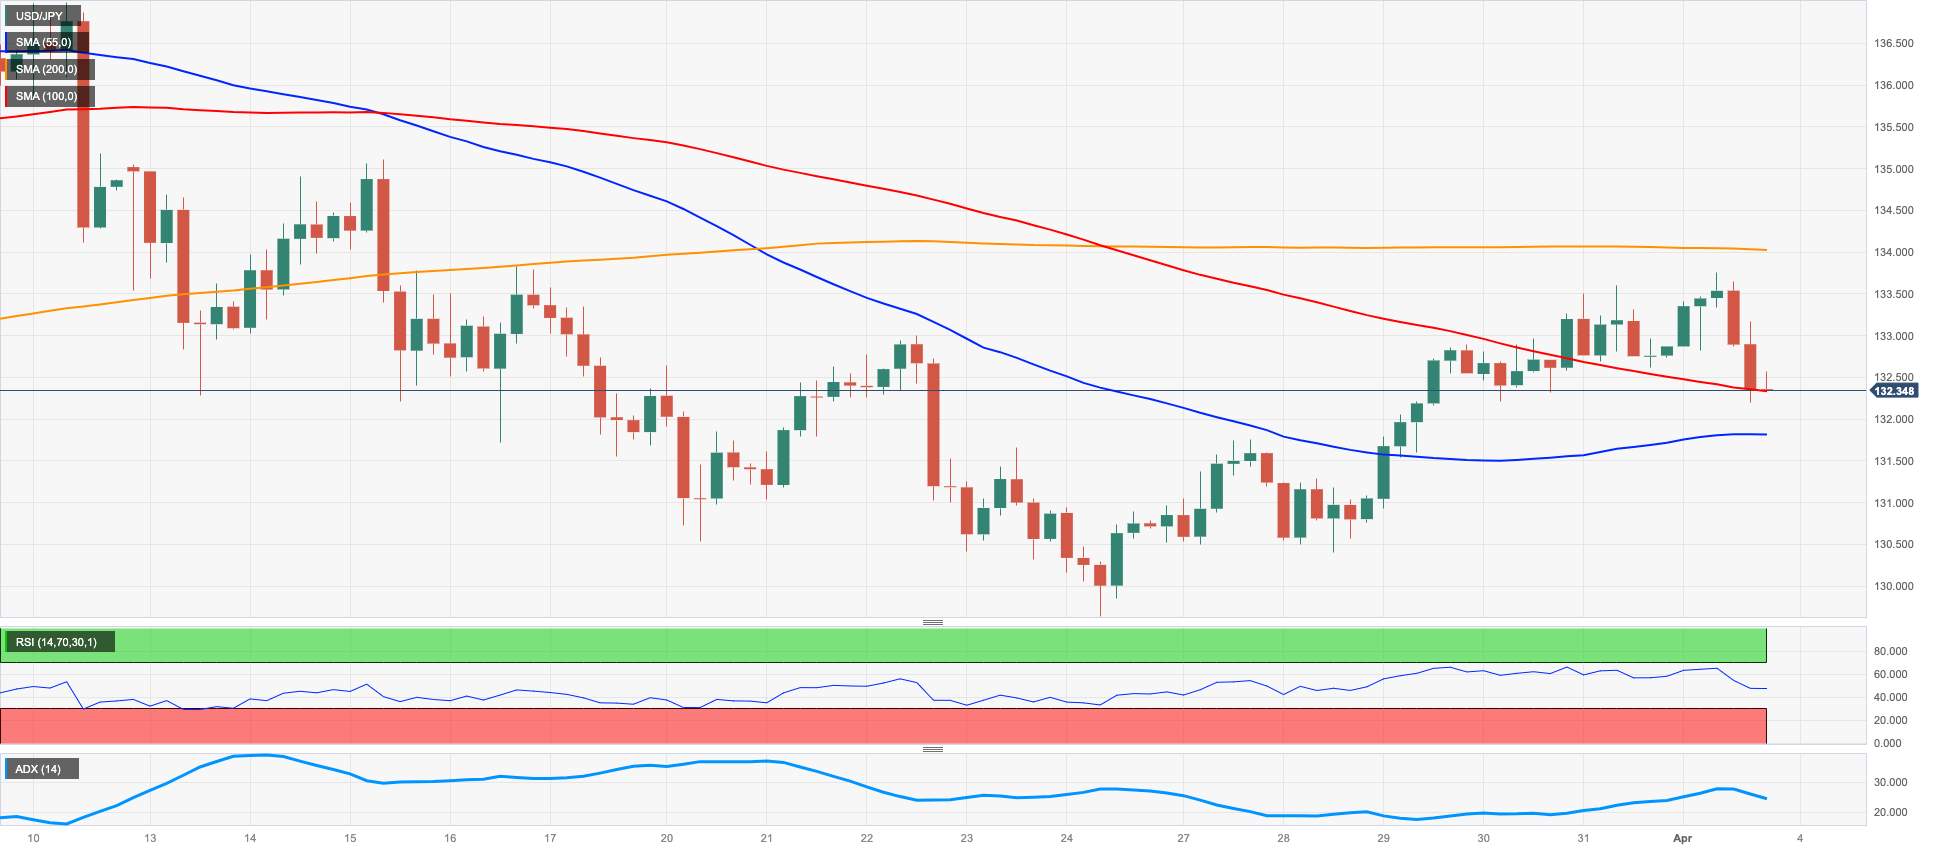
USD/JPY reversed Friday’s uptick and, in quite an erratic performance, rose to multi-session tops near 133.80 - an area coincident with the 100-day SMA – just to come all the way down to the low-132.00s towards the end of the NA session on Monday.
The pair’s renewed downside bias came in tandem with the disheartening performance in US yields and amidst further improvement in the risk-associate universe.
In Japan, the bond markets saw the JGB 10-year yields advance to multi-day highs near the 0.40% region
The Japanese docket saw the Tankan Large All Industry Capex at 3.2% in Q1, the Tankan Large Manufacturers Index ease to 1 (from 7), the Tankan Large Manufacturing Outlook recede to 3 (from 6) and the Tankan Non-Manufacturing Index improve a tad to 20 (from 19). Finally, the Jibun Bank Manufacturing PMI rose to 49.2 in March (from 47.7).
Beyond the weekly peak at 133.75 (April 3), USD/JPY could accelerate gains and revisit the key 200-day SMA at 137.29 ahead of the 2023 high at 137.91 (March 8). Further up comes the weekly top at 139.89 (November 30 2022) before another weekly peak at 142.25 (November 21 2022). Oppositely, the March low at 129.63 (March 24) emerges as the immediate contention ahead of the February low at 128.08 (February 2) and the 2023 low at 127.21 (January 16). The daily RSI dropped below the 47 zone.
Resistance levels: 133.75 134.04 135.11 (4H chart)
Support levels: 132.19 131.85 130.40 (4H chart)
GBPUSD
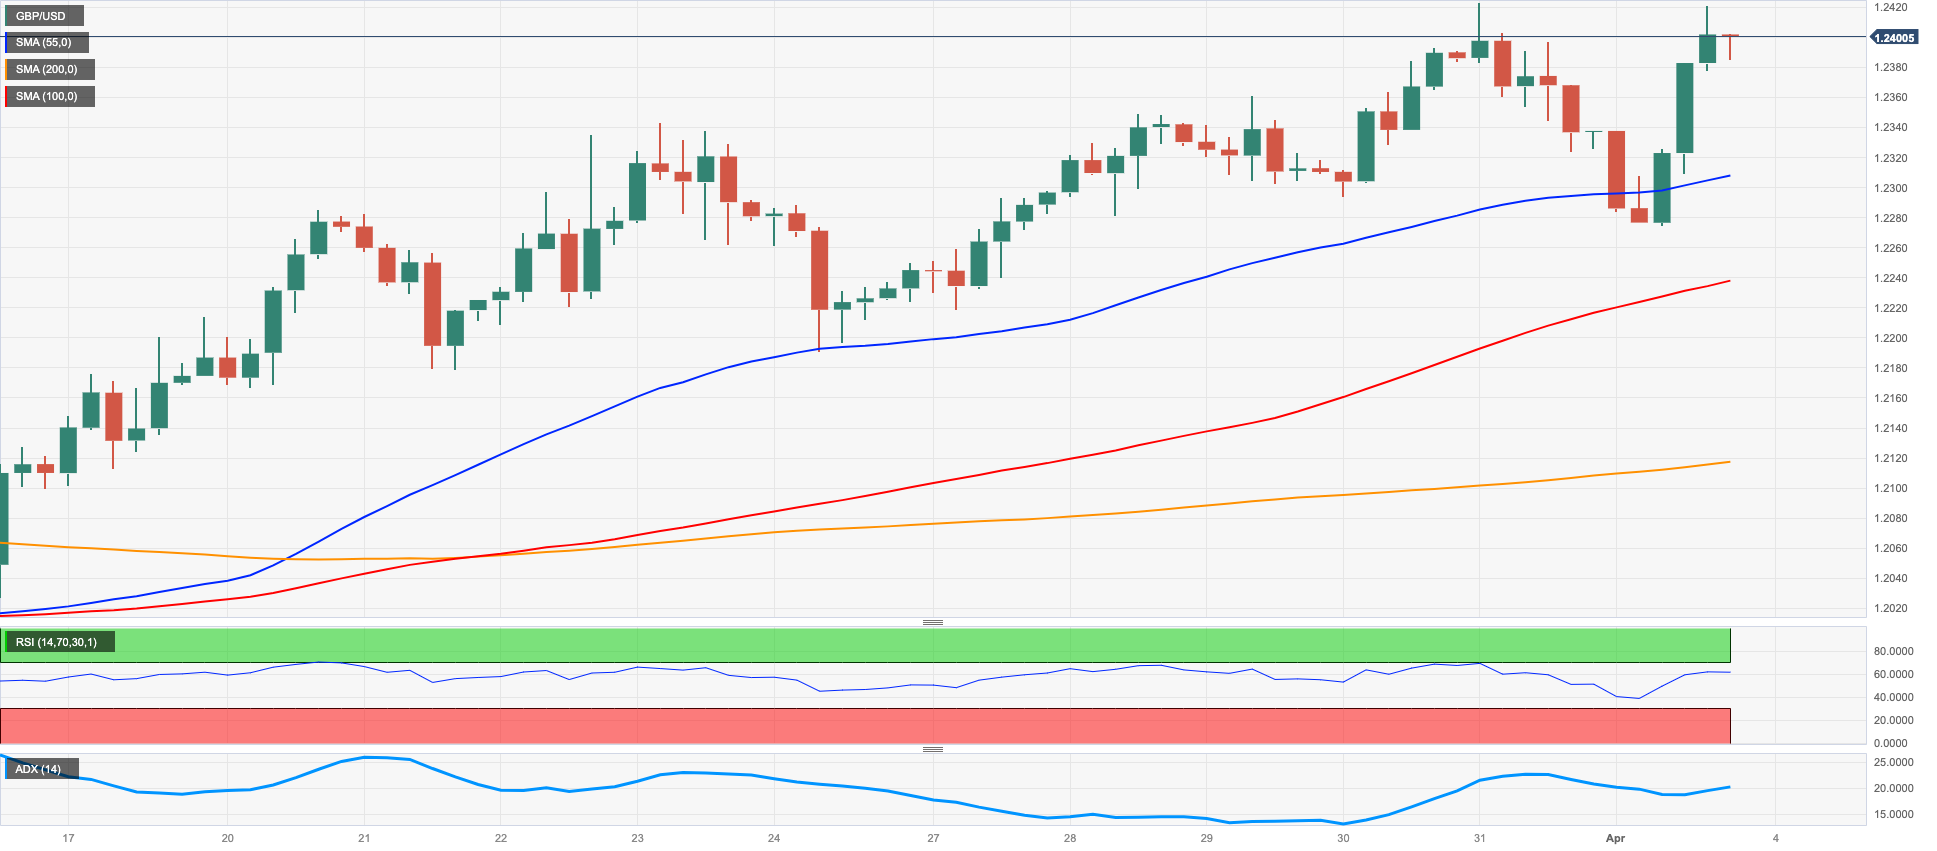
In line with its risk-linked peers, GBP/USD gathered fresh steam following an earlier pullback to the 1.2270 region on Monday.
Indeed, Cable reclaimed the area above the key 1.2400 barrier, as the initial bull run in the dollar fizzled out and the risk-on mood among market participants kicked in at the beginning of the week.
From the BoE, Chief Economist H.Pill stressed that the UK banking system is well capitalized and reiterated that inflation should drop rapidly by year end
In the UK docket, the final Manufacturing PMI retreated to 47.9 in March (from 49.3).
If GBP/USD clears the March peak at 1.2423 (March 31) it could then challenge the 2023 high at 1.2447 (January 23) prior to the May 2022 top at 1.2666 (May 27). North from here comes the 200-week SMA at 1.2868 before the psychological 1.3000 mark. By contrast, provisional contention aligns at the 55- and 100-day SMAs at 1.2166 and 1.2133, respectively, ahead of the weekly low at 1.2010 (March 15) and the key 200-day SMA at 1.1893. The loss of the latter could put the 2023 low at 1.1802 (March 8) to the test ahead of the November 2022 low at 1.1142 (November 4). The daily RSI picked up pace and trespassed the 62 yardstick.
Resistance levels: 1.2423 1.2447 1.2666 (4H chart)
Support levels: 1.2274 1.2189 1.2113 (4H chart)
AUDUSD
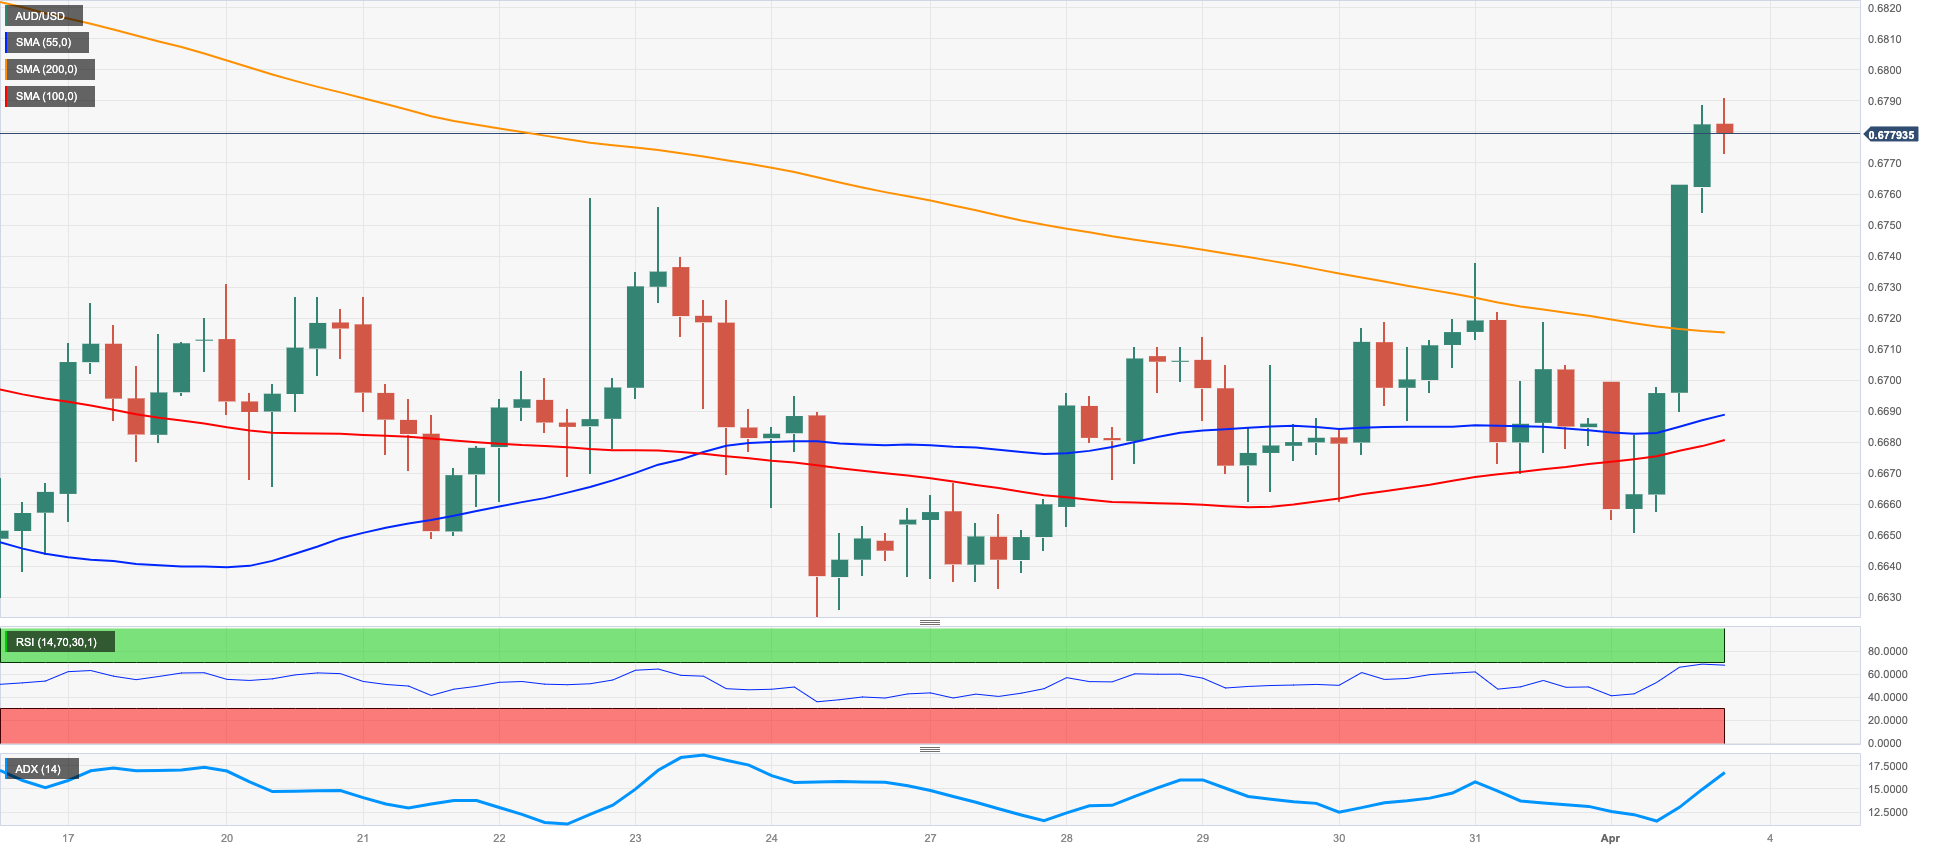
The dollar’s negative start of the week sponsored the move to fresh 5-week highs in AUD/USD, which managed to revisit the 0.6790 region on Monday.
The Aussie dollar, in the meantime, practically ignored the generalized bearish note in the commodity complex, where both copper prices and the iron ore grinded lower.
Data wise Down Under, the final Judo Bank Manufacturing PMI eased to 49.1 in March (from 50.5). In addition, preliminary Building Permits are seen expanding 4% MoM in February, while Home Loans contracted at a monthly 1.2% and Investment Lending for Homes dropped 0.5% also in February.
Considering the recent price action, next on the upside for AUD/USD now comes the temporary hurdles at the 100- and 55-day SMAs at 0.6798 and 0.6826, respectively, prior to the key round level at 0.7000 and the weekly peak at 0.7029 (February 14). On the other hand, there are no support levels of significance until the 2023 low at 0.6563 (March 10) seconded by the weekly low at 0.6386 (November 10 2022) and the November 2022 low at 0.6272 (November 3). The daily RSI leapt past the 56 mark.
Resistance levels: 0.6789 0.6848 0.6920 (4H chart)
Support levels: 0.6650 0.6625 0.6589 (4H chart)
GOLD
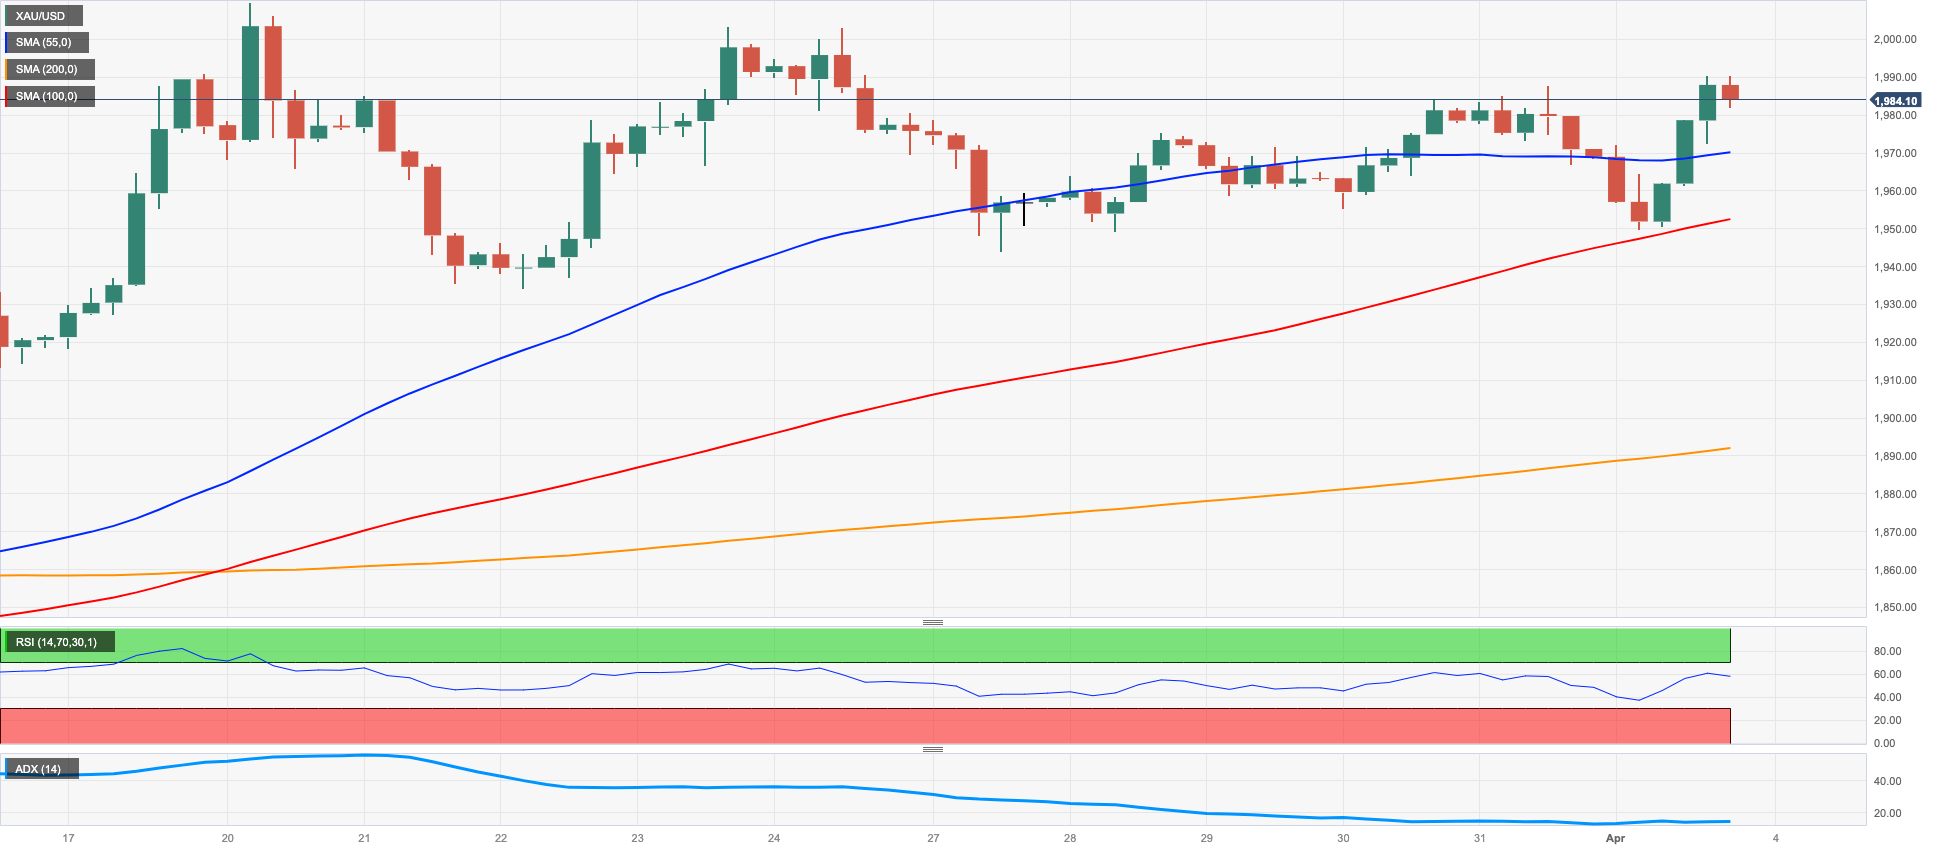
Gold prices extended the current choppy activity and not only faded Friday’s pullback but also advanced to multi-session highs around the $1990 mark per ounce troy on Monday.
The noticeable decline in the greenback in combination with the persistent retracement in US yields across the board underpinned the bounce in the precious metal, which now trades at shouting distance from the key $2000 barrier.
Moving forward, persistent hawkish messages from Fed-speakers are expected to keep bullion’s upside potential somewhat curtailed, at least until the publication of the critical US Non-farm Payrolls on April 7.
Gold bulls continue to target the 2023 high at $2009 (March 20) prior to the 2022 top at $2070 (March 8) and before the all-time peak at $2075 (August 7 2020). Having said that, there is initial support at the weekly low at $1934 (March 22) ahead of the provisional 55- and 100-day SMAs at $1896 and $1854, respectively. Once the metal breaches these levels it could then head towards the March low at $1809 (March 8) ahead of the 2023 low at $1804 (February 28) and the key 200-day SMA at $1784.
Resistance levels: $1990 $2009 $2070 (4H chart)
Support levels: $1949 $1934 $1889 (4H chart)
CRUDE WTI
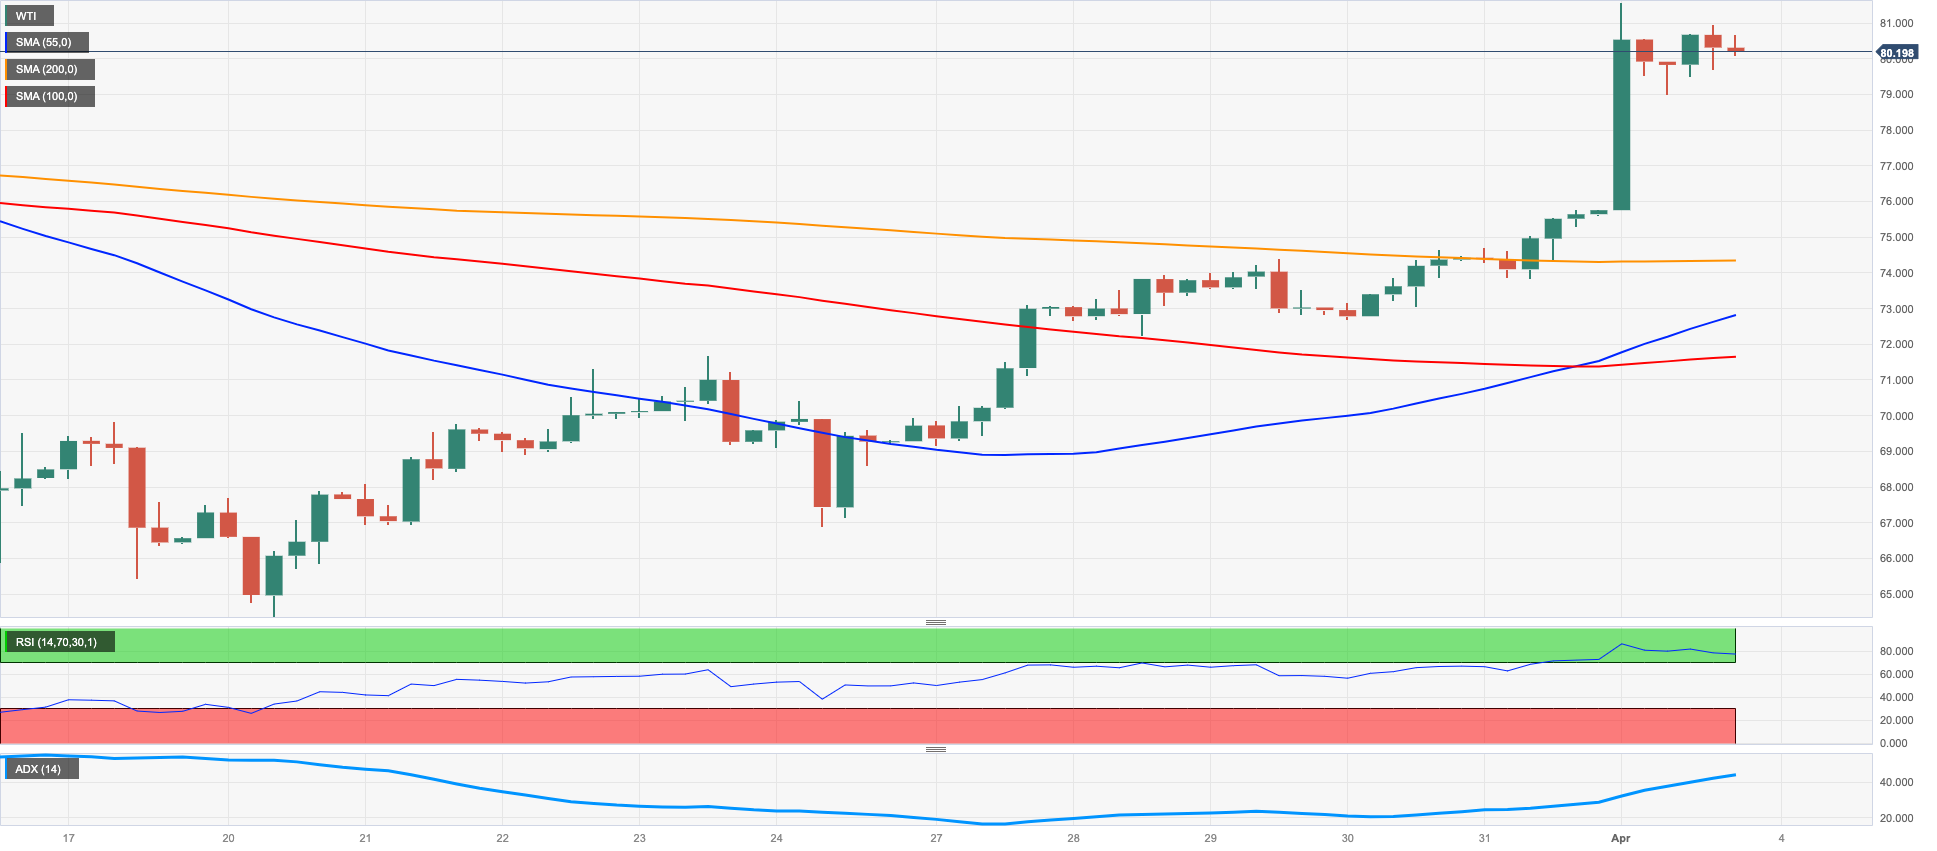
Prices of the WTI rallied more than 6% and surpassed the $81.00 mark per barrel to clinch fresh 3-month highs at the beginning of the week.
In fact, crude oil prices rapidly climbed to levels last seen back in mid-January after the OPEC+ caught markets off guard and announced on Sunday it will cut its oil output by 1.16 mbpd.
The strong rebound in the commodity was also bolstered by the weaker dollar amidst speculation that the Fed might pause its hiking cycle in May, particularly the recent weakness seen in the ISM Manufacturing for the month of March.
A sustained surpass of the $80.00 mark could motivate the WTI to challenge the 2023 top at $82.60 (January 23) prior to the December 2022 peak at $83.32 (December 1) and the November 2022 high at $93.73 (November 7). On the flip side, the 100- and 55-day SMAs at $76.95 and $76.07, respectively, should emerge as interim contention before the $66.86 level (March 24) and ahead of the 2023 low at $64.41 (March 20). The loss of the latter exposes the December 2021 low at $62.46 (December 2) seconded by the August 2021 low at $61.76 (August 23) and the key $60.00 mark per barrel.
Resistance levels: $81.51 $82.60 $83.32 (4H chart)
Support levels: $74.36 $72.57 $66.79 (4H chart)
GER40
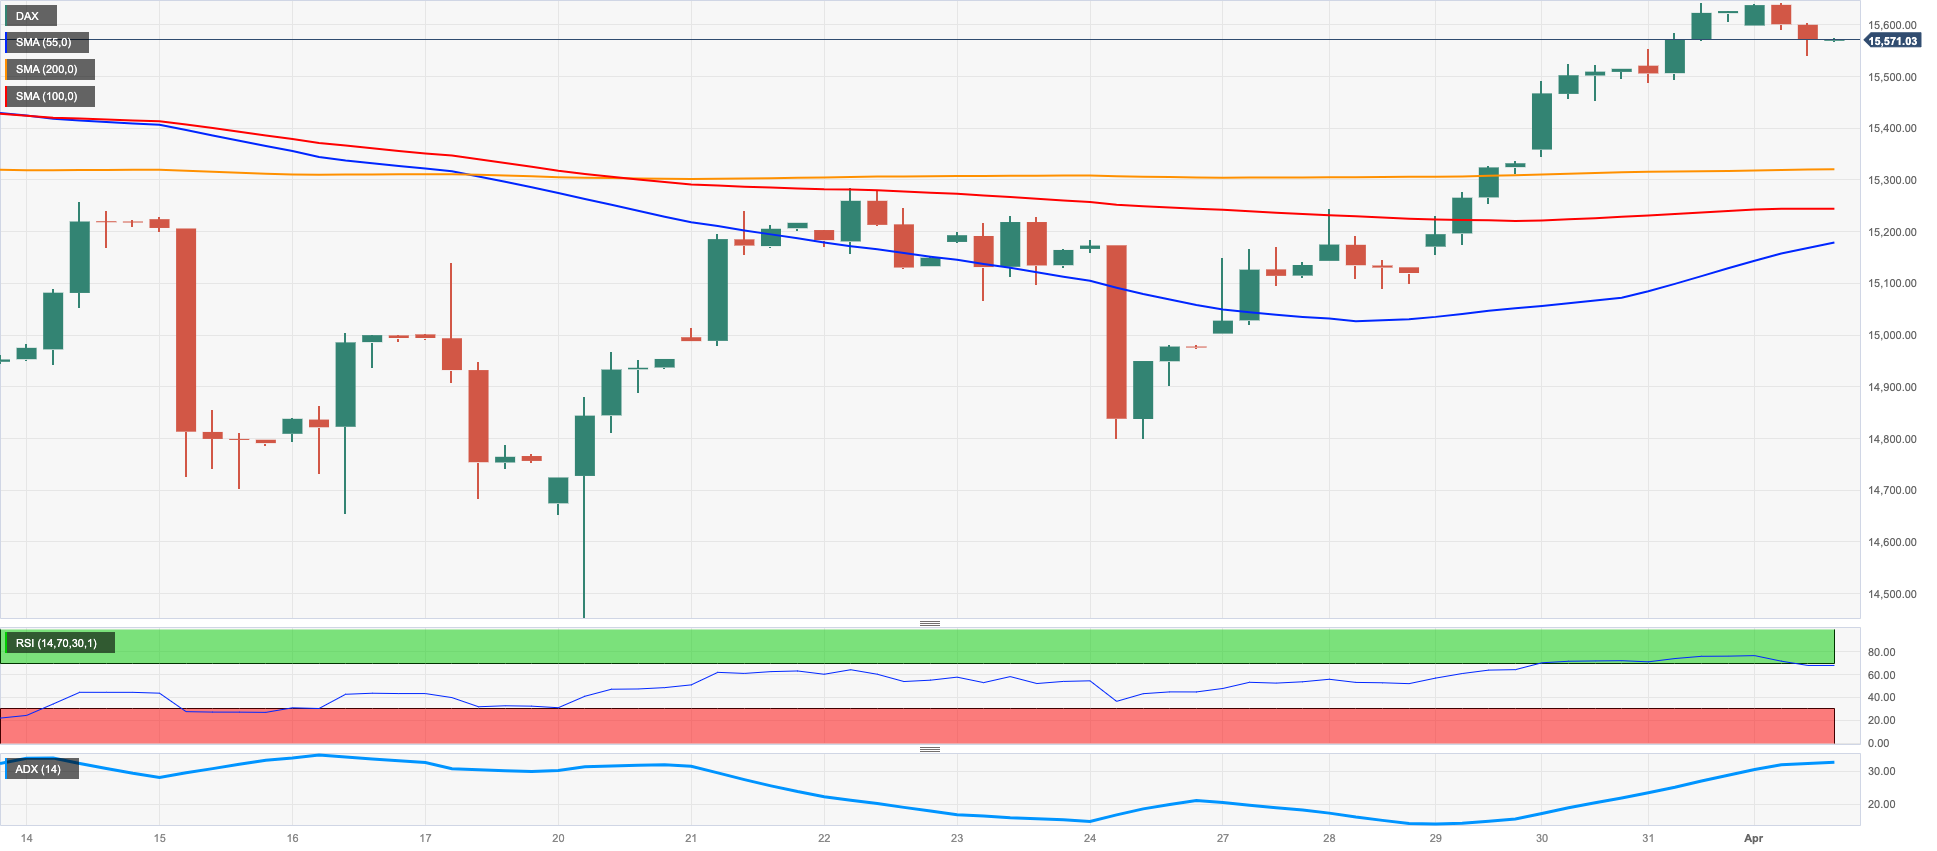
European stock markets started the new week/quarter on a mixed note, with the German reference DAX40 setting aside five consecutive daily gains and closing with modest losses around the 15600 region following an earlier move to Friday’s peaks near 15700.
Fresh inflation concerns appear to have resurfaced following the OPEC+ decision to reduce the oil output and the consequent jump in crude oil prices, while hawkish comments from ECB-speakers also weighed on investors’ sentiment.
The German 10-year Bund yields, in the meantime, followed their US peers and added to Friday’s decline, revisiting the 2.25% region.
In the docket, the final Manufacturing PMI in Germany eased to 44.7 during March, a tad above the preliminary readings.
The surpass of the March top at 15659 (March 31) could prompt the DAX40 to confront the 2023 peak at 15706 (March 6) ahead of the February 2022 high at 15736 (February 2 2022) and the round level at 16000. North from here comes the 2022 top at 16285 (January 5). On the contrary, there is interim contention at the 55- and 100-day SMAs at 15288 and 14870, respectively, ahead of the minor support at 14809 (March 24) and the March low at 14458 (March 20). The loss of this level could put the key 200-day SMA at 13945 to the test. The daily RSI lost traction and approached the 58 area.
Best Performers: Siemens Energy AG, Airbus Group, Deutsche Bank AG
Worst Performers: Sartorius AG VZO, Merck, Hannover Rueck SE
Resistance levels: 15659 15706 15736 (4H chart)
Support levels: 15170 14809 14458 (4H chart)
NASDAQ
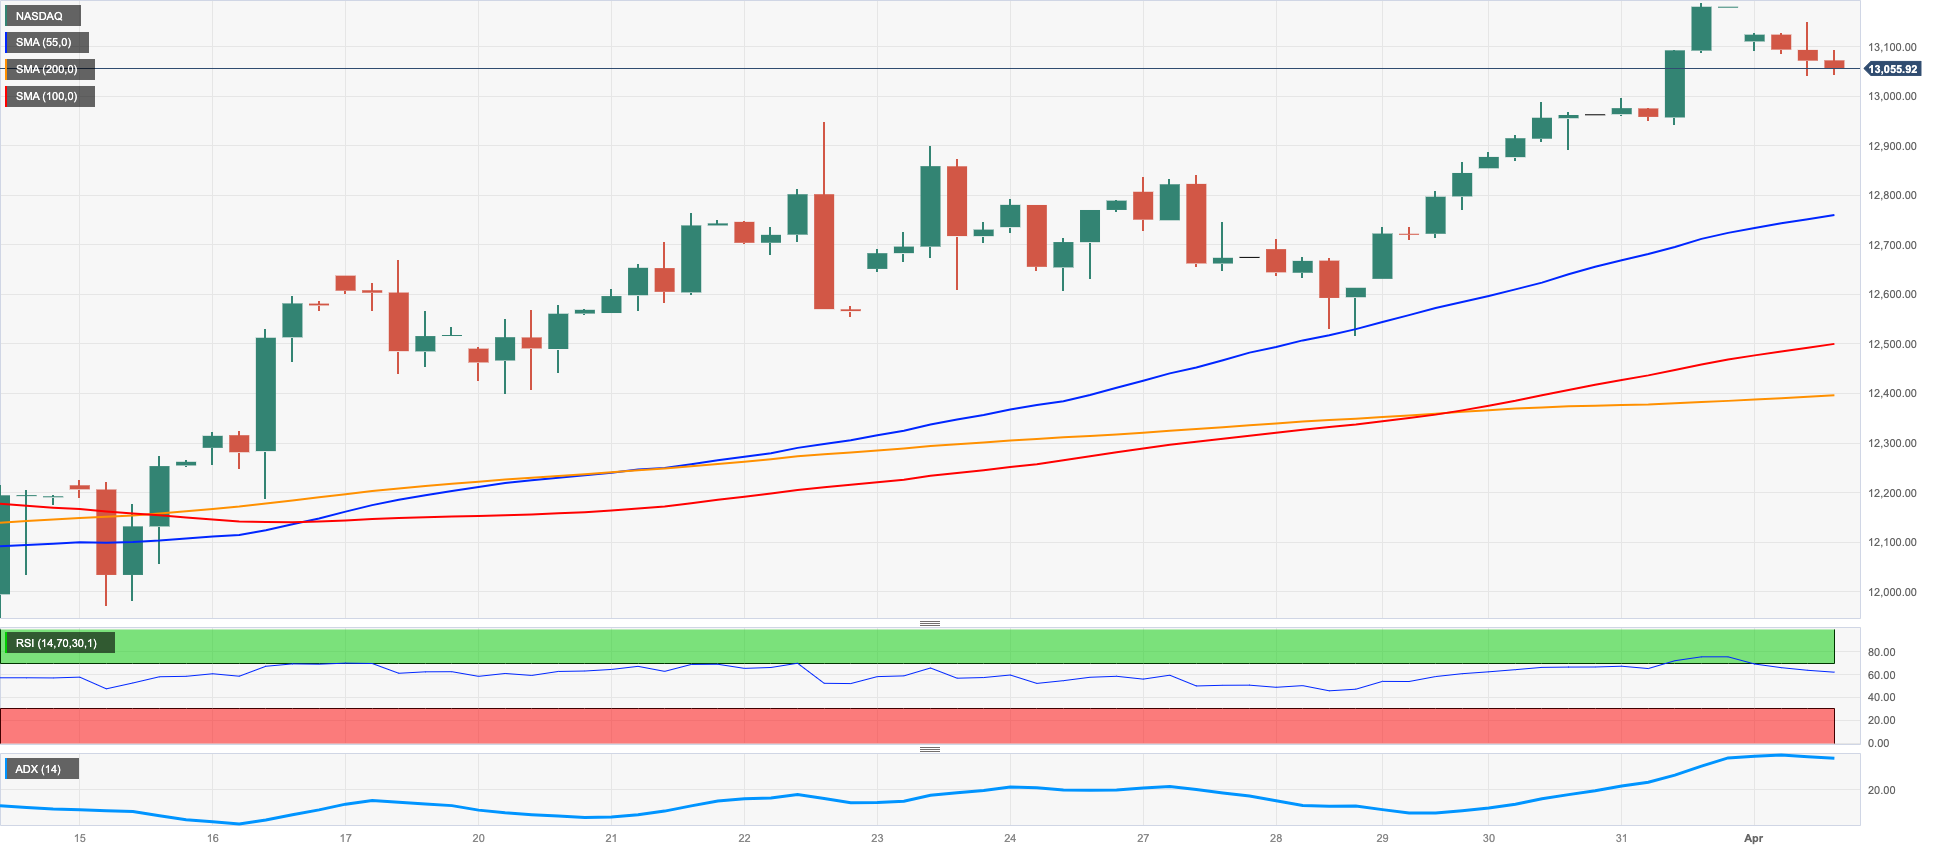
Following Friday’s new 2023 highs, the tech reference Nasdaq 100 came under pressure and returned to the vicinity of the 13000 zone at the beginning of the week.
Indeed, renewed inflation and recession jitters coupled with speculation that the Fed could now hike the interest rate by 25 bps in May have all collaborated with the pessimism around the tech sector on Monday.
In addition, Tesla’s poor performance in tandem with losses in other megacaps all kept the mood among traders depressed.
Prospects for further gains in the Nasdaq 100 remain unchanged. That said, the immediate resistance comes at the 2023 peak at 13188 (March 31) seconded by the August 2022 high at 13720 (August 16) and the round level at 14000. Further north, the index could see the March 2022 top at 15265 (March 29) revisited. The other way around, the weekly low at 12517 (March 28) turns up as the next support ahead of the provisional 55-day SMA at 12276 and the key 200-day SMA at 11936. Down from here emerges the March low at 11695 (March 13) seconded by weekly lows at 11550 (January 25) and 11251 (January 19), all before the 2023 low at 10696 (January 6). The daily RSI deflated to the 64 neighbourhood.
Top Gainers: Diamondback Energy Inc, Baker Hughes Co, Dollar Tree Inc
Top Losers: Tesla, Atlassian Corp, JD.com Inc
Resistance levels: 13188 13720 14277 (4H chart)
Support levels: 12517 11873 11695 (4H chart)
DOW JONES
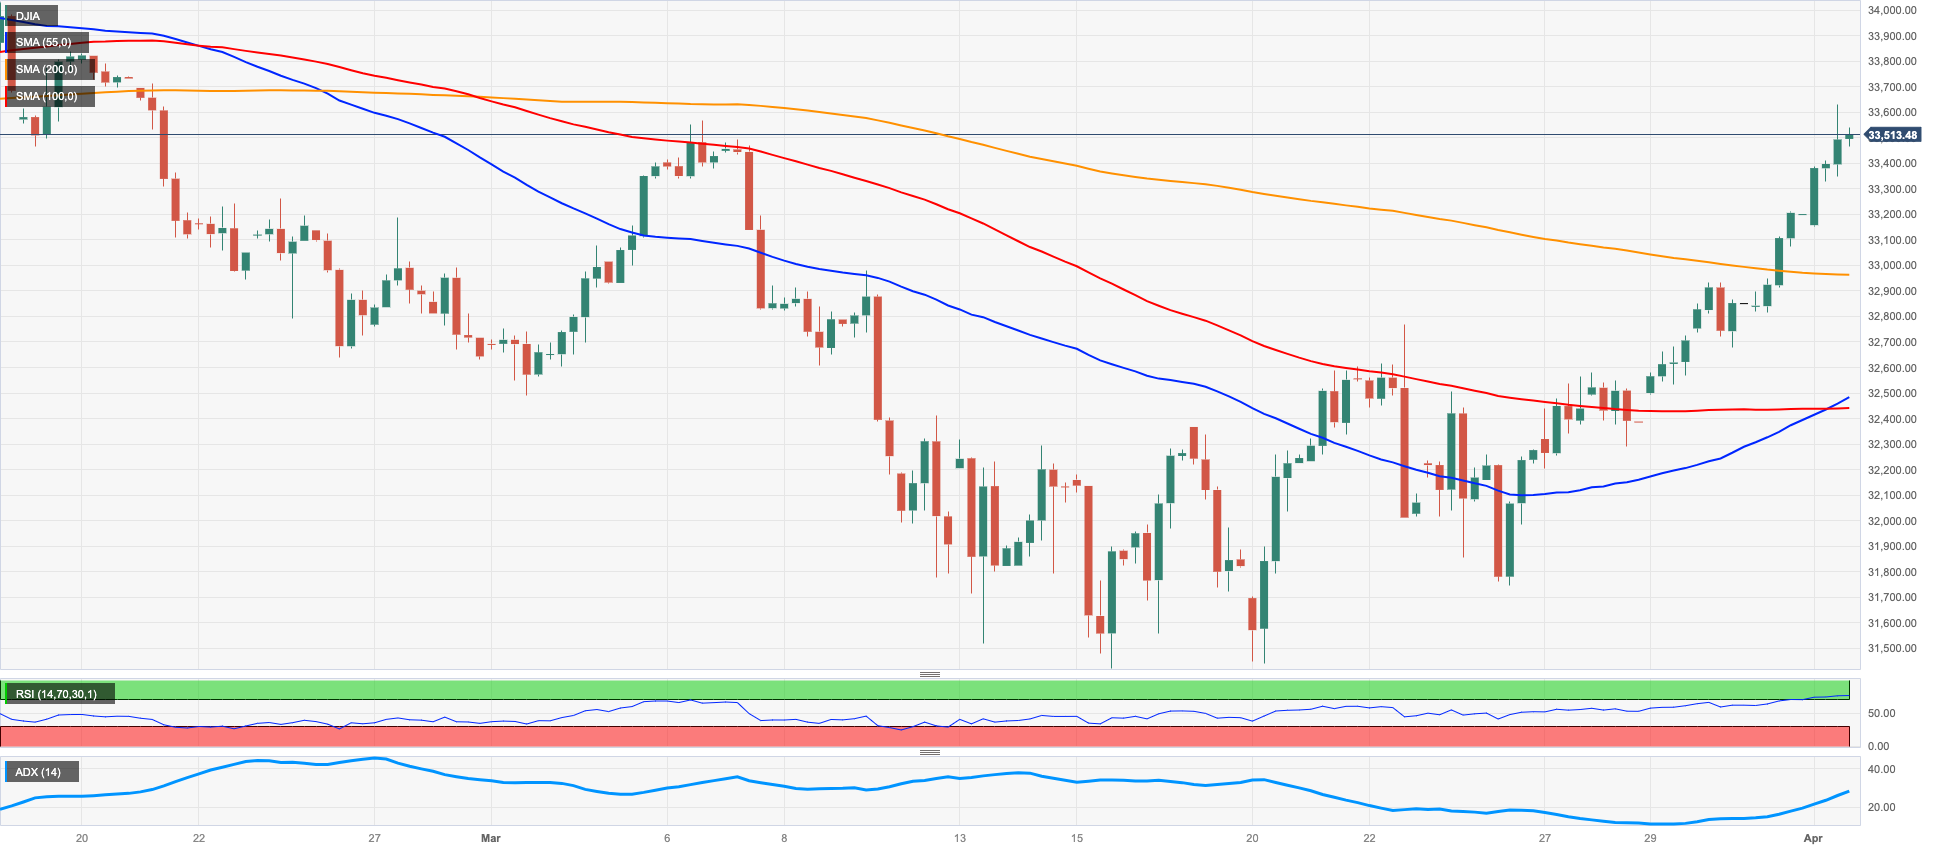
Equities measured by the Dow Jones started the new trading week in an upbeat tone and initially rose to new 2-month highs past the 33600 level on Monday, just to give away some of those gains afterwards.
The uptick in the Dow Jones came in contrast to the irresolute session in the S&P500 and the negative activity in the Nasdaq, as market participants appear to be caught in a tug-of-war between inflation concerns (reignited after higher crude oil prices post-OPEC+ meeting) and recession fears, as hinted by persistent weakness in some key US fundamentals.
Overall, the Dow Jones gained 0.82% to 33548, the S&P500 advanced 0.08% to 4112 and the tech-reference Nasdaq Composite deflated 0.82% to 12121.
The Dow Jones clocked a new peak at 33632 (April 3). The breakout of this level could put the index en route to a probable visit to the 2023 high at 34342 (January 13) ahead of the December 2022 top at 34712 (December 13). Once the latter is cleared, a move to the April 2022 peak at 35492 (April 21) could start shaping up before the February 2022 high at 35824 (February 9). Just the opposite, the breach of the key the 200-day SMA at 32403 could encourage sellers to dispute the 2023 low at 31429 (March 15) prior to the 30000 mark and the 2022 low at 28660 (October 13). The daily RSI climbed further and poked with the 62 region.
Top Performers: Chevron, UnitedHealth, Merck&Co
Worst Performers: Salesforce Inc, Microsoft, Nike
Resistance levels: 33632 34334 34712 (4H chart)
Support levels: 32550 31805 31429 (4H chart)
MACROECONOMIC EVENTS

All Information & Updates provided by:

All information relating to the financial markets available on this page has been prepared and issued by FXStreet (Forexstreet SL, Spain, Reg: B62498233) on the basis of publicly available information and all information believed to be reliable and does not conflict with Kuwaiti local laws, and all necessary care has been taken to before the company to ensure that the facts mentioned are correct from the source.
NCM Investment nor any of its directors or employees shall in any way be held responsible for the contents of this news, and the information contained on this page is intended only to provide clients with publicly available information and should not be construed as investment advice, report or analysis and/or constitute an offer or invitation to buy or sell financial instruments of any kind.
RISK WARNING: Forex and CFDs are highly risky leveraged products, as losses can exceed deposits. Please ensure you understand all the risks and take independent advice if necessary. NCM will segregate the clients based on the criteria of the regulator and its bylaws. NCM does not provide any advisory service; the material published does not constitute advice or a recommendation for a transaction in any financial instrument. NCM accepts no responsibility for any use of the content presented and any consequences of that use. Anyone acting on the information provided does so at their own risk.