
- Contact Us:
-

-

-

-


Daily Market Updates
05 Apr 2023
USDJPY
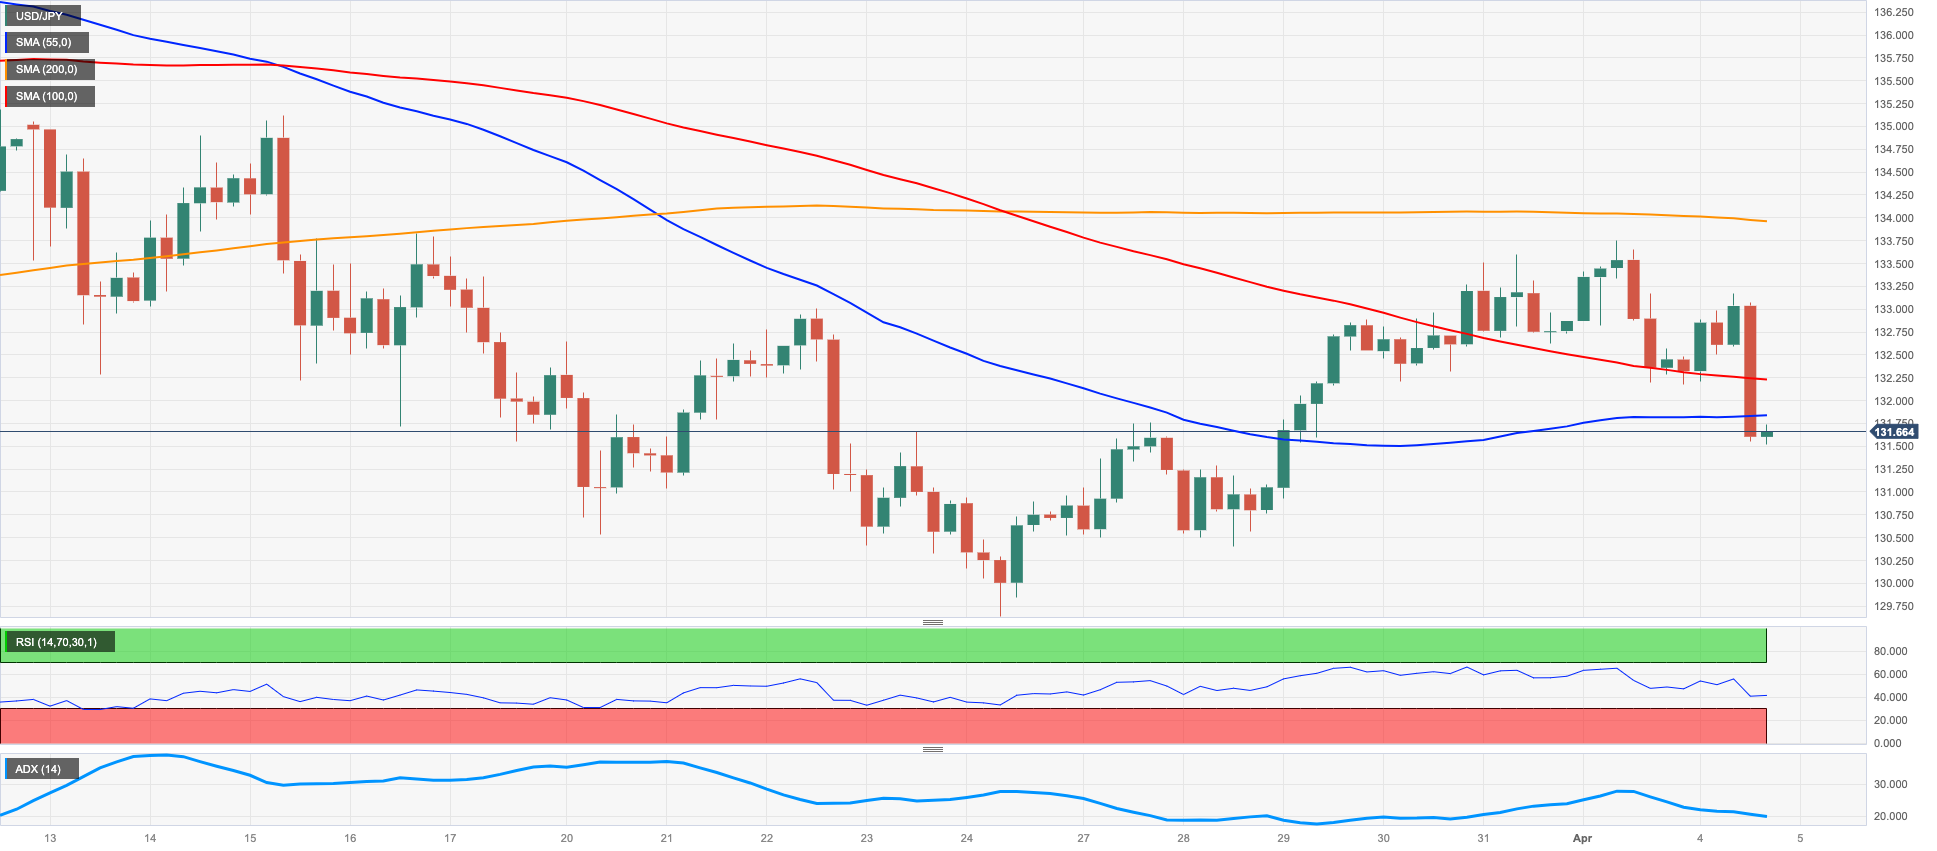
The sharp retracement in the greenback in combination with the persevering decline in US yields across the curve sponsored the second consecutive session with losses in USD/JPY, which retreated to 3-day lows near 131.50 on Tuesday.
In fact, the USD Index (DXY) accelerated its losses and dropped to fresh 2-month lows near 101.40 after US JOLTs Job Openings unexpectedly fell to levels last seen in May 2021 below the 10M job vacancies during February.
The acute pullback in the dollar was soon followed by US yields amidst now firmer speculation of an impasse in the Fed’s tightening stance in May.
In Japan, the JGB 10-year yields rose to multi-day highs near the 0.45% region, in stark contrast to the drop seen in their American peers.
There were no data releases in the Japanese docket on Tuesday, leaving the attention to Wednesday’s release of the final Services PMI for the month of March.
If USD/JPY surpasses the weekly peak at 133.75 (April 3), it could put a potential visit to the key 200-day SMA at 137.27 back on the investors’ radar prior to the 2023 high at 137.91 (March 8). Extra gains from here could see the weekly top at 139.89 (November 30 2022) revisited ahead of another weekly peak at 142.25 (November 21 2022). By contrast, the pair should meet initial support at the March low at 129.63 (March 24) before the February low at 128.08 (February 2) and the 2023 low at 127.21 (January 16). The daily RSI receded markedly below the 44 level.
Resistance levels: 133.75 134.00 135.11 (4H chart)
Support levels: 131.52 130.40 129.63 (4H chart)
GBPUSD
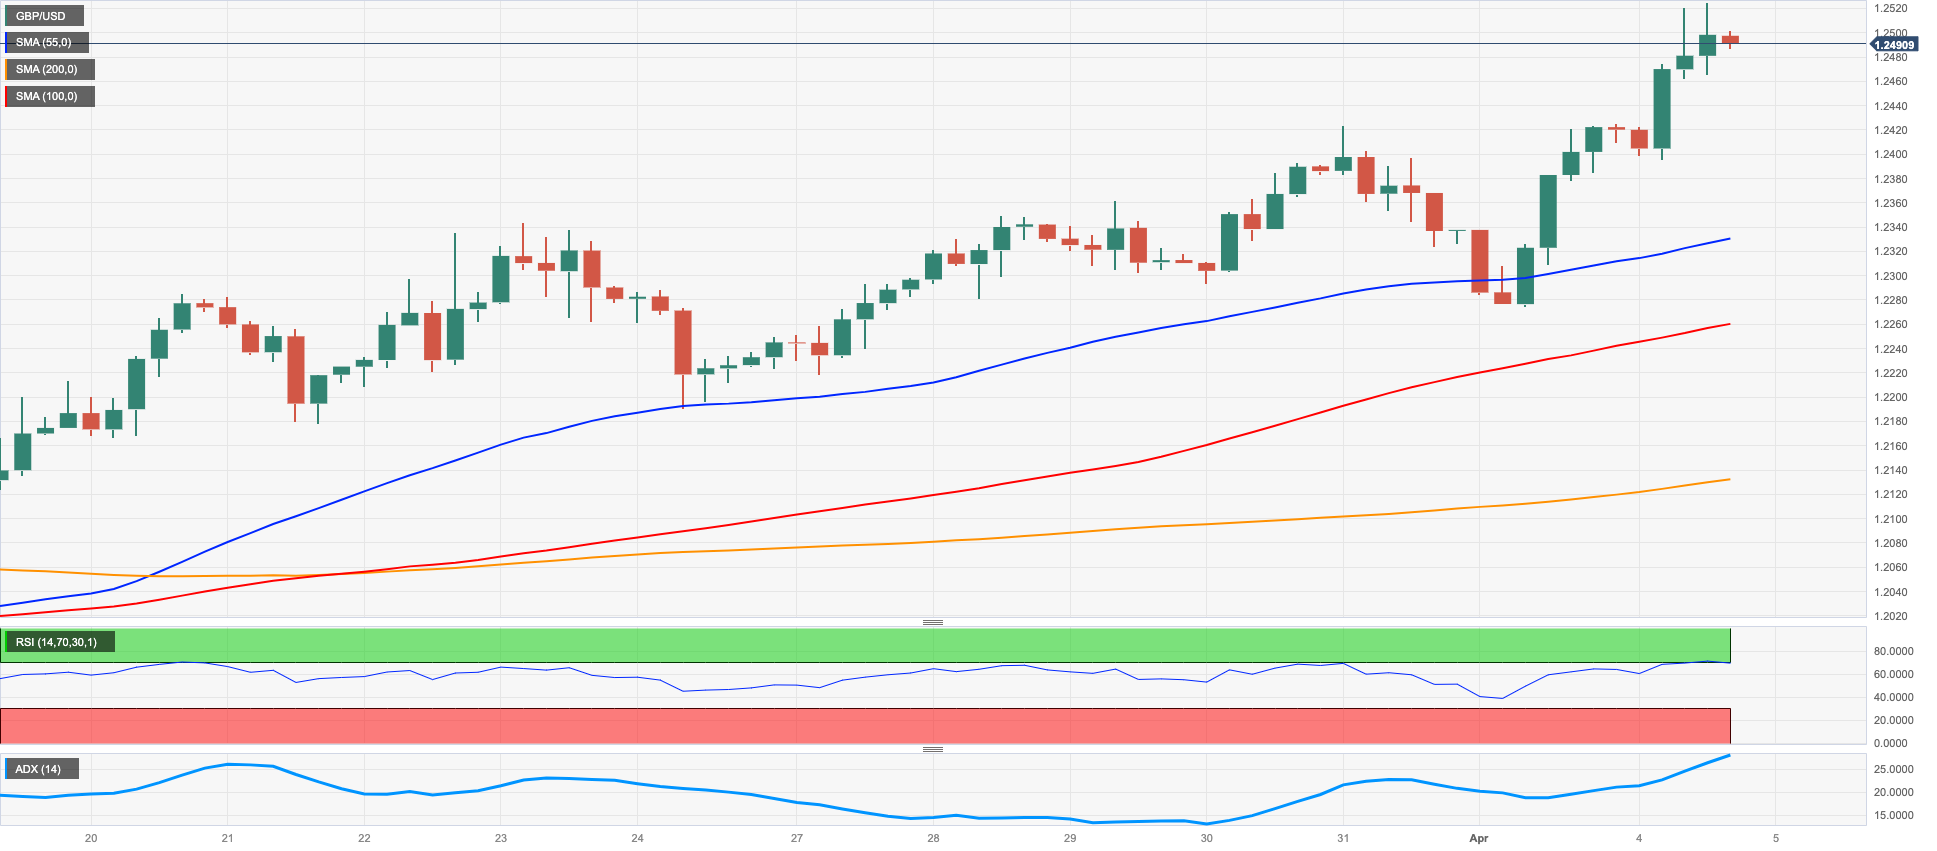
GBP/USD rose sharply and surpassed the 1.2500 barrier for the first time since June 2022 and met some initial resistance near 1.2530 on Tuesday.
The marked advance in the Sterling was almost exclusively in response to the persevering decline in the greenback, which dragged the USD Index (DXY) well below the 102.00 support.
The better tone in the risk-linked galaxy did not meet a follow through in the UK bond market, where the 10-year Gilt yields remained on the defensive near the 3.40% zone.
Nothing scheduled data wise in the UK calendar other than the speech by BoE’s MPC member S.Tenreyro (dove), who favoured a looser monetary policy stance to meet the inflation target (what?). She insisted on the view that to avoid a large inflation undershoot, the BoE should reverse its policy stance faster and earlier. She also suggested that inflation will substantially drop below the bank’s goal.
In addition, her colleague H. Pill reiterated that inflation in the UK remains unacceptable high, at the time when he added that there is still a significant amount of policy in store to come through. Pill said his decision on rates will hinge on the data flow and its interpretation in the forecast.
Immediately to the upside for GBP/USD now aligns the April high at 1.2525 (April 4) ahead of the May 2022 top at 1.2666 (May 27) and the 200-week SMA at 1.2868, which precedes the psychological 1.3000 hurdle. On the opposite side, the 55- and 100-day SMAs at 1.2170 and 1.2140, respectively, are expected to offer interim contention before the weekly low at 1.2010 (March 15) and the key 200-day SMA at 1.1895. south from here emerges the 2023 low at 1.1802 (March 8) prior to the November 2022 low at 1.1142 (November 4). The daily RSI jumped to the boundaries of the 66 yardstick.
Resistance levels: 1.2525 1.2599 1.2666 (4H chart)
Support levels: 1.2394 1.2274 1.2189 (4H chart)
AUDUSD
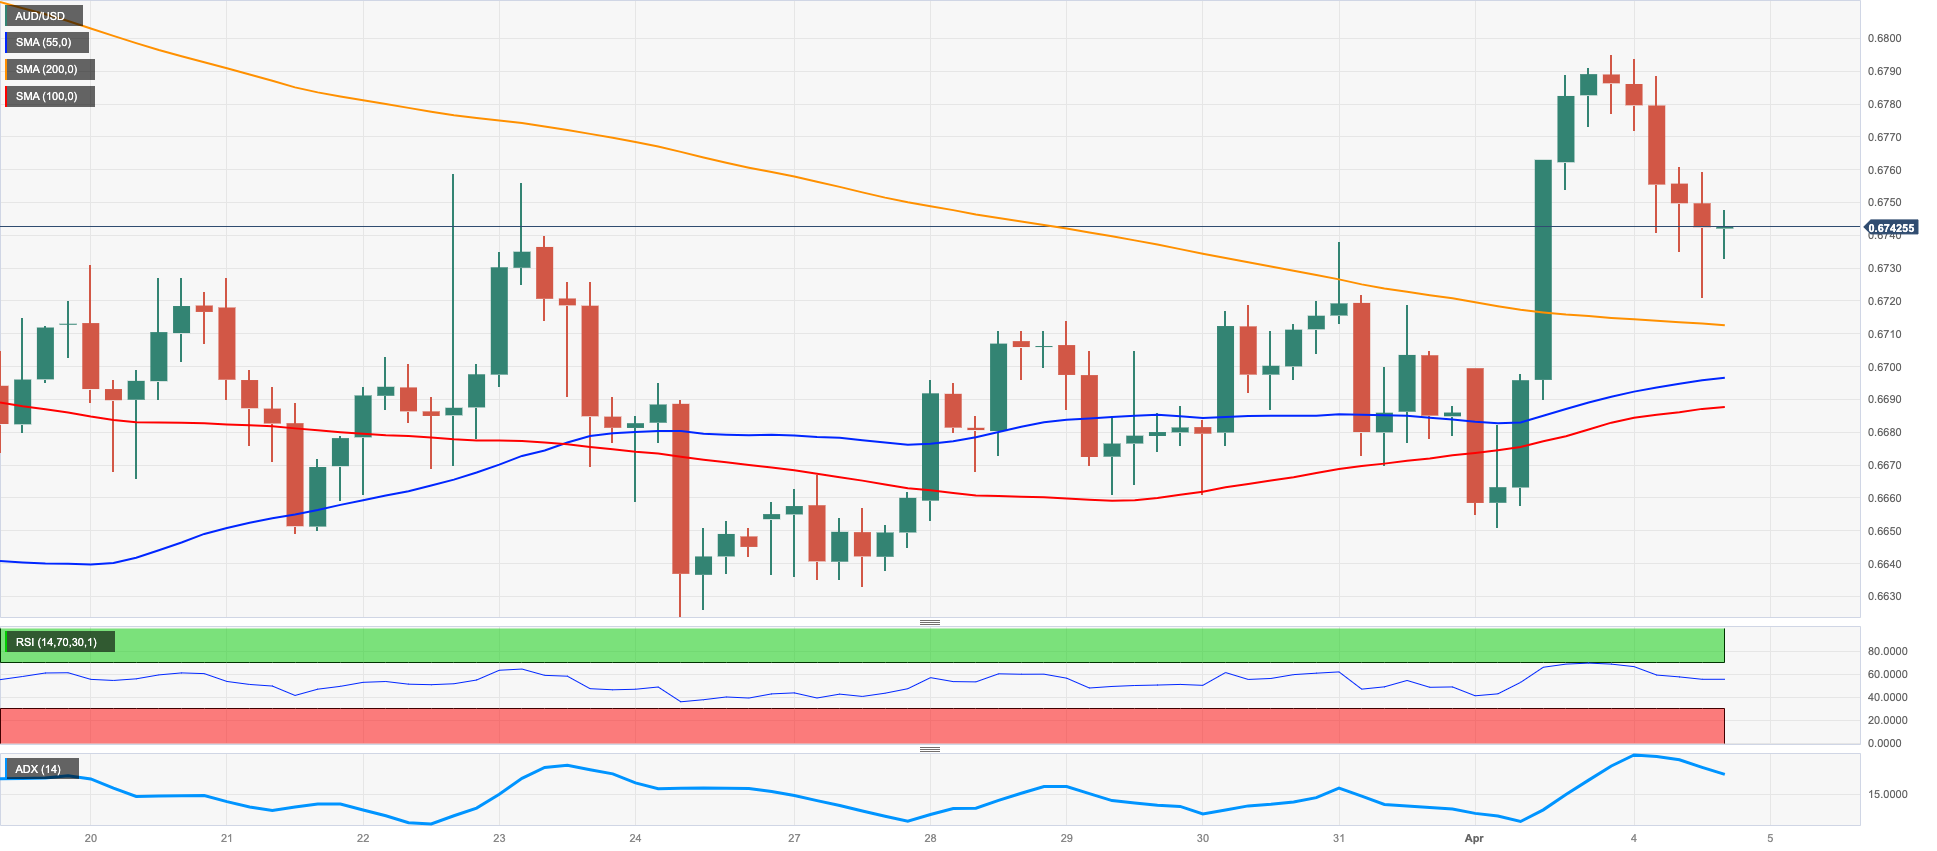
Following the strong uptick seen at the beginning of the week, AUD/USD trimmed part of that advance and returned to the low-0.6700s, although not before climbing to fresh peaks in levels just shy of the 0.6800 barrier on Tuesday.
The Aussie dollar utterly ignored the pronounced drop in the dollar and succumbed to the dovish tone from the RBA at its meeting early in the Asian session, which prompted sellers to return to the market and drag spot lower.
Further weakness for the AUD also came from the broad-based negative session in the commodity universe – again, despite the much weaker buck - where the iron ore and copper extended recent losses.
Indeed, the RBA left the OCR unchanged at 3.60% at its gathering on Tuesday, halting 10 consecutive meetings where the central bank hiked rates. In its statement, the RBA noted it needs more time to assess the impact of the hiking cycle given the lags in play when it comes to monetary policy. In addition, the central bank reiterated that future rate decisions remain data dependent and left the door open to further increases in the OCR in case of need.
AUD/USD now faces the next up-barrier at the April peak at 0.6793 (April 4) ahead of provisional levels at the 100- and 55-day SMAs at 0.6798 and 0.6822, respectively. The surpass of this region could prompt the pair to dispute the key round level at 0.7000 ahead of the weekly high at 0.7029 (February 14). Oppositely, the resumption of the bearish trend should not meet any support of note before the 2023 low at 0.6563 (March 10) prior to the weekly low at 0.6386 (November 10 2022) and the November 2022 low at 0.6272 (November 3). The daily RSI dropped to the boundaries of 51.
Resistance levels: 0.6793 0.6848 0.6920 (4H chart)
Support levels: 0.6720 0.6650 0.6625 (4H chart)
GOLD
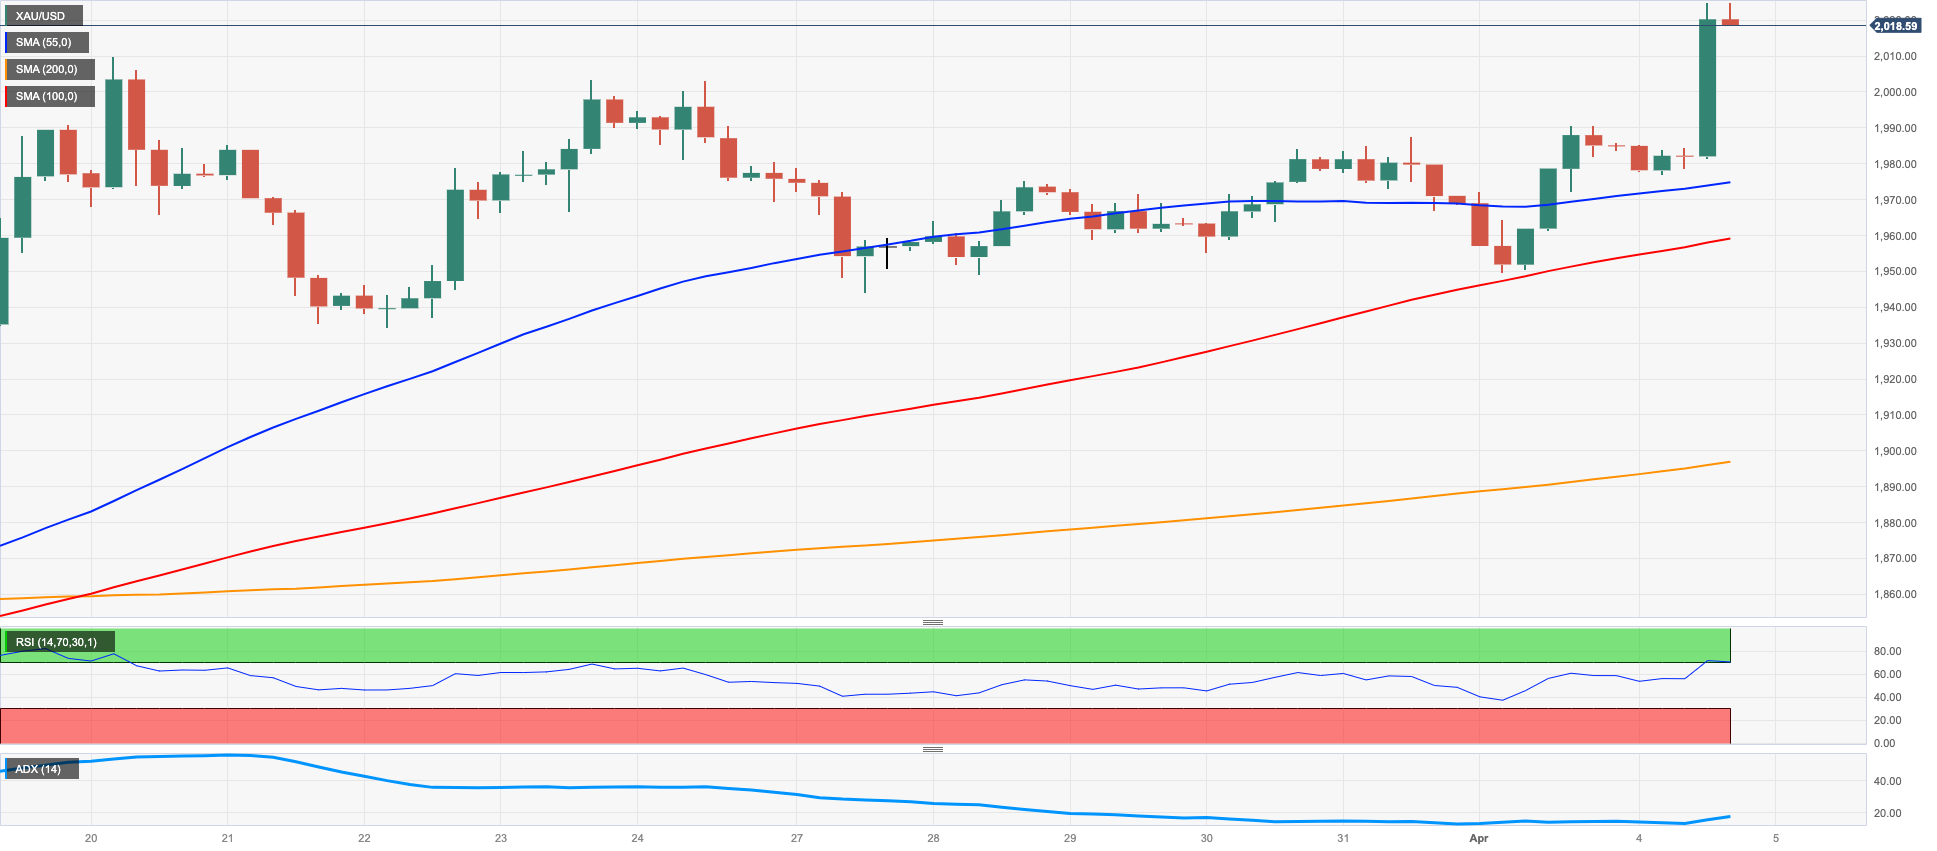
A dreadful session in the dollar as well as solid risk appetite trends fueled the upside in the precious metal to fresh YTD peaks around $2025 per ounce troy on turnaround Tuesday.
The intense sell-off in the dollar forced the USD Index (DXY) to revisit multi-week lows, while the continuation of the downward bias in US yields across the curve also kept bullion’s price action well on the bid side.
In the meantime, bullion is expected to keep monitoring messages from Fed’s rate setters amidst now rising speculation of a 25 bps rate hike at the May event. In addition, fresh inflation concerns – particularly exacerbated after the OPEC+ decision to reduce the oil output on Sunday – should keep the yellow metal bid in the very near term at least.
The 2023 top at $2025 (April 4) now emerges as the next level of note for gold ahead of the 2022 peak at $2070 (March 8) and the all-time high at $2075 (August 7 2020). On the other hand, the weekly low at $1934 (March 22) should offer initial support prior to the interim 55- and 100-day SMAs at $1897 and $1854, respectively. The loss of this region could prompt the March low at $1809 (March 8) to emerge on the horizon before the 2023 low at $1804 (February 28) and the key 200-day SMA at $1785.
Resistance levels: $2025 $2070 $2075 (4H chart)
Support levels: $1949 $1934 $1889 (4H chart)
CRUDE WTI
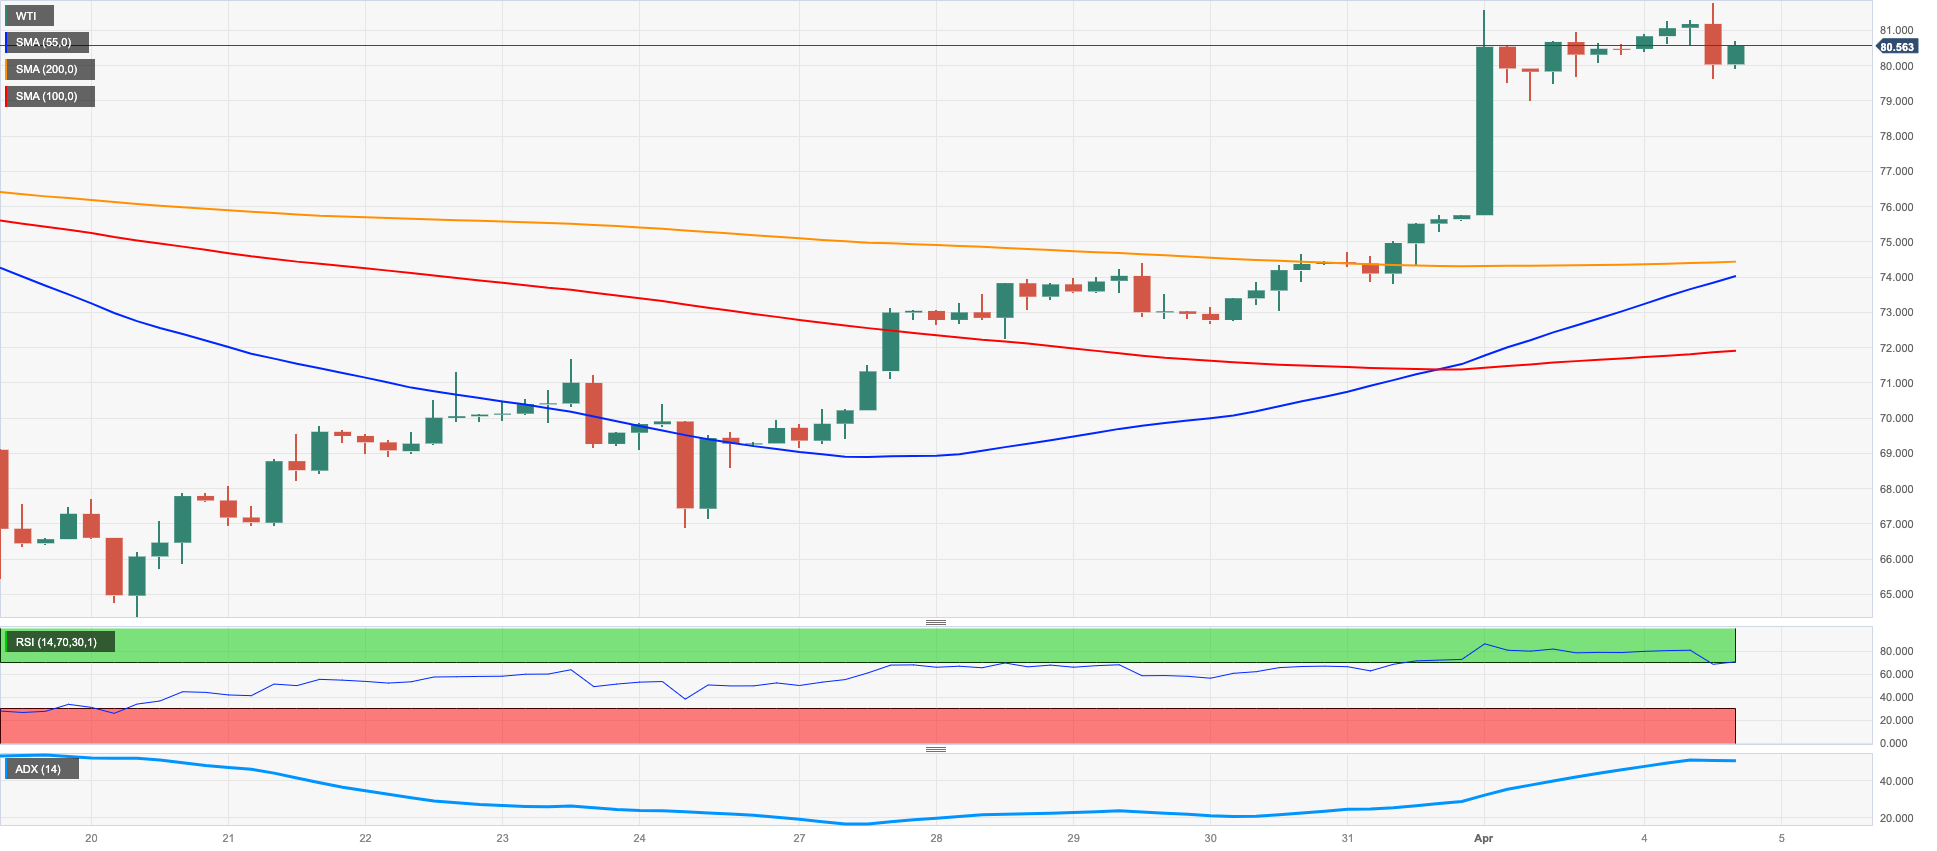
The rally in crude oil prices seems to have met a solid resistance just below the $82.00 mark per barrel on Tuesday.
Indeed, the commodity showed some signs of exhaustion following Monday’s post-OPEC+ jump as traders cashed up part of those gains, while the marked pullback in the dollar somehow limited the downside.
Moving forward, dynamics around crude oil are expected to mostly hover around the progress of the Chinese reopening vs. the expected loss of momentum in the US and EMU economies, all in response to the multi-month tightening cycle by major central banks.
Later in the session, the API will report on US crude oil supplies in the week to March 31 ahead of Wednesday’s report by the DoE.
The breakout of the April top at $81.75 (April 4) could open the door to a potential visit to the 2023 peak at $82.60 (January 23) ahead of the December 2022 high at $83.32 (December 1) and the November 2022 top at $93.73 (November 7). In opposition, there is an immediate support at the April low at $79.05 (April 3) before the provisional 100- and 55-day SMAs at $76.86 and $76.06, respectively. A deeper pullback could see the $66.86 level (March 24) revisited prior to the 2023 low at $64.41 (March 20) and the December 2021 low at $62.46 (December 2).
Resistance levels: $81.75 $82.60 $83.32 (4H chart)
Support levels: $78.97 $74.43 $72.57 (4H chart)
GER40
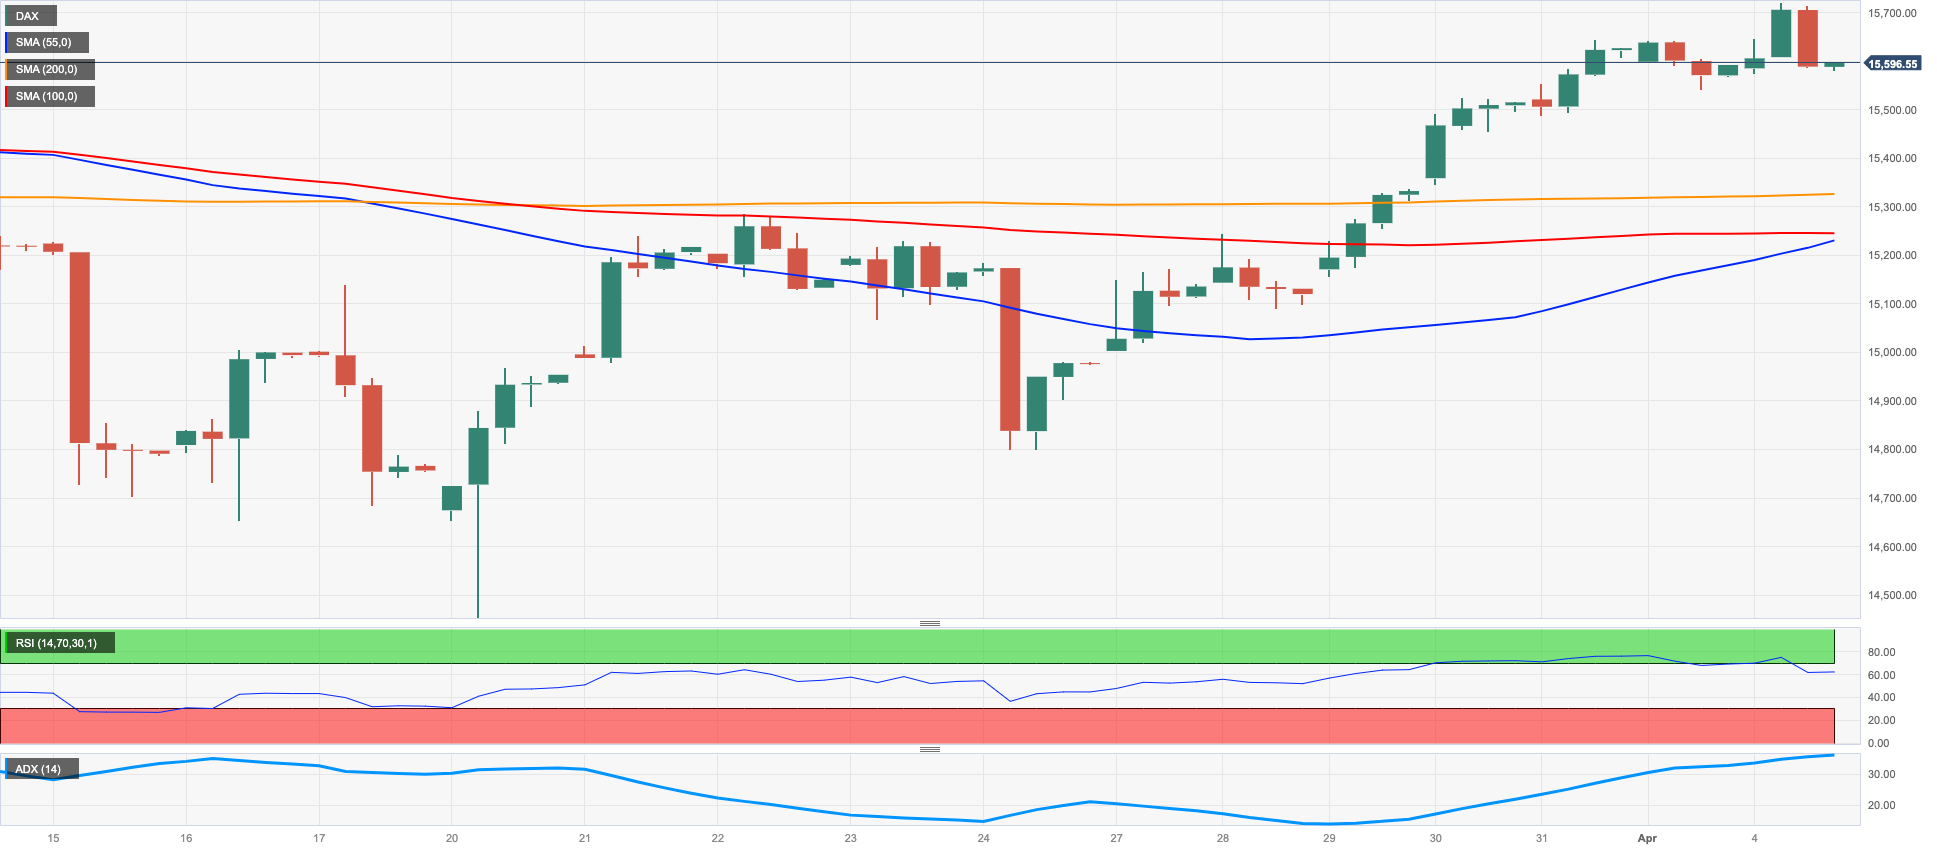
German equities measured by the reference DAX40 advanced to new highs past the 15700 region for the first time since February 2022 on Tuesday.
The bid bias in the German market contrasted to the poor performance seen in other European peers, as inflation concerns and further tightening by the ECB kept weighing on sentiment.
Also collaborating with the upbeat mood around the DAX40, February’s trade surplus in Germany came at €16B, with Exports surprisingly expanding at a monthly 4%.
Still on the positive side, the Joint Economic Forecasts sawe the German economy expanding 0.1% in the January-March period following a 0.4% decline in Q4 2022. In addition, the projections also pointed to a 0.3% growth this year and 1.5% in 2024. Regarding inflation, the five economic institutes which elaborate the Joint Economic Forecasts predicted consumer prices rising 6.0% in 2023 and 2.4% during the next year.
In the debt market, the 10-year Bund yields added to the ongoing weakness and eased below the 2.25% region.
Immediately to the upside in the DAX40 now emerges the April peak at 15736 (April 4). Extra gains from here could see the round level at 16000 revisited ahead of the 2022 high at 16285 (January 5). Just the opposite, provisional support levels align at the 55- and 100-day SMAs at 15295 and 14883, respectively, prior to the minor support at 14809 (March 24) and the March low at 14458 (March 20). Down from here, the index could retest the key 200-day SMA at 13957. The daily RSI advanced slightly to the boundaries of 59.
Best Performers: Merck, Henzel VZO, E.ON SE
Worst Performers: Deutsche Bank AG, RWE AG ST, Infineon
Resistance levels: 15736 15912 16090 (4H chart)
Support levels: 15196 14809 14458 (4H chart)
NASDAQ
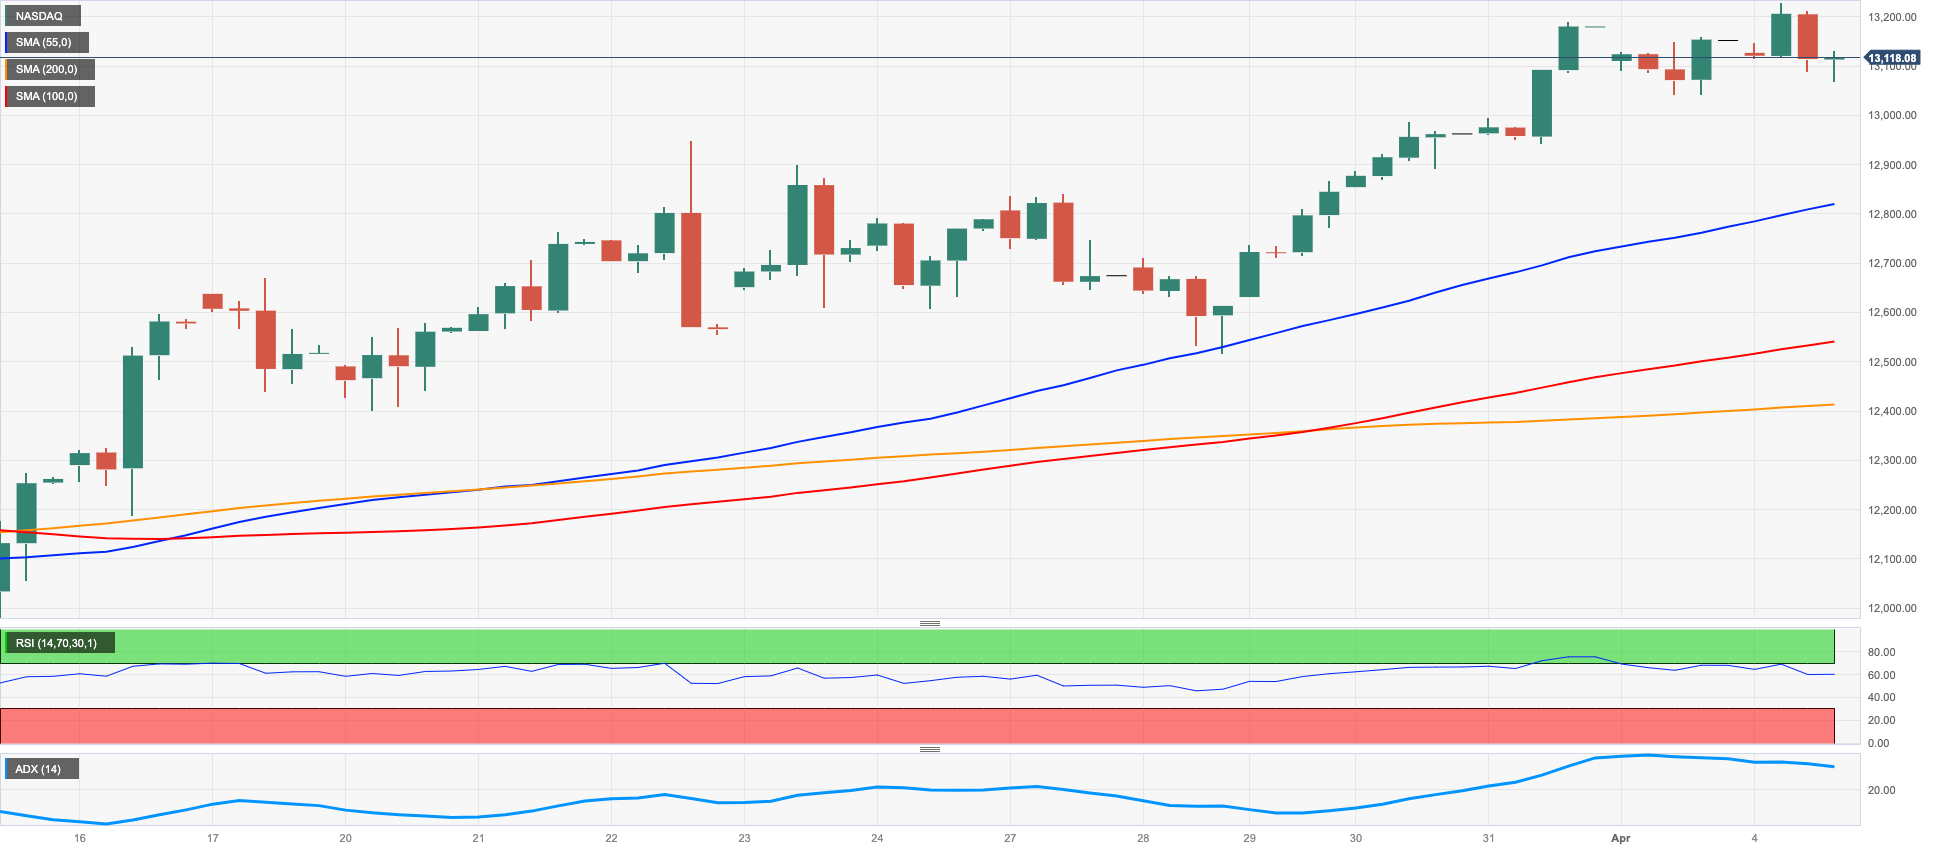
US tech equities measured by the benchmark Nasdaq 100 extended the pessimism in the first half of the week and added to Monday’s losses, revisiting at the same time the 13000 neighbourhood.
Renewed jitters surrounding a potential recession in the US economy weighed on investors’ sentiment and offset another pullback in the greenback as well as further weakness in US yields, which is usually supportive of the tech sector.
The Nasdaq 100 seems to have met a tough hurdle near the 13200 region so far. Against that, a surpass of the 2023 high at 13204 (April 4) could pave the way for a move to the August 2022 top at 13720 (August 16) ahead of the round level at 14000 and the March 2022 peak at 15265 (March 29). On the contrary, there is an initial support at the weekly low at 12517 (March 28) followed by the interim 55-day SMA at 12306 and the key 200-day SMA at 11946. Once the latter is cleared, the index could dispute the March low at 11695 (March 13) prior to weekly lows at 11550 (January 25) and 11251 (January 19) and ahead of the 2023 low at 10696 (January 6). The daily RSI lost momentum and slipped back to the 65 region.
Top Gainers: Electronic Arts, Atlassian Corp, Warner Bros Discovery Inc
Top Losers: Sirius XM Holdings Inc, Charter Communications Inc, Baker Hughes Co
Resistance levels: 13204 13720 14277 (4H chart)
Support levels: 12517 11884 11695 (4H chart)
DOW JONES
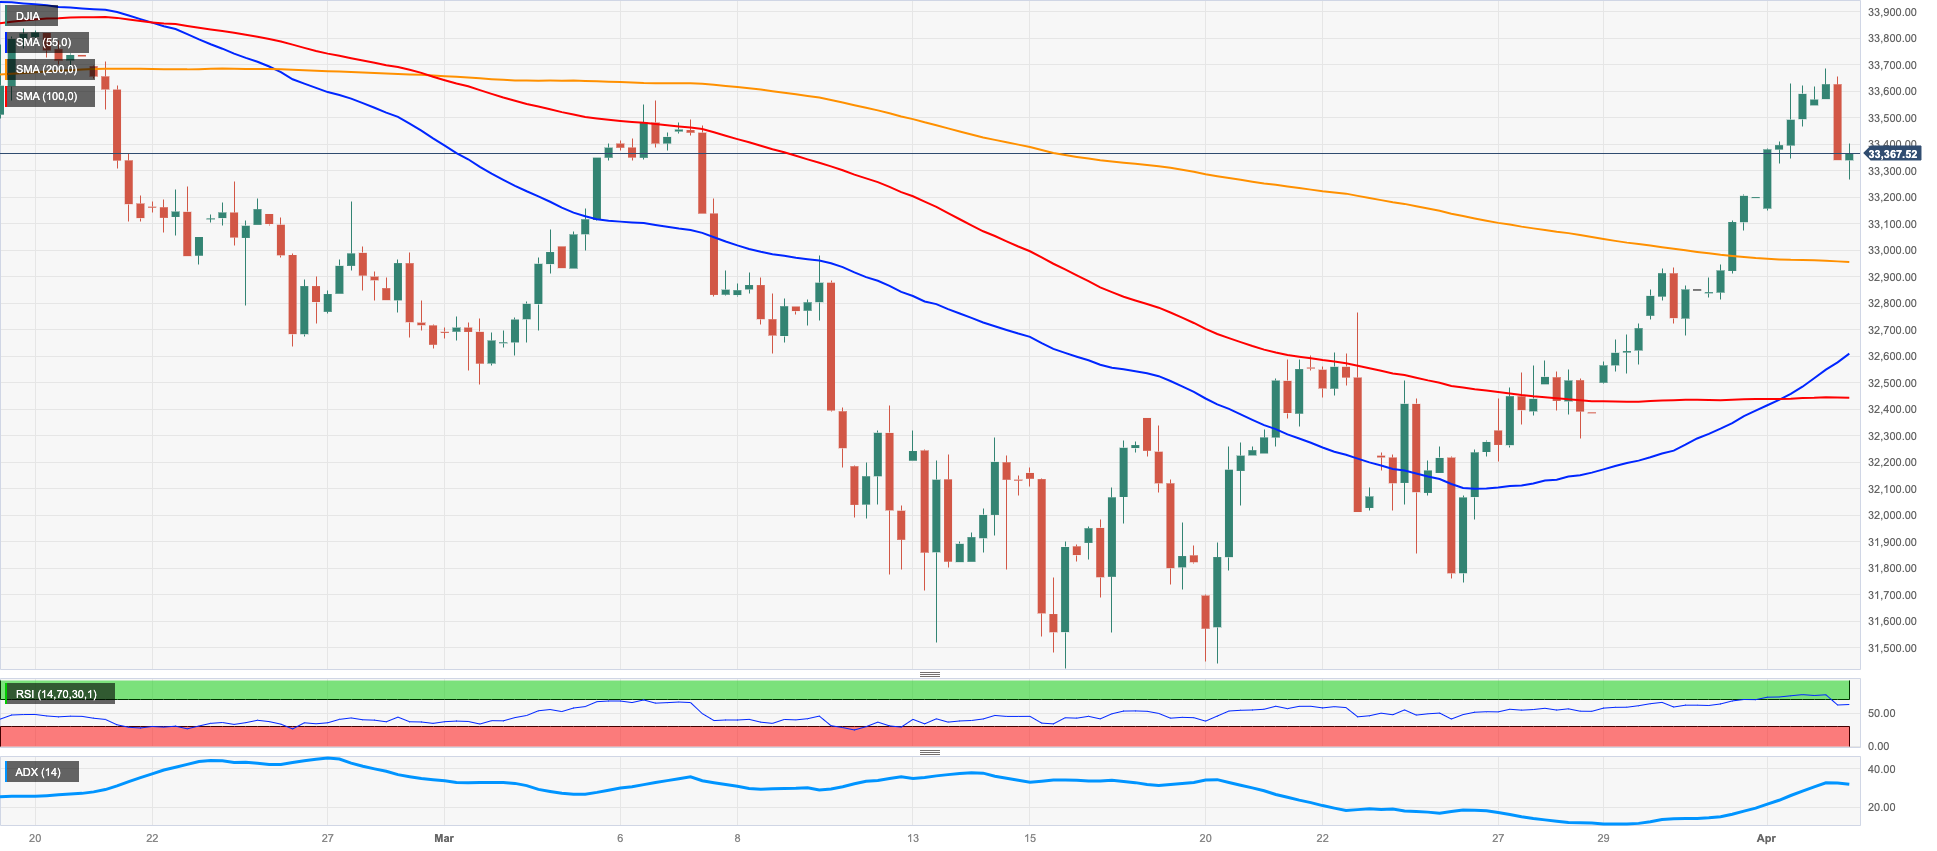
The US stock benchmark Dow Jones reversed four straight sessions with gains and retreated markedly following another test of recent peaks near 33600 on Tuesday.
All three major US stocks indices traded on the back foot on Tuesday against the backdrop of renewed recession fears, which were particularly reignited after further signs of the loss of momentum in US fundamentals, this time following discouraging prints from Factory Orders and job vacancies.
On the whole, the Dow Jones retreated 0.71% to 33368, the S&P500 dropped 0.59% to 4100 and the tech-heavy Nasdaq Composite lost 0.55% to 12123.
If the Dow Jones breaks above the April high at 33634 (April 4) it could then open the door to a potential test to the 2023 top at 34342 (January 13) prior to the December 2022 peak at 34712 (December 13). North from here comes the April 2022 high at 35492 (April 21) seconded by the February 2022 top at 35824 (February 9). On the flip side, the key 200-day SMA at 32421 is expected to offer decent contention ahead of the 2023 low at 31429 (March 15), which precedes the 30000 mark and the 2022 low at 28660 (October 13). The daily RSI deflated to the vicinity of 59.
Top Performers: Amgen, Nike, Procter&Gamble
Worst Performers: Caterpillar, Travelers, 3M
Resistance levels: 33634 34334 34712 (4H chart)
Support levels: 32567 31805 31429 (4H chart)
MACROECONOMIC EVENTS

All Information & Updates provided by:

All information relating to the financial markets available on this page has been prepared and issued by FXStreet (Forexstreet SL, Spain, Reg: B62498233) on the basis of publicly available information and all information believed to be reliable and does not conflict with Kuwaiti local laws, and all necessary care has been taken to before the company to ensure that the facts mentioned are correct from the source.
NCM Investment nor any of its directors or employees shall in any way be held responsible for the contents of this news, and the information contained on this page is intended only to provide clients with publicly available information and should not be construed as investment advice, report or analysis and/or constitute an offer or invitation to buy or sell financial instruments of any kind.
RISK WARNING: Forex and CFDs are highly risky leveraged products, as losses can exceed deposits. Please ensure you understand all the risks and take independent advice if necessary. NCM will segregate the clients based on the criteria of the regulator and its bylaws. NCM does not provide any advisory service; the material published does not constitute advice or a recommendation for a transaction in any financial instrument. NCM accepts no responsibility for any use of the content presented and any consequences of that use. Anyone acting on the information provided does so at their own risk.