
- Contact Us:
-

-

-

-


Daily Market Updates
06 Apr 2023
USDJPY
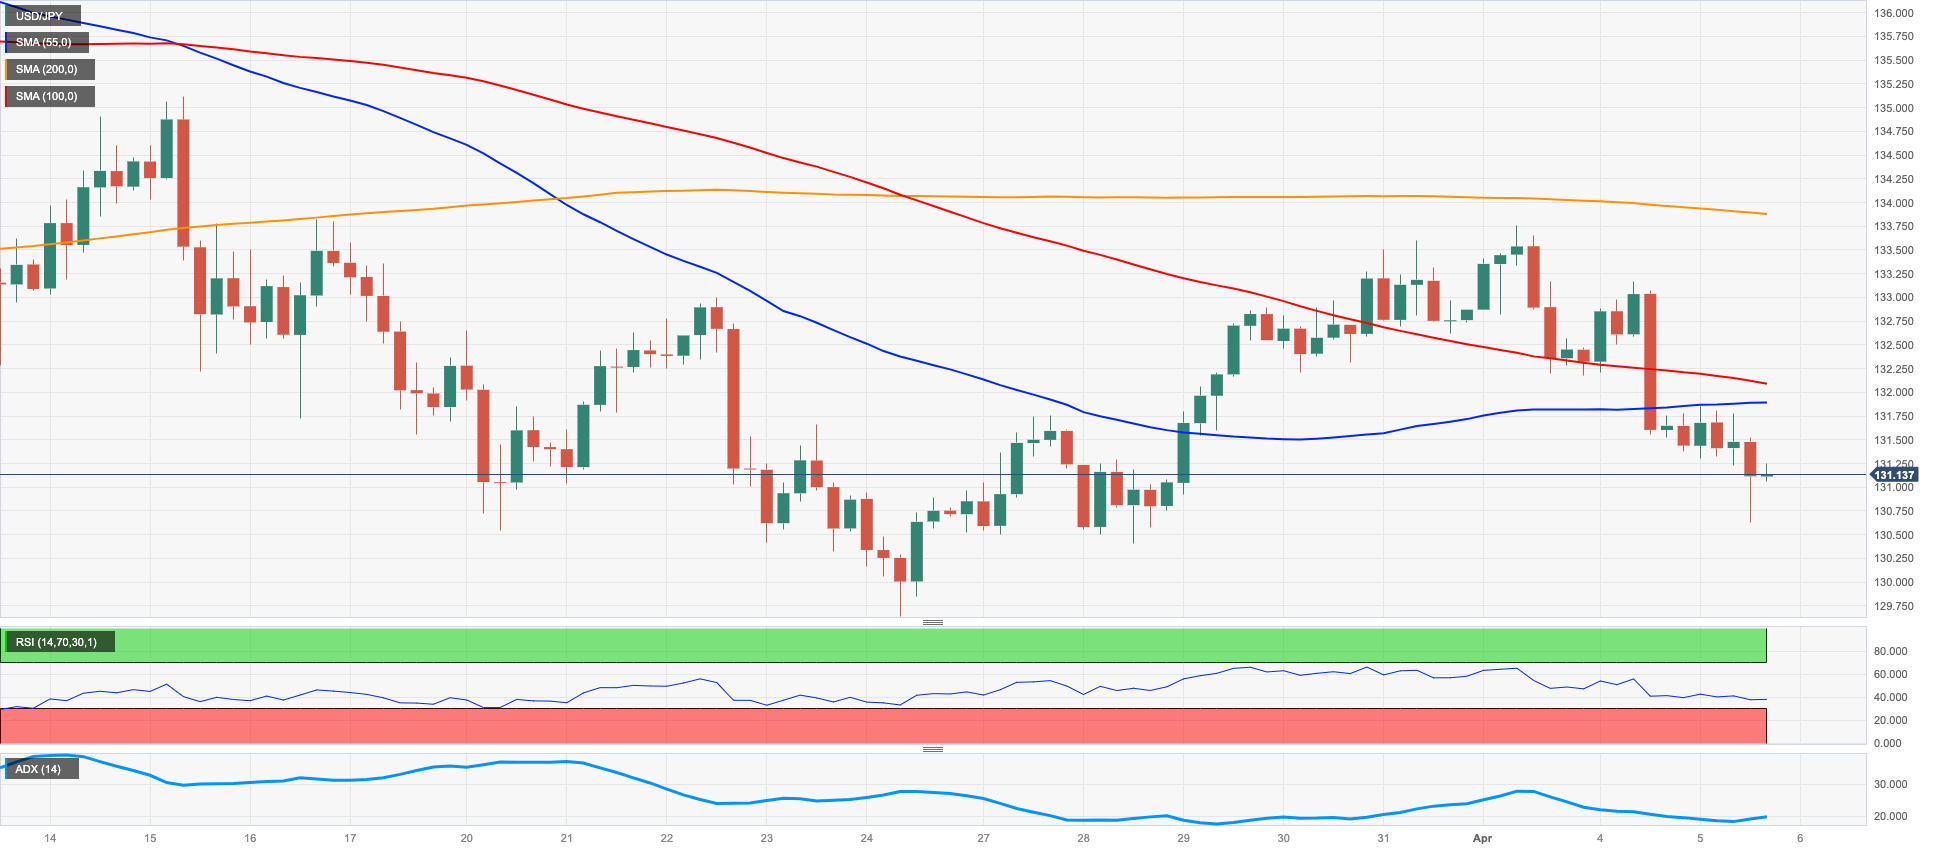
Further weakness encouraged sellers to remain in control and dragged USD/JPY to fresh 5-day lows near 130.60 on Wednesday.
In fact, while spot practically ignored the moderated recovery in the greenback, it succumbed to the persistent decline in US yields, which slipped back to multi-session lows across the curve.
The USD Index (DXY), in the meantime, managed to return to the positive territory and flirt with the 102.00 yardstick following an early drop to 2-month lows in the 101.45/40 band.
In Japan, the final Jibun Bank Services PMI improved to 55.0 for the month of March (from 54.0).
A deeper decline could see USD/JPY revisit the March low at 129.63 (March 24) ahead of the February low at 128.08 (February 2) and the 2023 low at 127.21 (January 16). On the opposite side, the weekly high at 133.75 (April 3) emerges as the immediate resistance level seconded by the key 200-day SMA at 137.24 and the 2023 top at 137.91 (March 8). The breakout of this level exposes the weekly peak at 139.89 (November 30 2022) followed by another weekly high at 142.25 (November 21 2022). The daily RSI grinded lower to the sub-42 zone.
Resistance levels: 133.75 133.92 135.11 (4H chart)
Support levels: 130.62 130.40 129.63 (4H chart)
GBPUSD
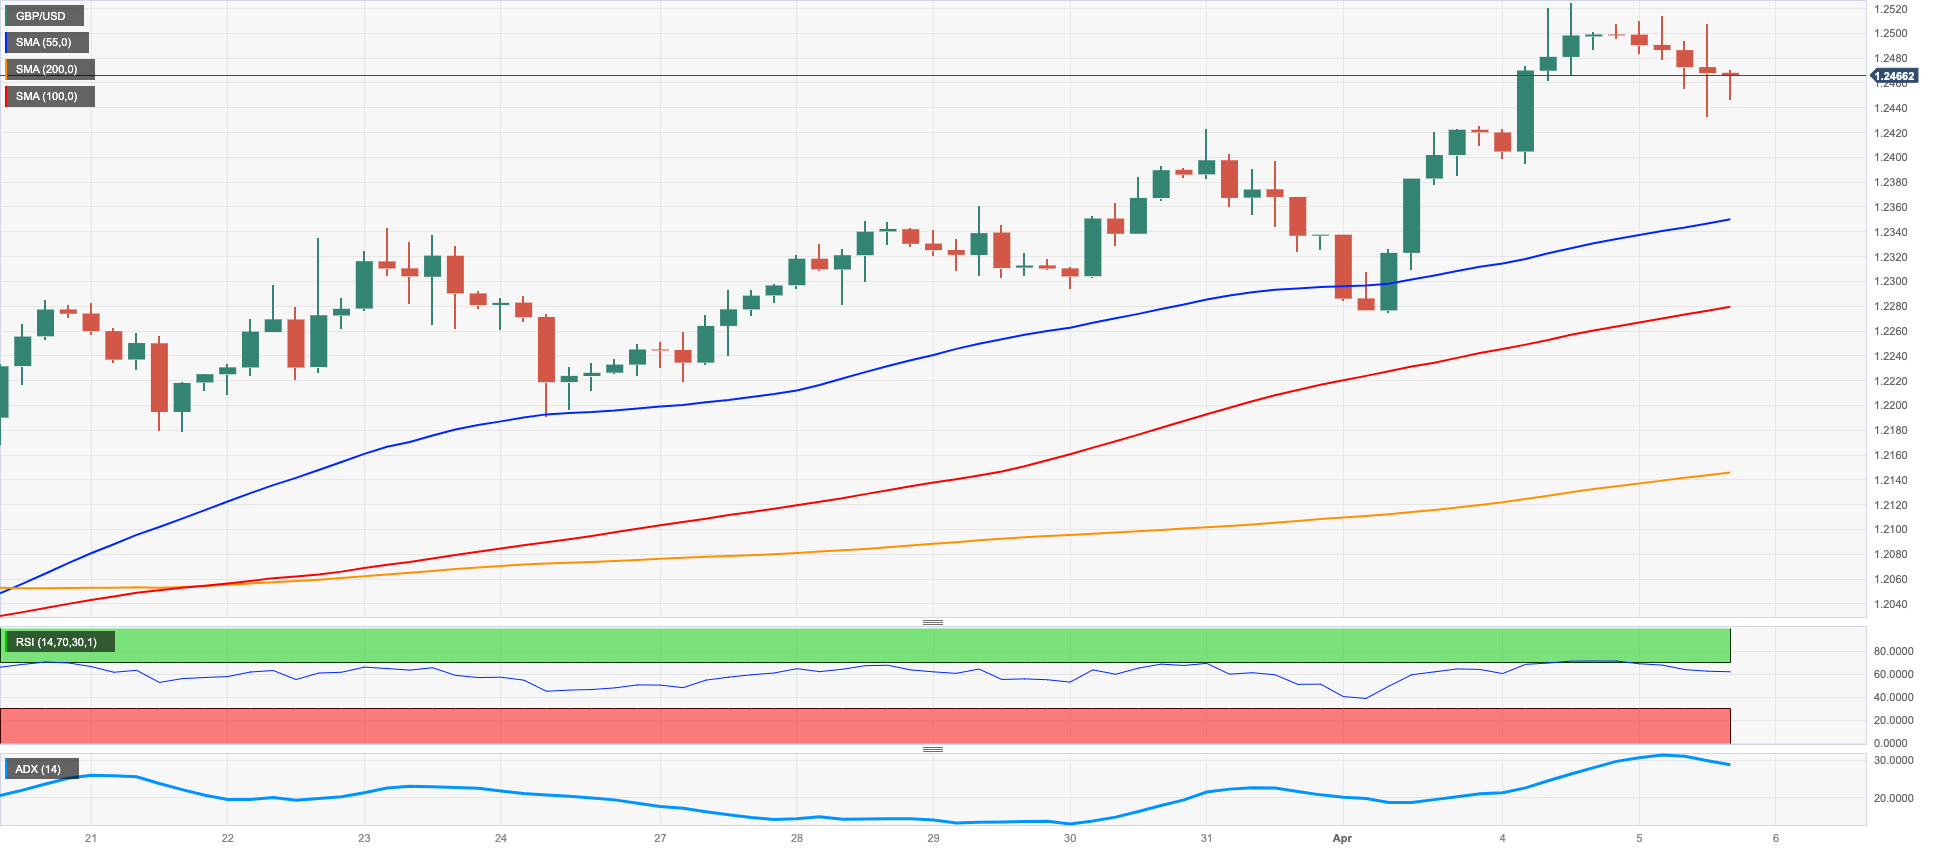
GBP/USD saw its strong weekly uptrend partially trimmed on Wednesday.
Indeed, following an unsuccessful attempt to advance north of 1.2500 the figure during early trade, Cable returned to the 1.2460 region on the back of a sound recovery in the greenback, all amidst the broad-based cautious tone among market participants.
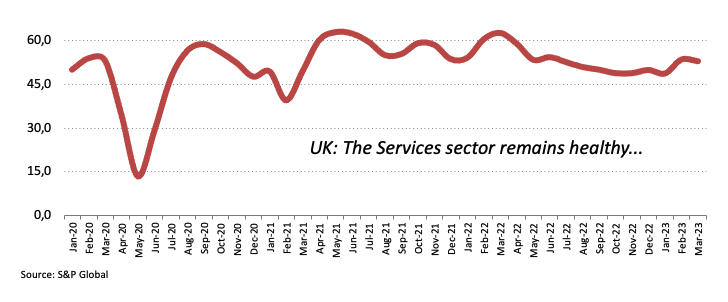
In the UK docket, the final Services PMI eased slightly to 52.9 in March (from 53.5) while New Car Sales expanded 18.2% in the year to February.
Despite the daily knee-jerk, the 4-week positive streak in GBP/USD remains unchallenged for the time being. Against that, the next up barrier appears at the April top at 1.2525 (April 4) seconded by the May 2022 peak at 1.2666 (May 27) and the 200-week SMA at 1.2868, all ahead of the psychological 1.3000 barrier. The other way around, there are provisional support levels at the 55- and 100-day SMAs at 1.2172 and 1.2146, respectively, prior to the weekly low at 1.2010 (March 15) and the key 200-day SMA at 1.1896. The loss of the latter could open the door to a deeper drop to the 2023 low at 1.1802 (March 8) seconded by the November 2022 low at 1.1142 (November 4). The daily RSI receded to the 63 zone.
Resistance levels: 1.2525 1.2599 1.2666 (4H chart)
Support levels: 1.2394 1.2274 1.2189 (4H chart)
AUDUSD
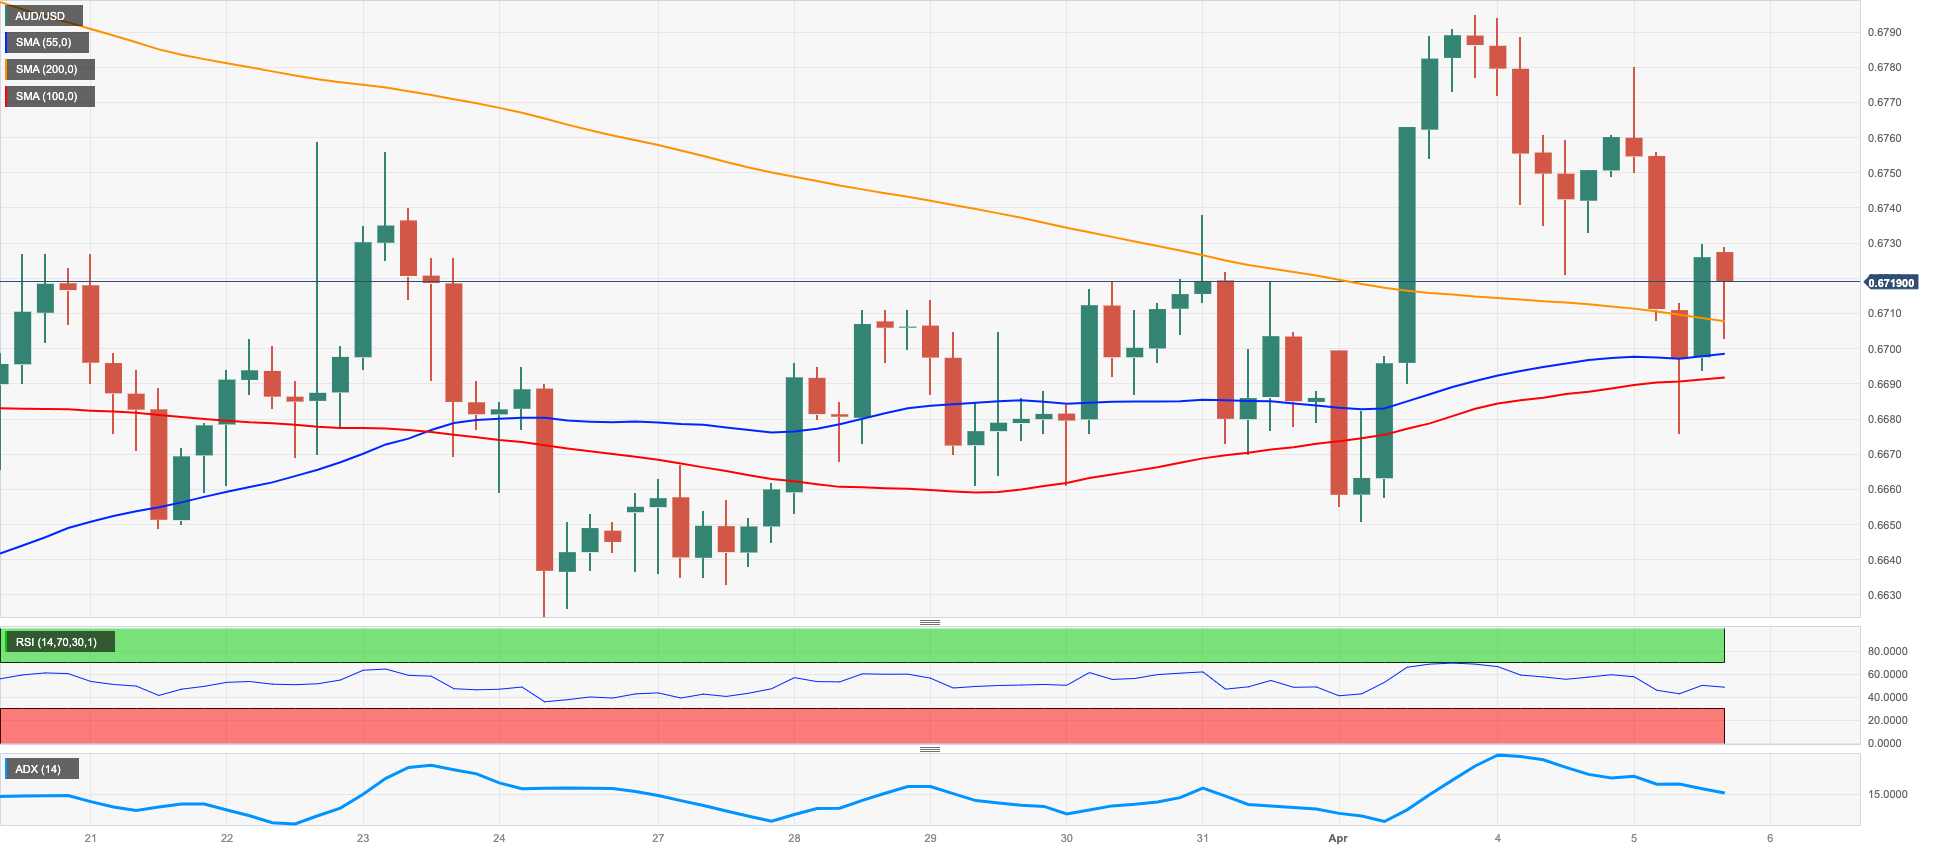
AUD/USD added to Tuesday’s retracement and dropped to 2-day lows in the sub-0.6700 region on Wednesday.
Indeed, while the Aussie dollar suffered the recovery in the greenback, it surrendered further ground mainly in response to the dovish tone from RBA Governor Lowe at his speech early on Wednesday.
On this, Governor P.Lowe said that the recent decision on rates should not rule out further rate hikes in the future if those are needed, at the time when he suggested that the balance of risks still point to extra rate raises. He also noted that the RBA is ready to face a slower return of the inflation to the bank’s target if the economy can preserve many of those jobs created during the last few years.
Extra weakness for AUD came from another negative performance of copper prices and the iron ore in the commodity galaxy.
AUD/USD broke below the 200-day SMA, and this seems to have sparked a bout of extra downside pressure. That said, the immediate contention is expected to appear not until the 2023 low at 0.6563 (March 10) ahead of the weekly low at 0.6386 (November 10 2022) and followed by the November 2022 low at 0.6272 (November 3). By contrast, the April high at 0.6793 (April 4) should emerge as the next hurdle of note, an area reinforced by the temporary 100-day SMA. Further up comes the interim 55-day SMA at 0.6818 prior to the key round level at 0.7000 and the weekly top at 0.7029 (February 14). The daily RSI retreated below the 50 yardstick.
Resistance levels: 0.6793 0.6848 0.6920 (4H chart)
Support levels: 0.6676 0.6650 0.6625 (4H chart)
GOLD
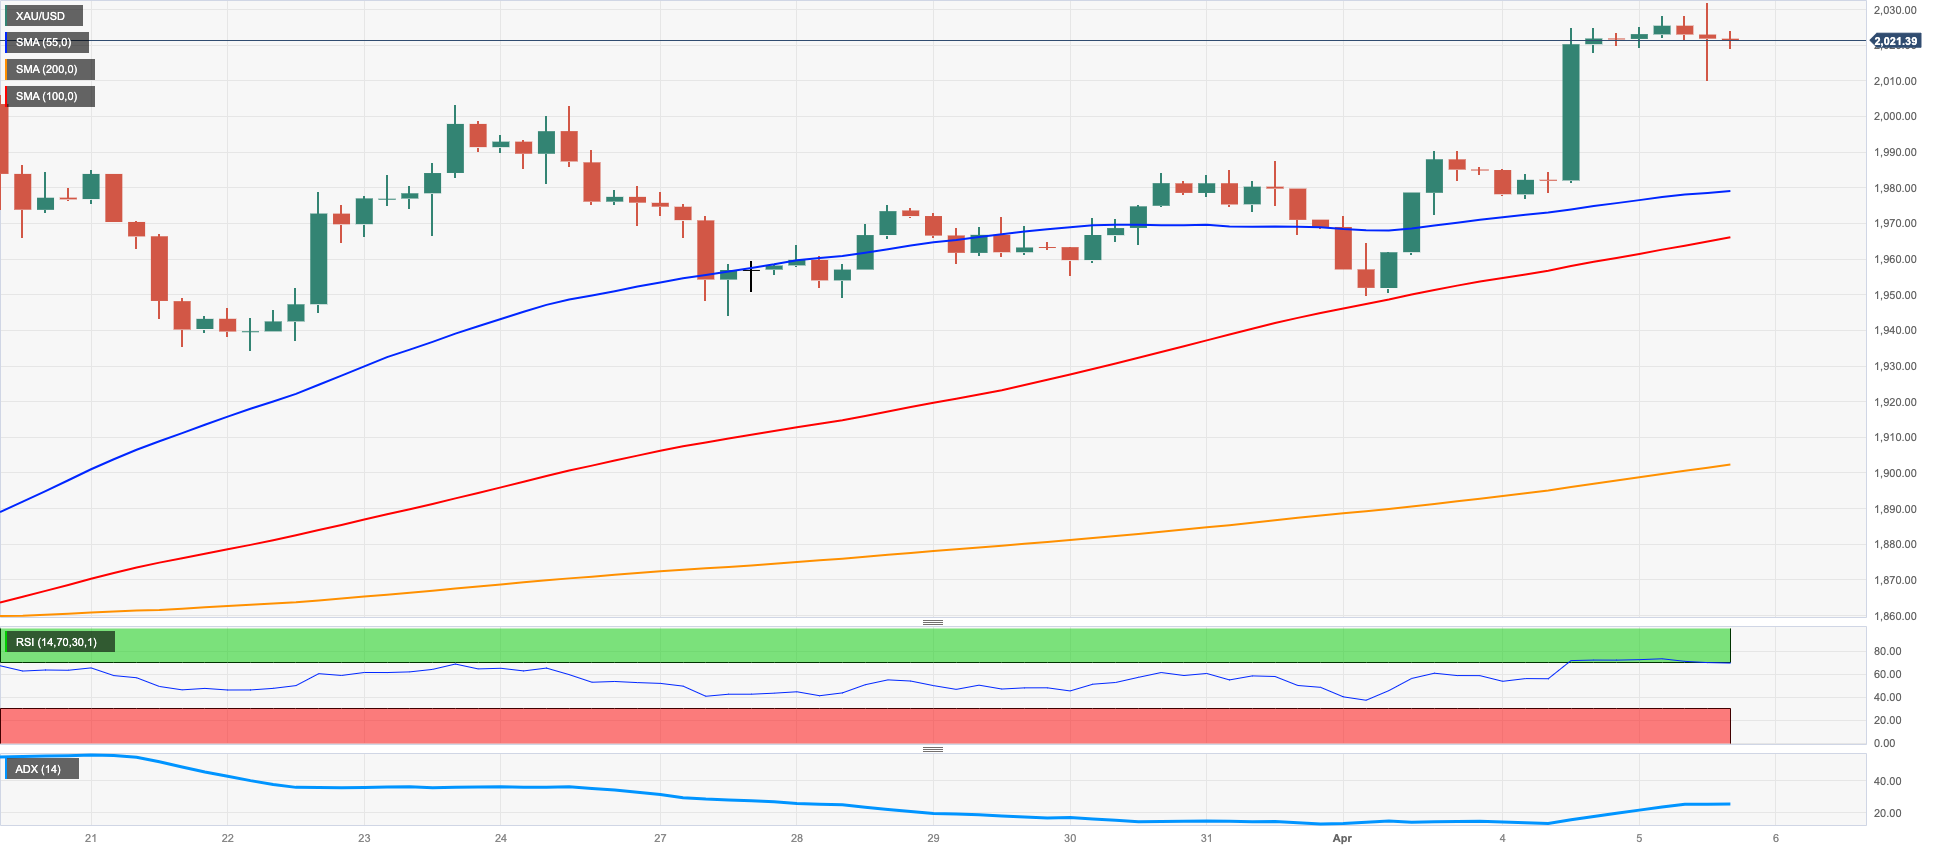
Renewed buying pressure in the greenback motivated prices of the ounce troy of the precious metal to abandon the area of fresh 2023 tops past the $2030 mark and end the session with marginal gains on Wednesday.
In addition, the intense decline also saw US yields decline to new lows across the curve, which underpinned further the upward bias in the yellow metal.
So far, conviction among investors that the Fed might pause its tightening cycle next month continues to gather steam and is expected to maintain the dollar’s price action subdued for the time being. That said, the next risk event for bullion comes on Friday’s publication of the Nonfarm Payrolls for the month of March.
The continuation of the uptrend in gold should now target the 2022 high at $2070 (March 8) just before the all-time top at $2075 (August 7 2020). Oppositely, there is an initial support at the weekly low at $1934 (March 22) ahead of the temporary 55- and 100-day SMAs at $1900 and $1859, respectively. Down from here, the metal could confront the March low at $1809 (March 8) prior to the 2023 low at $1804 (February 28) and the key 200-day SMA at $1786.
Resistance levels: $2032 $2070 $2075 (4H chart)
Support levels: $1977 $1949 $1934 (4H chart)
CRUDE WTI
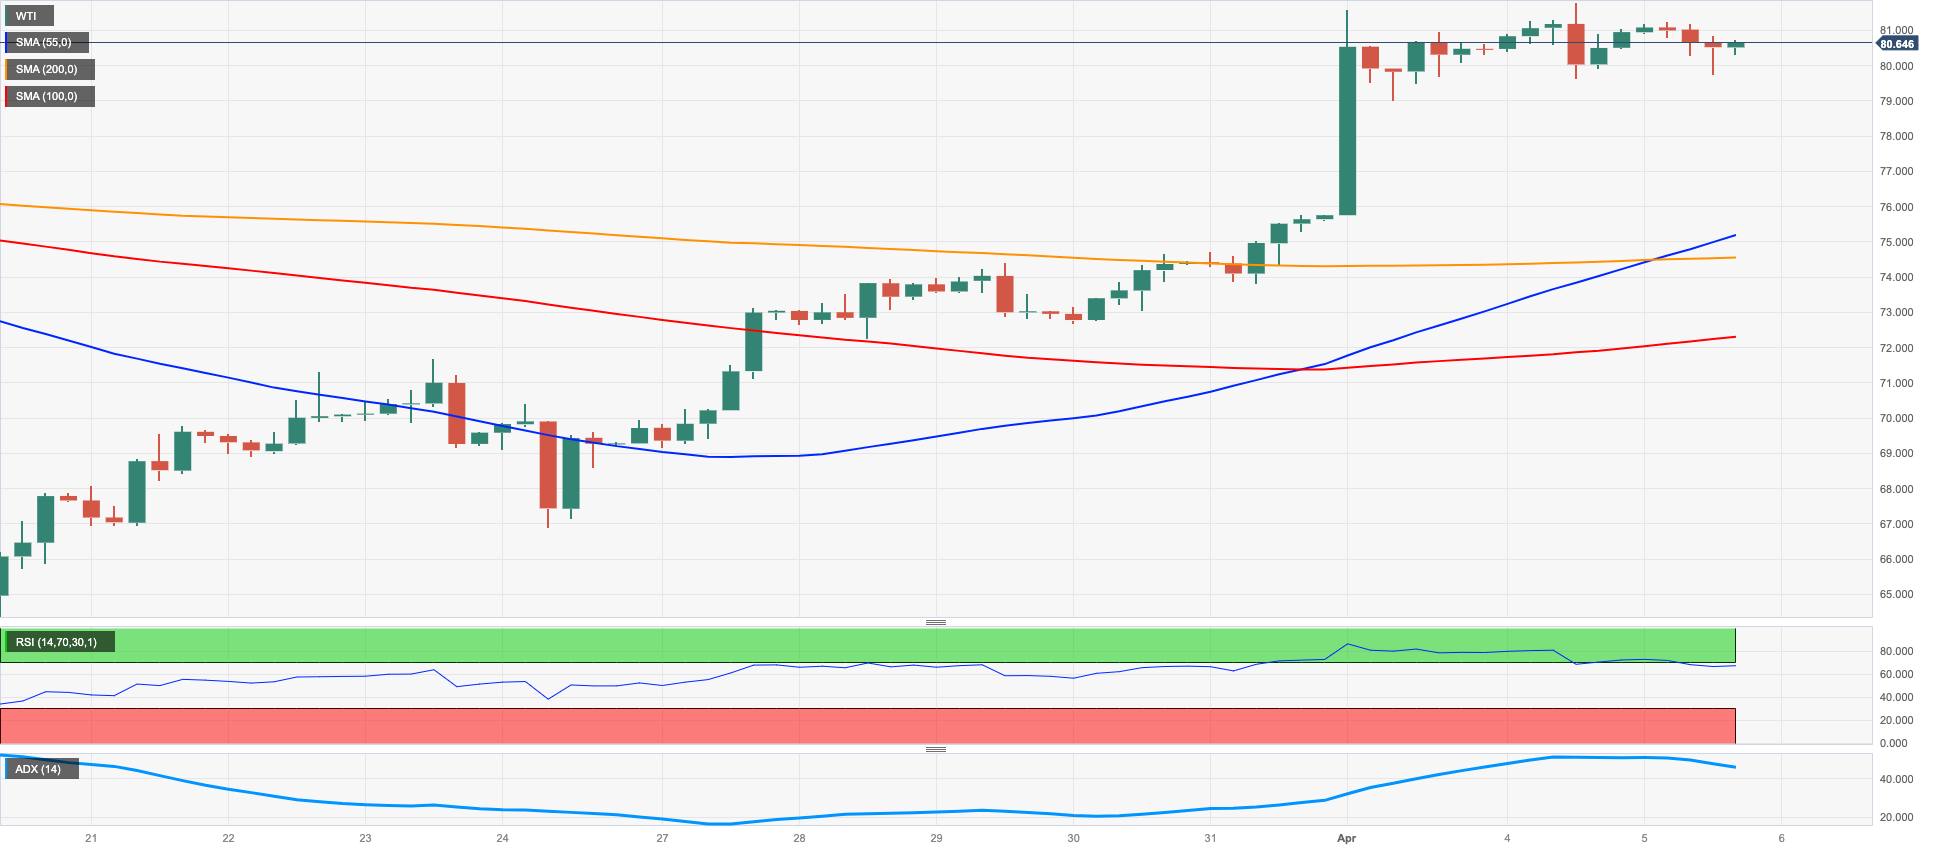
After four consecutive daily advances – including fresh tops past the $81.00 mark per barrel – prices of the WTI grinded lower and briefly pierced the key $80.00 mark on Wednesday.
Once again, discouraging prints from US fundamentals, this time from the Services sector, reignited recession concerns and hurt investors’ sentiment despite the recent announcement of an oil output reduction by the OPEC+.
The late rebound in the greenback, in addition, put crude oil prices under extra pressure amidst rising cautiousness ahead of the publication of Nonfarm Payroll later in the week.
In addition, the larger-than-expected decline in US crude oil stocks did nothing to prevent the commodity from giving away some of the recent gains. On this, the EIA reported that US crude oil inventories shrank by 3.739M barrels in the week to March 31, while supplies at Cushing went down by 0.970M barrels, Weekly Distillate Stocks dropped by 3.632M barrels and gasoline stockpiles decreased by 4.119M barrels.
The recovery in prices of the WTI appears far from over so far. That said, the next up barrier remains at the April peak at $81.75 (April 4) followed by the 2023 high at $82.60 (January 23) and the December 2022 top at $83.32 (December 1). If the commodity breaks above the latter, it could open the door to the November 2022 peak at $93.73 (November 7). Having said that, the April low at $79.05 (April 3) appears as the next support seconded by the interim 100- and 55-day SMAs at $76.82 and $76.09, respectively. Once cleared, the WTI could retest the $66.86 level (March 24) before the 2023 low at $64.41 (March 20) and the December 2021 low at $62.46 (December 2).
Resistance levels: $81.75 $82.60 $83.32 (4H chart)
Support levels: $78.97 $74.51 $72.57 (4H chart)
GER40
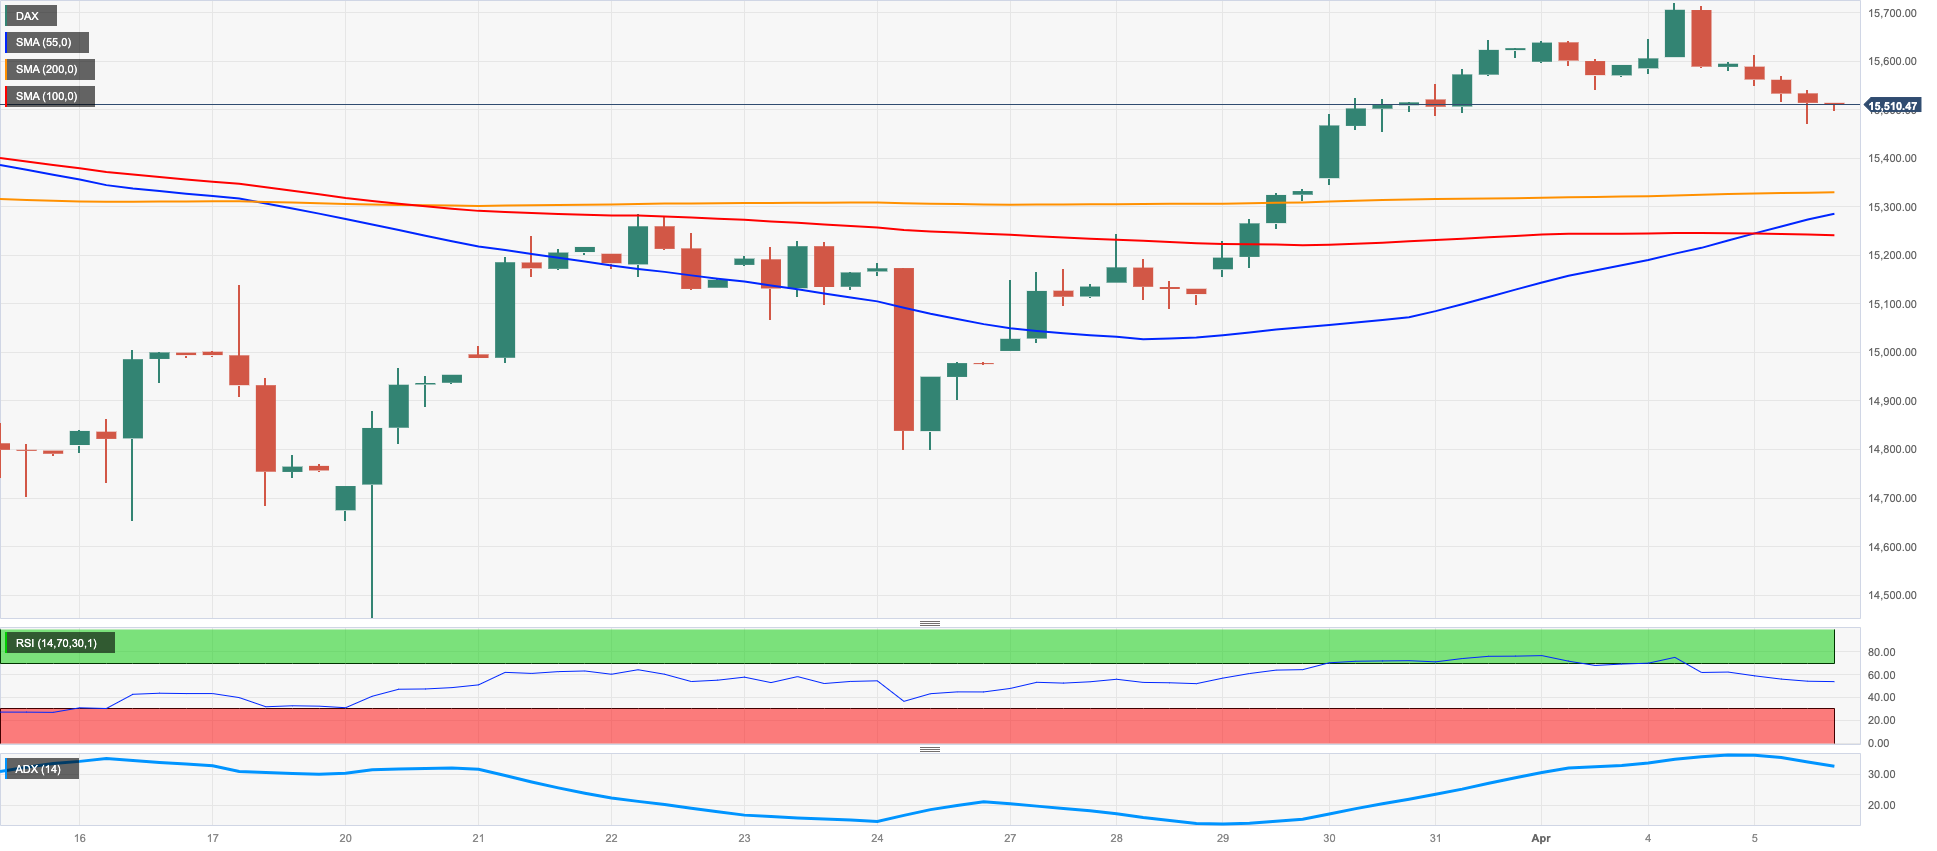
The German DAX40 lost the grip and retreated to multi-day lows around the 15500 region on Wednesday.
Investors’ concerns surrounding the likelihood that a recession could be in the offing were magnified after following the poor prints from the US calendar.
In addition, the hawkish narrative from ECB rate setters looked unabated and pointed once again to the continuation of the hiking cycle in May. The size of the rate raise, however, remains pretty unclear for the time being.
In line with the drop in equities, the 10-year Bund yields also deflated to multi-day lows in the sub-2.20% region.
In the calendar, Factory Orders expanded more than expected at a monthly 4.8% in February, while the final Services PMI improved to 53.7 in March (from 50.9).
Despite the daily drop, the prospects for the DAX40 lean to the bullish side. Indeed, the next resistance level emerges at the April high at 15736 (April 4) seconded by the round level at 16000 and the 2022 top at 16285 (January 5). On the flip side, the 55- and 100-day SMAs at 15301 and 14894 are seen offering provisional contention, respectively, ahead of the minor support at 14809 (March 24) and the March low at 14458 (March 20). The loss of this level exposes a probable drop to the key 200-day SMA at 13968. The daily RSI gave away further ground and retested the 56 area.
Best Performers: Deutsche Telekom, Sartorius AG VZO, Siemens Healthineers
Worst Performers: Rheinmetall AG, Daimler Truck Holdings, Continental AG
Resistance levels: 15736 15912 16090 (4H chart)
Support levels: 15482 15217 14809 (4H chart)
NASDAQ
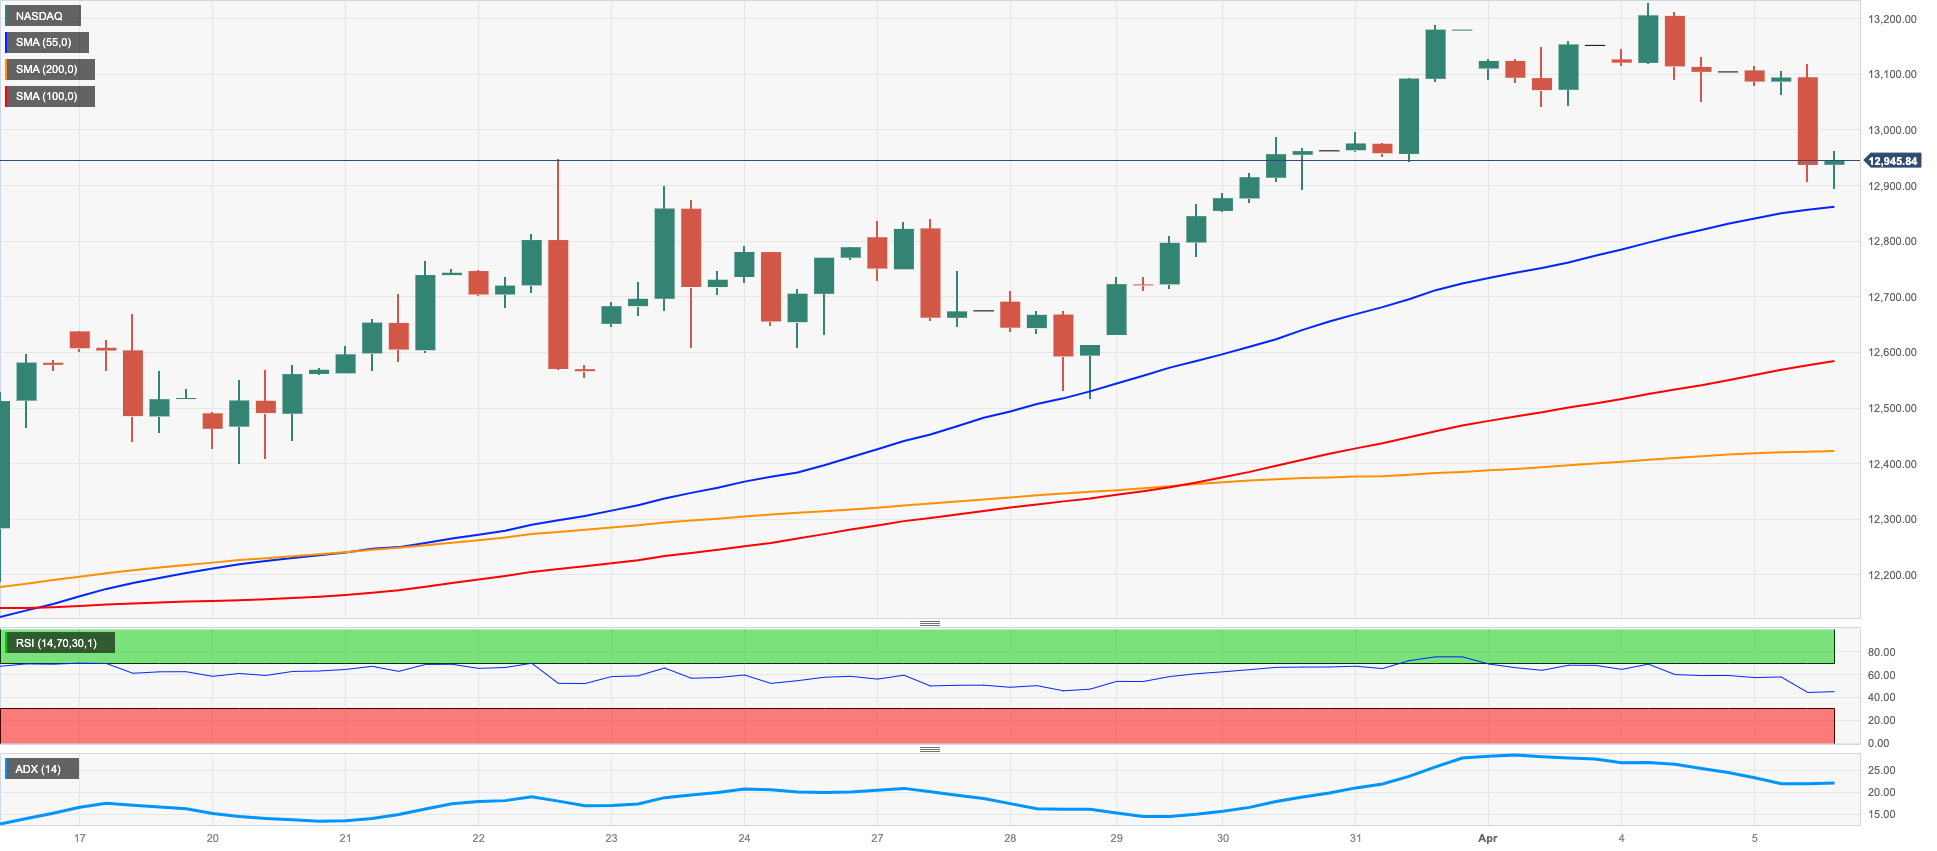
Fresh recession jitters were propped up by further loss of momentum in US fundamentals, this time following poor prints from the ADP report and the ISM Non-Manufacturing, both prints for the month of March.
In addition, the marked rebound in the dollar added to the already sour mood among traders, while the intense weakness in US yields appeared to have limited the damage for the Nasdaq 100, which traded on the defensive for the third session in a row.
The resumption of the bearish feeling could force the Nasdaq 100 to revisit the weekly low at 12517 (March 28) seconded by the temporary 55-day SMA at 12331 and the key 200-day SMA at 11955. The loss of this region could put a test of the March low at 11695 (March 13) back on the investors’ radar ahead of weekly lows at 11550 (January 25) and 11251 (January 19), which precede the 2023 low at 10696 (January 6). Just the opposite, the 2023 top at 13204 (April 4) remains the big magnet for bulls, and the break above this level could open the door to the August 2022 peak at 13720 (August 16) prior to the round level at 14000 and the March 2022 peak at 15265 (March 29). The daily RSI grinded lower and breached the 60 level.
Top Gainers: American Electric Power Inc, Xcel Energy, Biogen
Top Losers: Zscaler, Crowdstrike Holdings, Atlassian Corp Plc
Resistance levels: 13204 13720 14277 (4H chart)
Support levels: 12894 12517 11884 (4H chart)
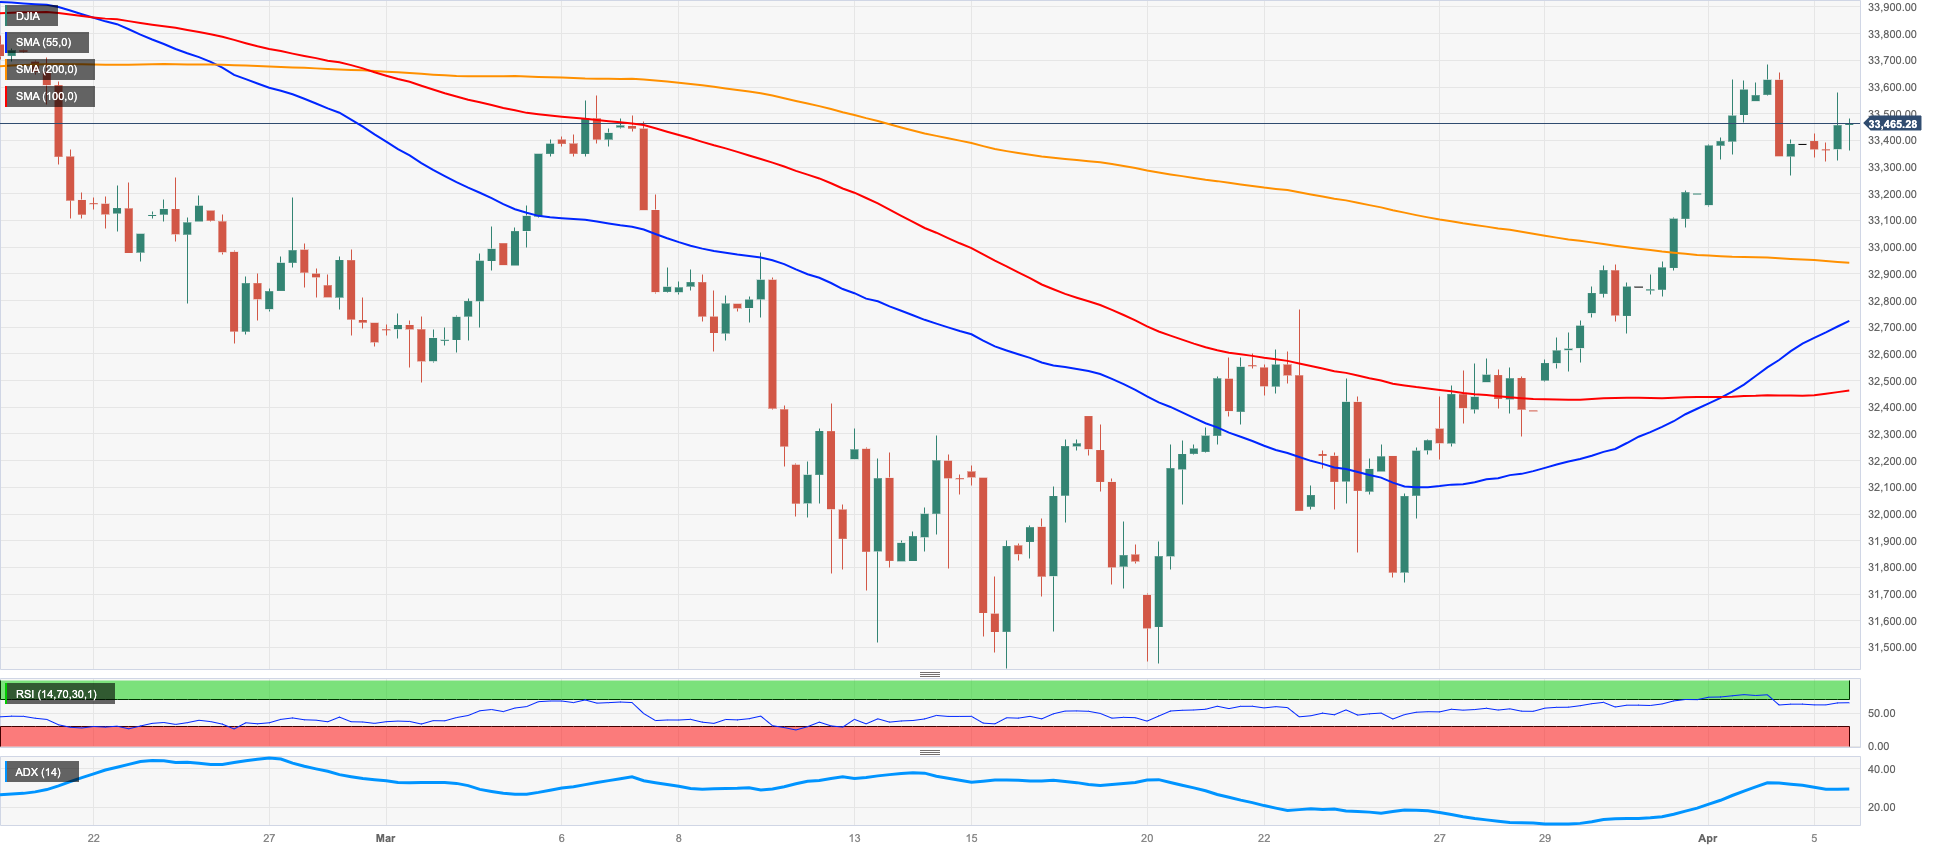
DOW JONES
The three major US stock indices traded in a mixed note on Wednesday after the Dow Jones gained 0.13% to 33446, the S&P500 deflated 0.44% to 4082 and the tech-benchmark Nasdaq Composite dropped 1.32% to 11966.
Disheartening results from the US labour market and the loss of momentum in the Services sector all weighed on investors’ sentiment and motivated the re-emergence of fears surrounding a probable economic slowdown, all ahead of the key US Nonfarm Payrolls due on Friday.
The Dow Jones continues to face the next hurdle of significance at the April top at 33634 (April 4) prior to the 2023 peak at 34342 (January 13) and the December 2022 high at 34712 (December 13). The breakout of this region could prompt the April 2022 top at 35492 (April 21) to emerge on the horizon before the February 2022 peak at 35824 (February 9). In opposition, there is a temporary contention at the 55-day SMA at 33153 followed by the more relevant 200-day SMA at 32439. South from here turns up the 2023 low at 31429 (March 15) prior to the 30000 mark and the 2022 low at 28660 (October 13). The daily RSI looked flat around 59.
Top Performers: J&J, UnitedHealth, Merck&Co
Worst Performers: Nike, Boeing, Caterpillar
Resistance levels: 33634 34334 34712 (4H chart)
Support levels: 32599 31805 31429 (4H chart)
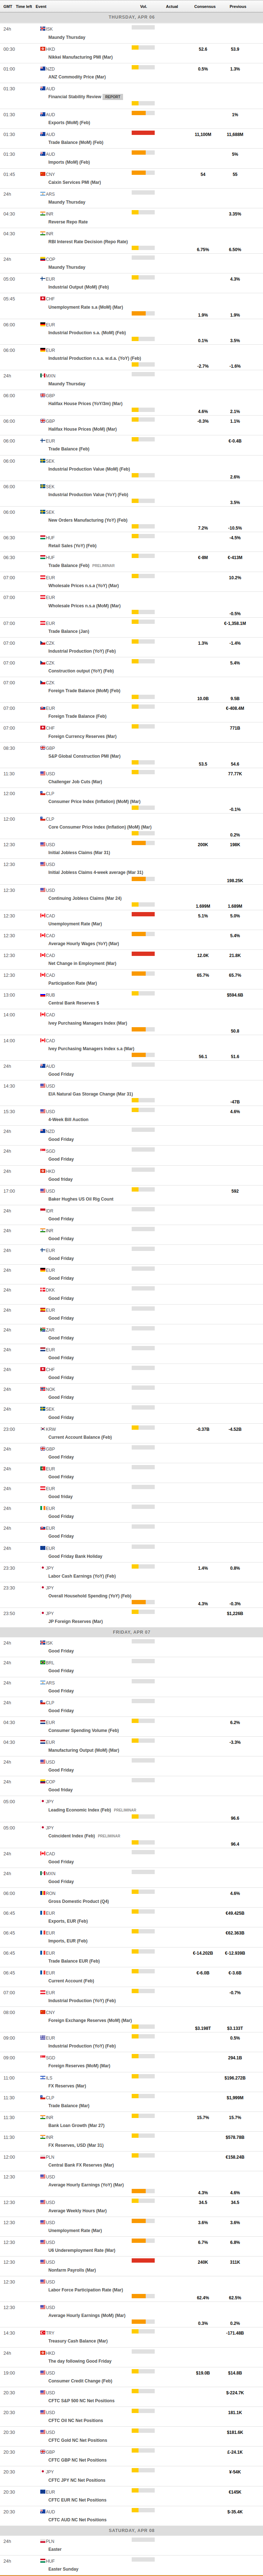
MACROECONOMIC EVENTS
All Information & Updates provided by:

All information relating to the financial markets available on this page has been prepared and issued by FXStreet (Forexstreet SL, Spain, Reg: B62498233) on the basis of publicly available information and all information believed to be reliable and does not conflict with Kuwaiti local laws, and all necessary care has been taken to before the company to ensure that the facts mentioned are correct from the source.
NCM Investment nor any of its directors or employees shall in any way be held responsible for the contents of this news, and the information contained on this page is intended only to provide clients with publicly available information and should not be construed as investment advice, report or analysis and/or constitute an offer or invitation to buy or sell financial instruments of any kind.
RISK WARNING: Forex and CFDs are highly risky leveraged products, as losses can exceed deposits. Please ensure you understand all the risks and take independent advice if necessary. NCM will segregate the clients based on the criteria of the regulator and its bylaws. NCM does not provide any advisory service; the material published does not constitute advice or a recommendation for a transaction in any financial instrument. NCM accepts no responsibility for any use of the content presented and any consequences of that use. Anyone acting on the information provided does so at their own risk.