
- Contact Us:
-

-

-

-


Daily Market Updates
07 Apr 2023
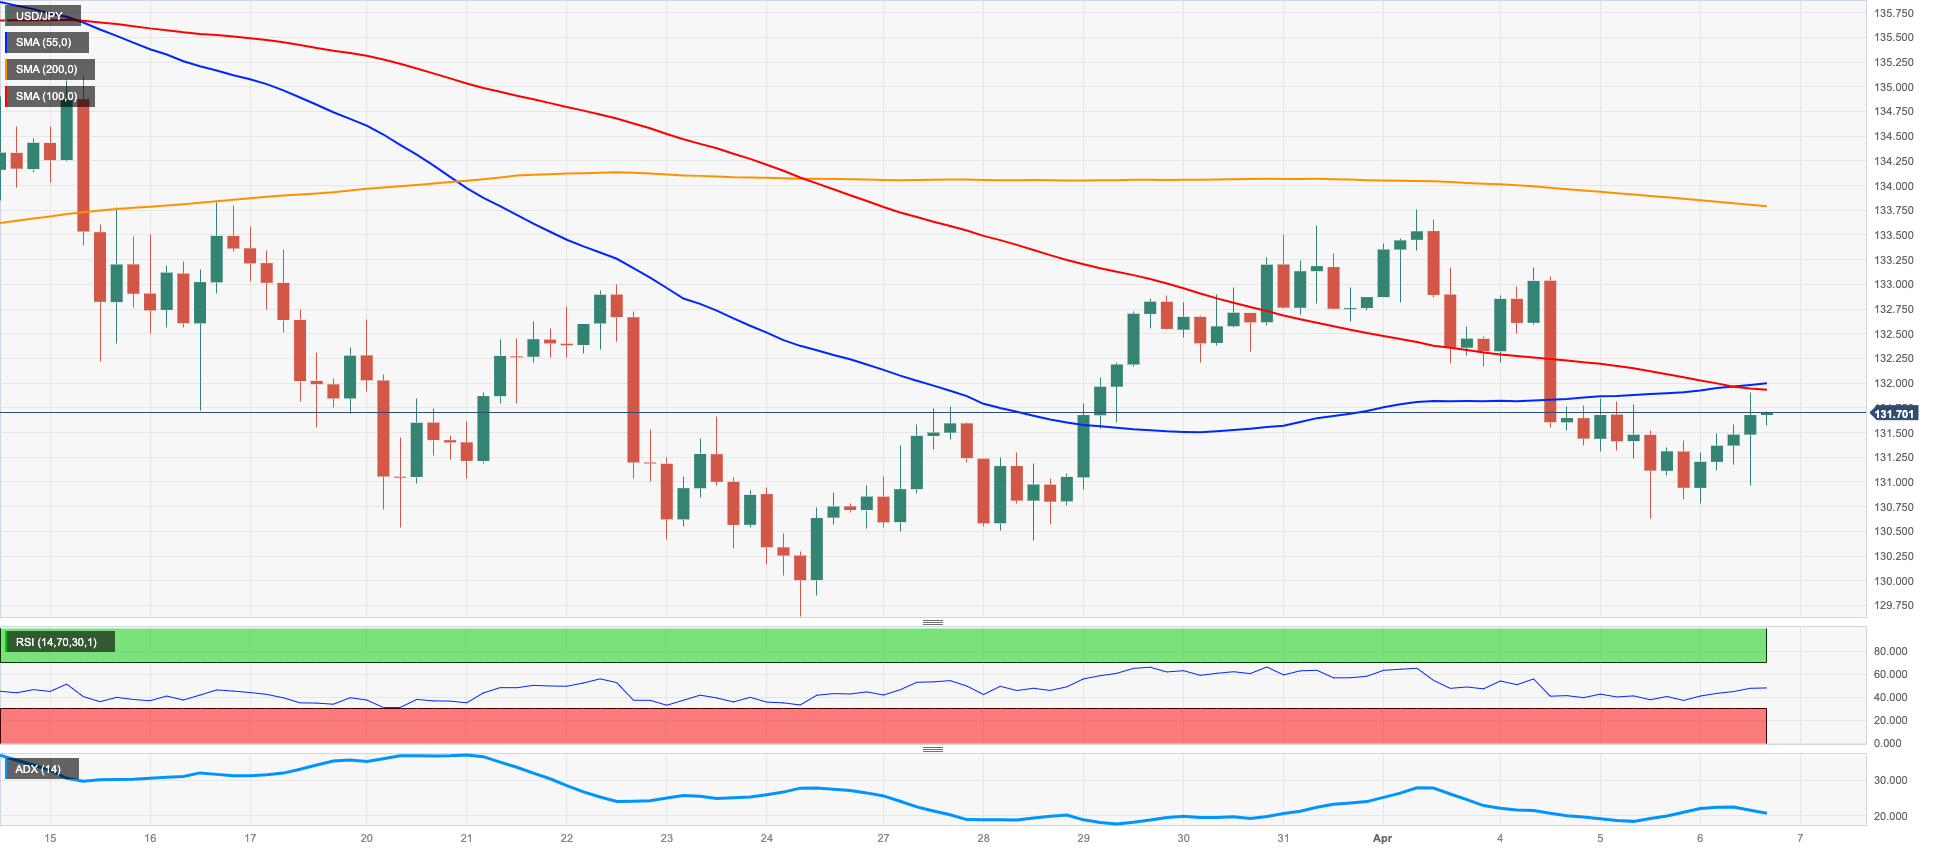
USDJPY
USD/JPY reversed three consecutive sessions in the red territory and managed to recoup some ground loss and advance to 2-day highs near 131.75/80 on Thursday.
Absent strong drivers, the pair’s positive price action seems to have followed another positive session in the greenback, while the still unabated retracement in US yields across the curve seems to have limited the upside.
The money market in Japan, in the meantime, saw the JGB 10-year yields halt the upward bias after poking with the 0.47% region before ending the session with red figures.
In the calendar, Foreign Bond Investment shrank to ¥483.4B in the week to April 1 in what was the sole release on Thursday.
Occasional bouts of strength could encourage USD/JPY to confront the weekly top at 133.75 (April 3) ahead of the key 200-day SMA at 137.22 and the 2023 peak at 137.91 (March 8). The surpass of the latter could see weekly highs at 139.89 (November 30 2022) and 142.25 (November 21 2022) revisited. The other way around, the immediate support comes at the March low at 129.63 (March 24) prior to the February low at 128.08 (February 2) and seconded by the 2023 low at 127.21 (January 16). The daily RSI bounced to the 45 region.
Resistance levels: 133.16 133.75 135.11 (4H chart)
Support levels: 130.62 130.40 129.63 (4H chart)
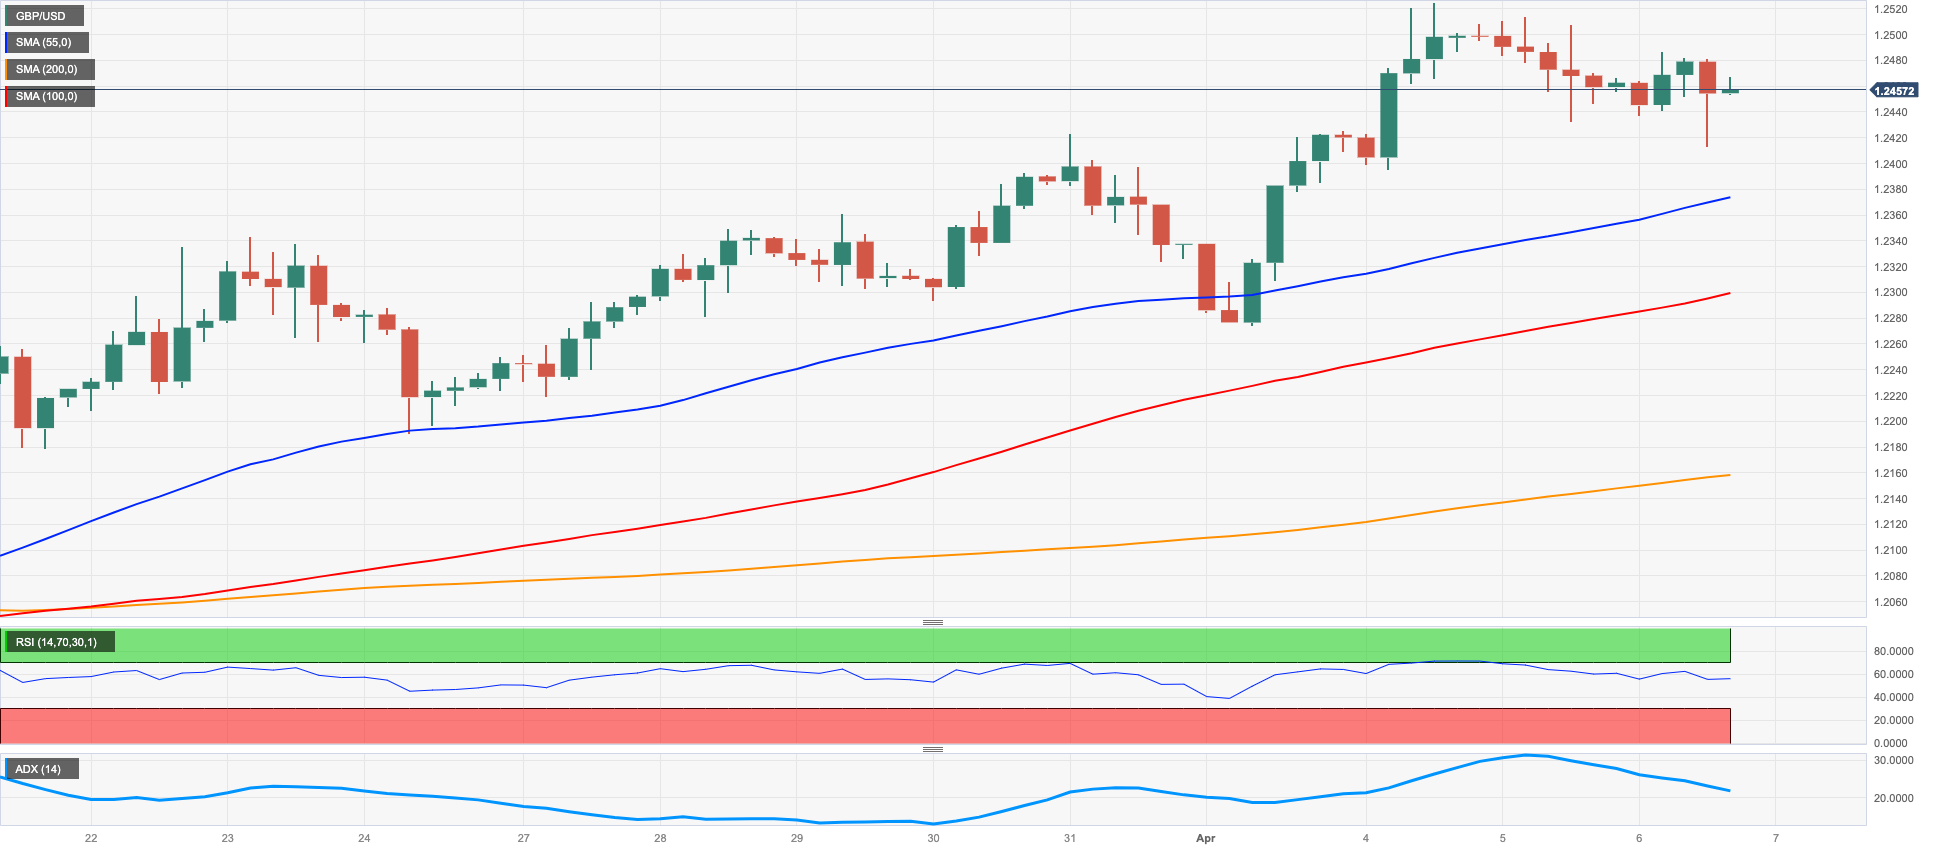
GBPUSD
The generalized lack of direction in the global markets motivated GBP/USD to trade within an inconclusive range south of the 1.2500 barrier on Thursday.
Same performance was also seen around the greenback, as the USD Index (DXY) kept hovering around the 101.60 region amidst declining US yields and rising cautiousness ahead of the key publication of US NFP on Friday.
In the UK, the 10-year Gilt yields also headed lower, this time revisiting multi-session lows near 3.35%.
In the UK, the Halifax House Price Index rose 0.8% MoM in March and 1.6% from a year earlier. Additionally, the Construction PMI deflated to 50.7 during last month (from 54.6).
So far, bulls remain focused on the 2023 peak at 1.2525 (April 4). North from here, GBP/USD could challenge the May 2022 high at 1.2666 (May 27) seconded by the 200-week SMA at 1.2868 and the psychological 1.3000 mark. On the contrary, the 55- and 100-day SMAs at 1.2174 and 1.2152 are expected to emerge as temporary contention levels, respectively, ahead of the weekly low at 1.2010 (March 15) and the key 200-day SMA at 1.1898. A drop below this region could prompt the 2023 low at 1.1802 (March 8) to emerge on the horizon before the November 2022 low at 1.1142 (November 4). The daily RSI ebbed a tad to the 63 region.
Resistance levels: 1.2525 1.2599 1.2666 (4H chart)
Support levels: 1.2394 1.2274 1.2189 (4H chart)
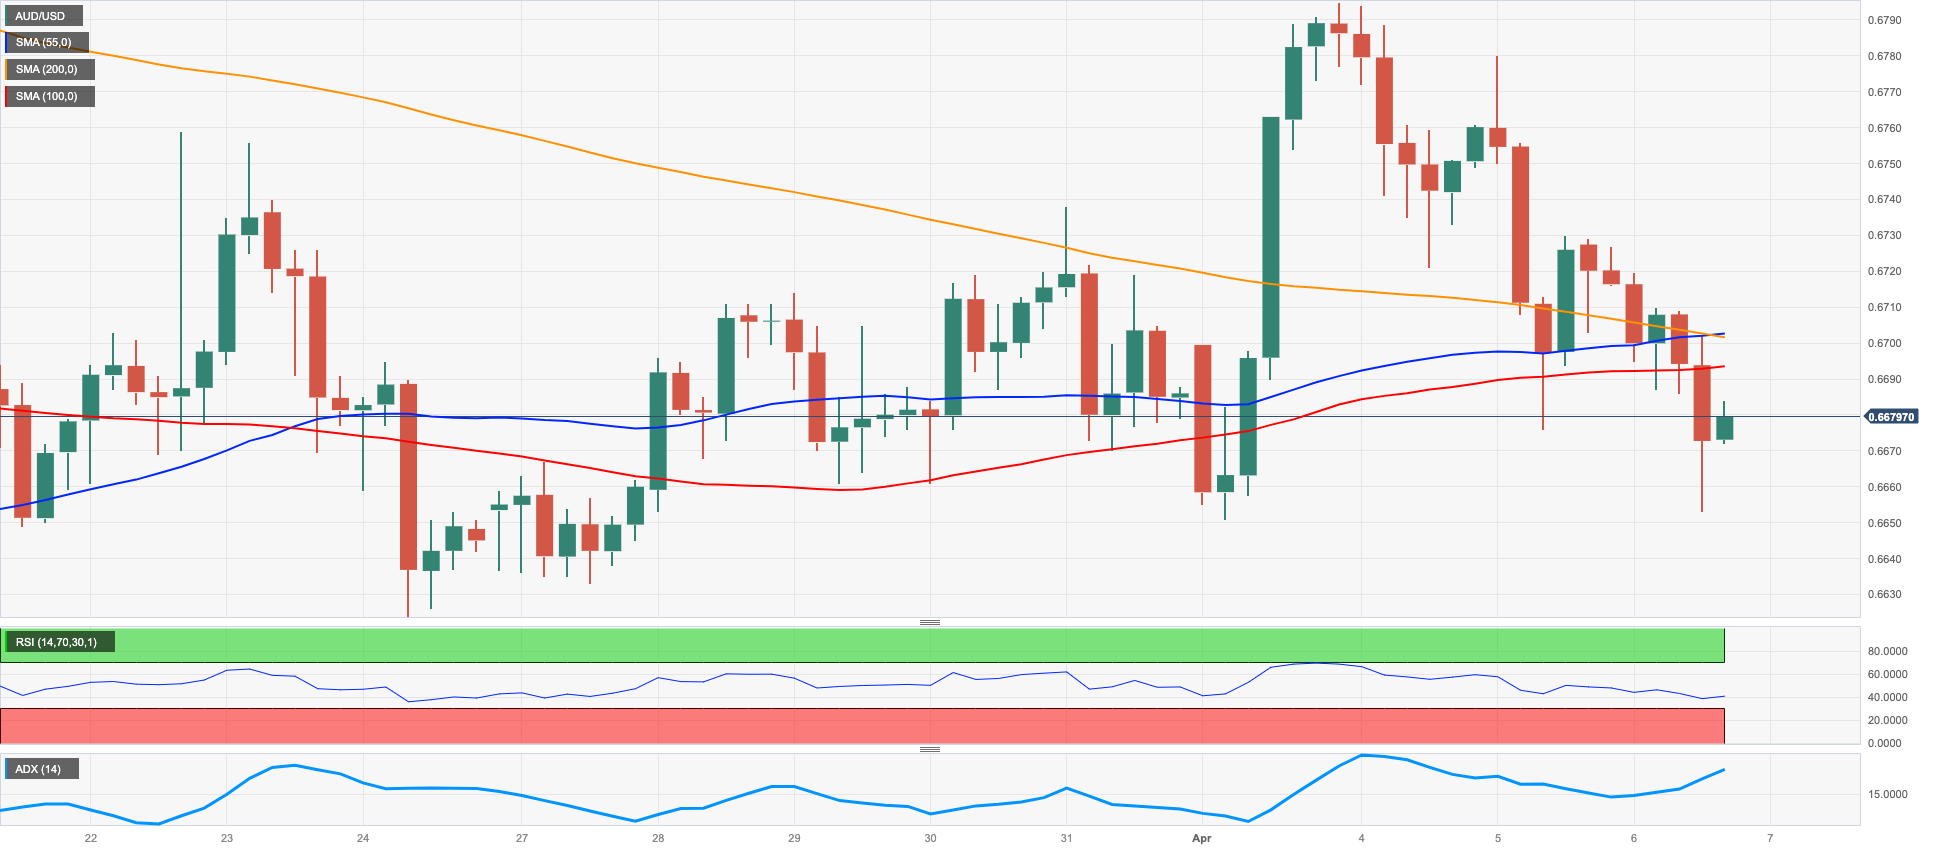
AUDUSD
The selling pressure around the Aussie dollar remained well and sound for the third session in a row and motivated AUD/USD to drop to 3-day lows near 0.6660 on Thursday.
In fact, the late rebound in the dollar put the pair under extra pressure, while the mixed tone in the commodity complex did nothing to help AUD despite Chinese results from the services sector surprised to the upside in March.
From the RBA, the semi-annual Financial Stability Review highlighted the solid health of the banking system despite warning that households could struggle to meet their financial obligations in the next periods. In addition, persistent elevated inflation and further tightening by central banks could accentuate risks for the financial system.
In Oz, the trade surplus increased to A$13.87B in February, with Exports down 3% and Imports contracting 9%.
Extra losses could drag AUD/USD to the 2023 low at 0.6563 (March 10) prior to the weekly low at 0.6386 (November 10 2022) and seconded by the November 2022 low at 0.6272 (November 3). On the opposite side, the 200-day SMA at 0.6746 now emerges as the immediate up-barrier ahead of the April top at 0.6793 (April 4), which appears underpinned by the interim 100-day SMA. Up from here aligns the provisional 55-day SMA at 0.6813 before the key round level at 0.7000 and the weekly peak at 0.7029 (February 14). The daily RSI sank to the 46 zone.
Resistance levels: 0.6706 0.6779 0.6793 0.6920 (4H chart)
Support levels: 0.6650 0.6625 0.6589 (4H chart)
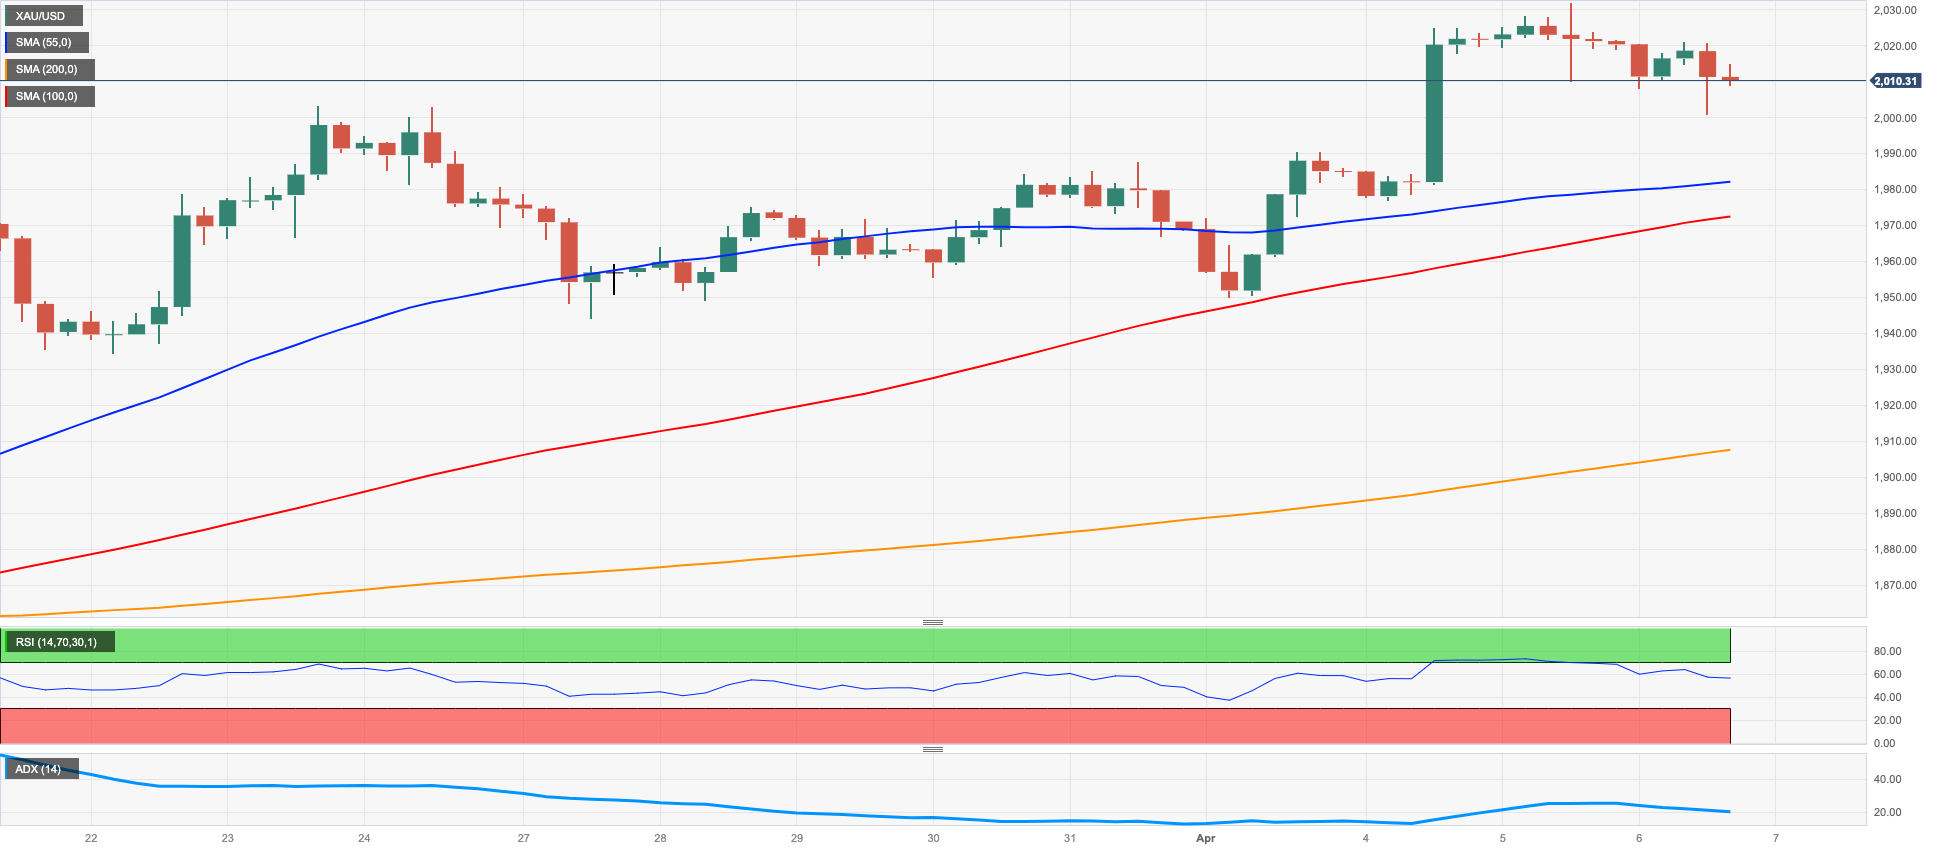
GOLD
Gold prices came under pressure and snapped three consecutive daily advances on Thursday. The precious metal, however, appears to have met solid contention around the key $2000 mark per ounce troy.
Some profit taking coupled with the vacillating price action around the greenback seem to have undermined the continuation of the leg higher in the yellow metal so far on Thursday.
The intense decline in US yields, on the other hand, limited the downside amidst increasing recession concerns among traders.
Later in the week, bullion’s recent optimism is expected to be put to the test in light of the release of US Nonfarm Payrolls for the month of March.
The bullish outlook for gold remains well in place despite receding on Thursday. That said, the initial up-barrier emerges at the 2022 top at $2070 (March 8) ahead of the all-time peak at $2075 (August 7 2020). By contrast, the weekly low at $1934 (March 22) should hold the initial downside test prior to the provisional contention levels at the 55- and 100-day SMAs at $1902 and $1861, respectively. Down from here comes the March low at $1809 (March 8) seconded by the 2023 low at $1804 (February 28) and the key 200-day SMA at $1786.
Resistance levels: $2032 $2070 $2075 (4H chart)
Support levels: $2000 $1977 $1949 (4H chart)
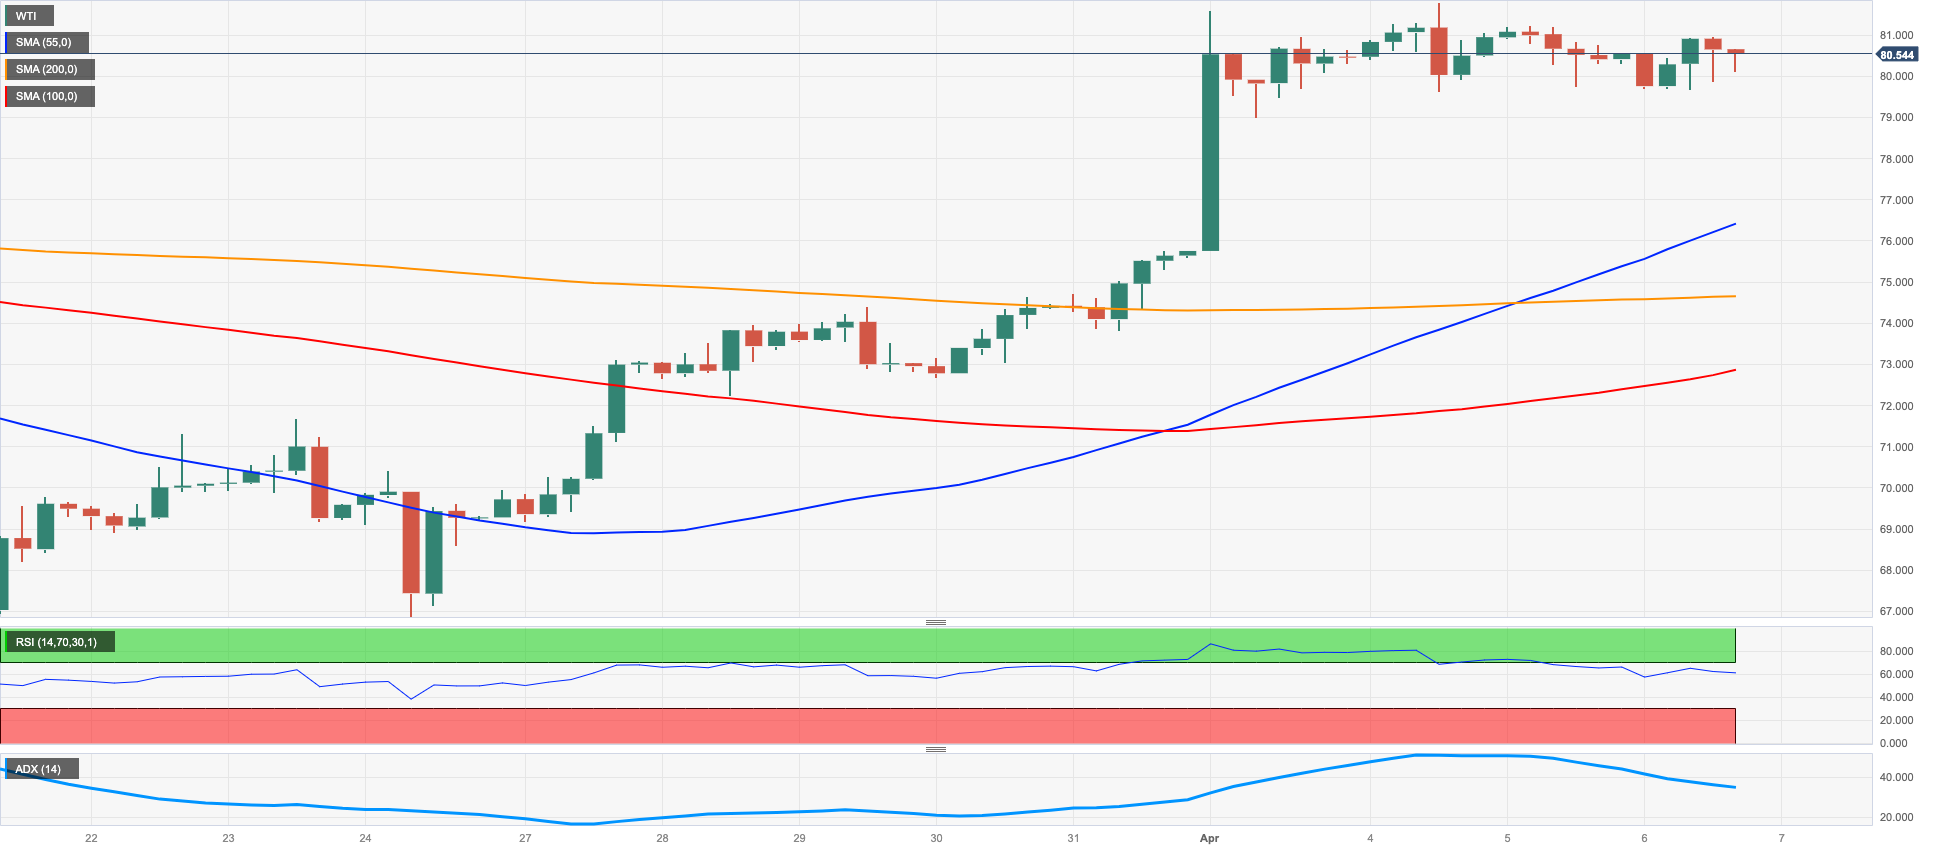
CRUDE WTI
Prices of the WTI managed to reverse an earlier drop to the sub-$80.00 region and regained the positive territory once again on Thursday.
So far, the commodity seems to have embarked on a consolidative theme in the upper end of the weekly range and remained bolstered by the recent decision by the OPEC+ to trim the crude oil output.
Extra legs for crude oil came after the EIA reported another pronounced weekly drop in US crude oil supplies during the past week (-3.739M barrels), while the inconclusive price action in the greenback also played its role in the daily uptick.
On the flip side, dark clouds stemming from recession concerns are expected to keep the upside potential of the WTI somewhat depressed for the time being.
Later in the session, driller Baker Hughes will publish its usual weekly US oil rig count in the week to April 7.
The continuation of the uptrend in the WTI needs to clear the April high at $81.75 (April 4) to dispute the 2023 top at $82.60 (January 23) and then the December 2022 peak at $83.32 (December 1). The breakout of this level could pave the way for a visit to the November 2022 high at $93.73 (November 7). On the other hand, there is an initial contention at the April low at $79.05 (April 3) ahead of the temporary 100- and 55-day SMAs at $76.76 and $76.08, respectively. A deeper pullback could put the $66.86 level (March 24) to the test ahead of the 2023 low at $64.41 (March 20) and the December 2021 low at $62.46 (December 2).
Resistance levels: $81.75 $82.60 $83.32 (4H chart)
Support levels: $78.97 $74.62 $72.57 (4H chart)
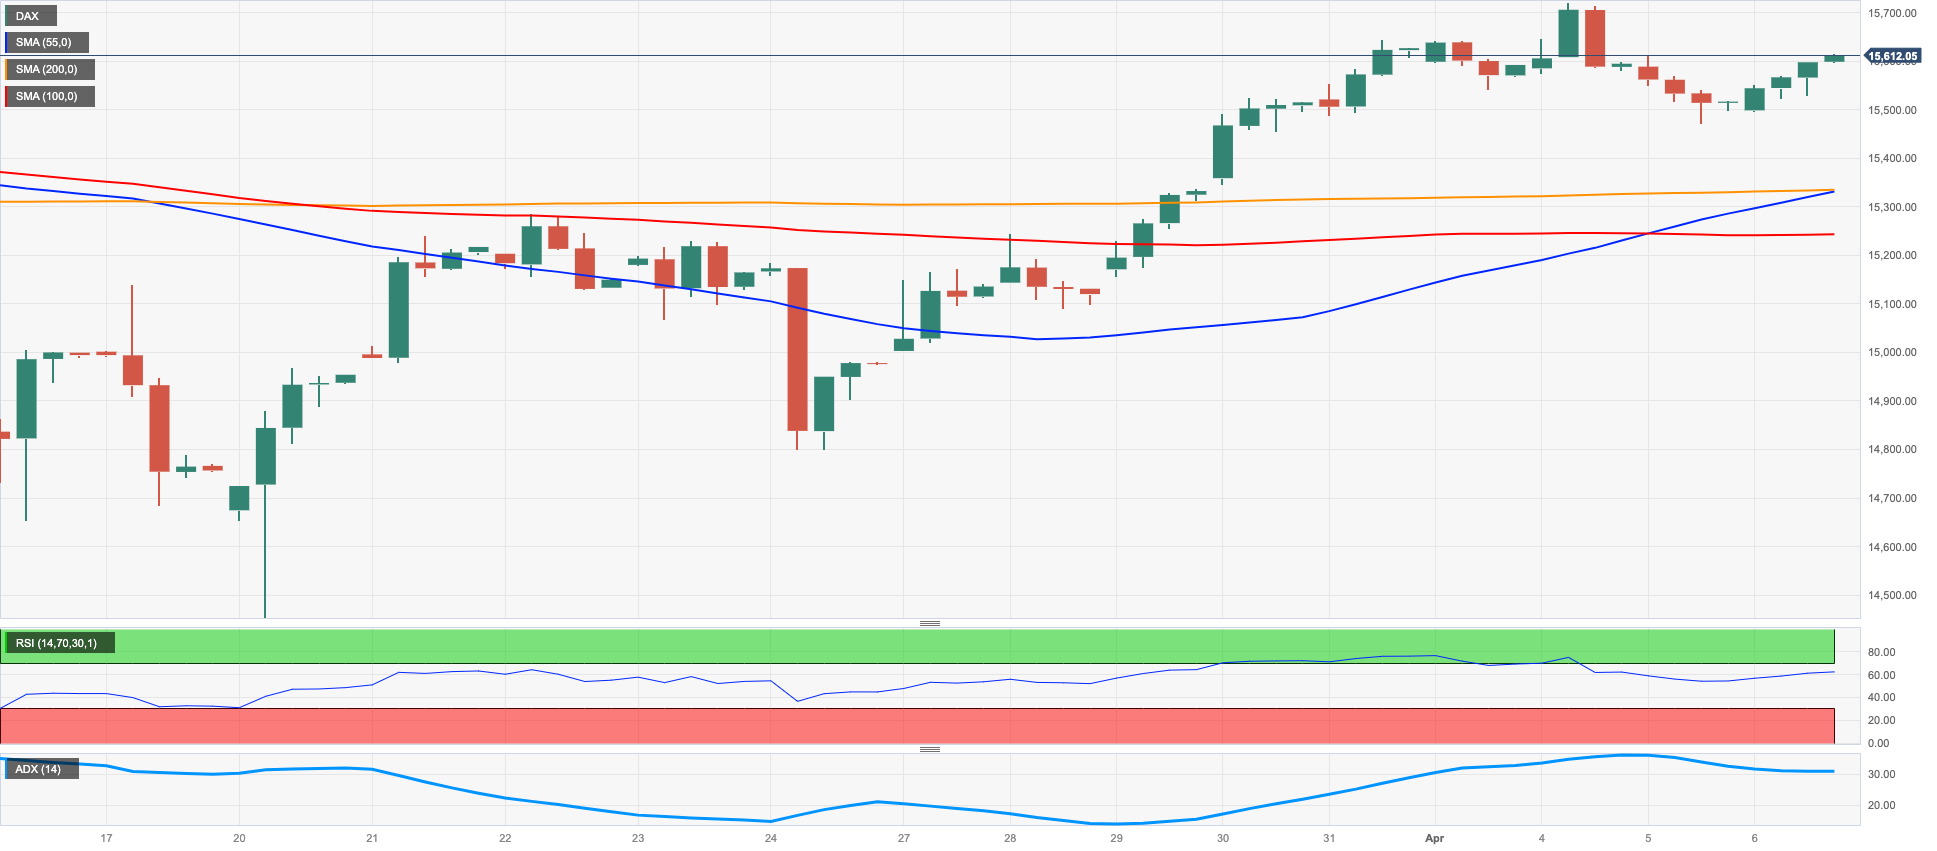
GER40
German equities left behind Wednesday’s pullback and charted decent gains near the 15600 region on Thursday when measured by the benchmark DAX40.
In fact, investors seem to have favoured a “glass-half-full” view ahead of the Easter holidays on Friday and Monday amidst persistent market chatter around a potential slowdown in the US economy, all in light of the loss of momentum in some fundamentals as of late, particularly in the labour market.
German yields, in the meantime, continued to track their US peers and receded to new lows near 2.10% just to bounce a tad afterwards.
In the domestic calendar, the Construction PMI deflated to 42.2 during last month, while Industrial Production expanded more than expected 2.0% MoM in February. Finally, New Car Registrations increased 24.2% YoY in March.
The DAX40 regained the smile on Thursday and continued to target the April top at 15736 (April 4) before the round level at 16000 and the 2022 peak at 16285 (January 5). In opposition, there are temporary contention levels at the 55- and 100-day SMAs at 15314 and 14908, respectively, prior to the minor support at 14809 (March 24) and the March low at 14458 (March 20). If the index breached this level it could then motivate the key 200-day SMA at 13981 to emerge on the horizon. The daily RSI rebounded to the proximity of 58.
Best Performers: Vonovia, Symrise AG, Commerzbank
Worst Performers: Siemens AG, Deutsche Telekom, Beiersdorf AG
Resistance levels: 15736 15912 16090 (4H chart)
Support levels: 15482 15237 14809 (4H chart)
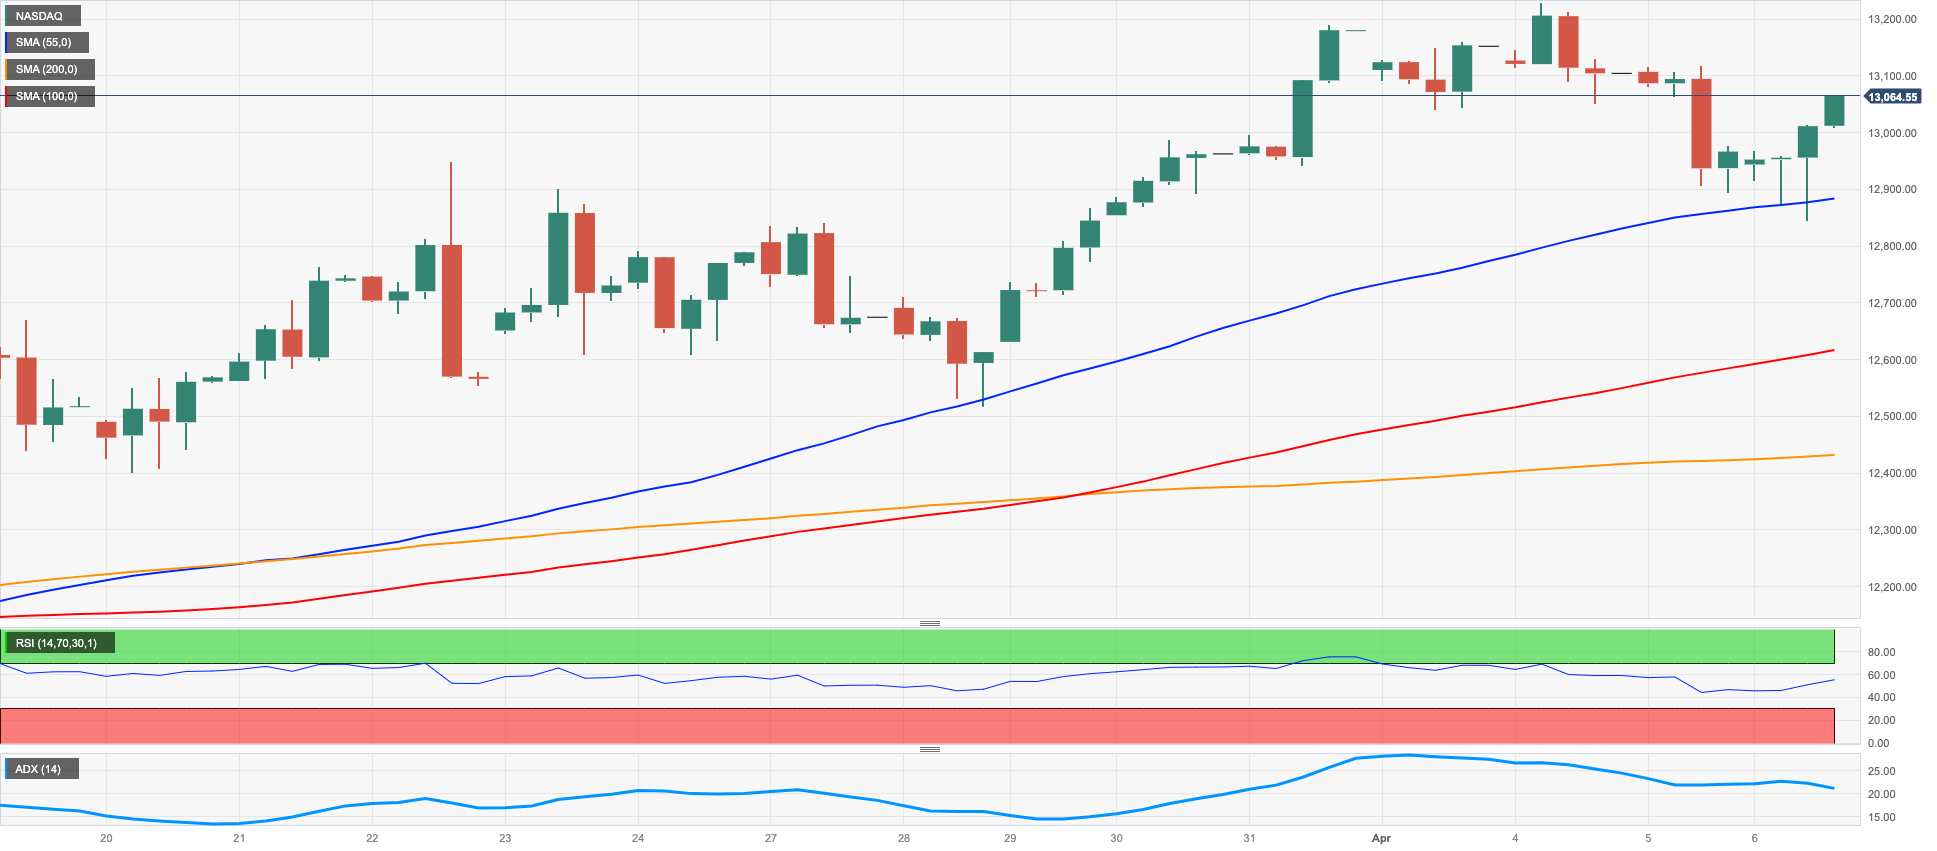
NASDAQ
The Nasdaq 100 quickly reversed the initial drop and bounced markedly to reclaim the area above the key 13000 mark on Thursday.
Tech equities gathered fresh steam and left behind three consecutive daily drops amidst the weak note in the greenback and declining US yields across the curve.
In addition, the positive performance of megacaps Alphabet, Microsoft and Apple also added to the renewed optimism among traders ahead of the key release of Nonfarm Payrolls on Friday.
Further recovery in the Nasdaq 100 should meet the next resistance level at the 2023 peak at 13204 (April 4) ahead of the August 2022 high at 13720 (August 16). The surpass of this level exposes a move to the round level at 14000 prior to the March 2022 high at 15265 (March 29). On the flip side, the weekly low at 12517 (March 28) emerges as the immediate contention area seconded by the interim 55-day SMA at 12361 and the key 200-day SMA at 11962. A drop below the latter could lead up to a visit to the March low at 11695 (March 13) before weekly lows at 11550 (January 25) and 11251 (January 19), all ahead of the 2023 low at 10696 (January 6). The daily RSI picked up pace and surpassed 62.
Top Gainers: Micron, Alphabet A, Alphabet C
Top Losers: Airbnb, Costco, Applied Materials
Resistance levels: 13204 13720 14277 (4H chart)
Support levels: 12846 12517 11925 (4H chart)
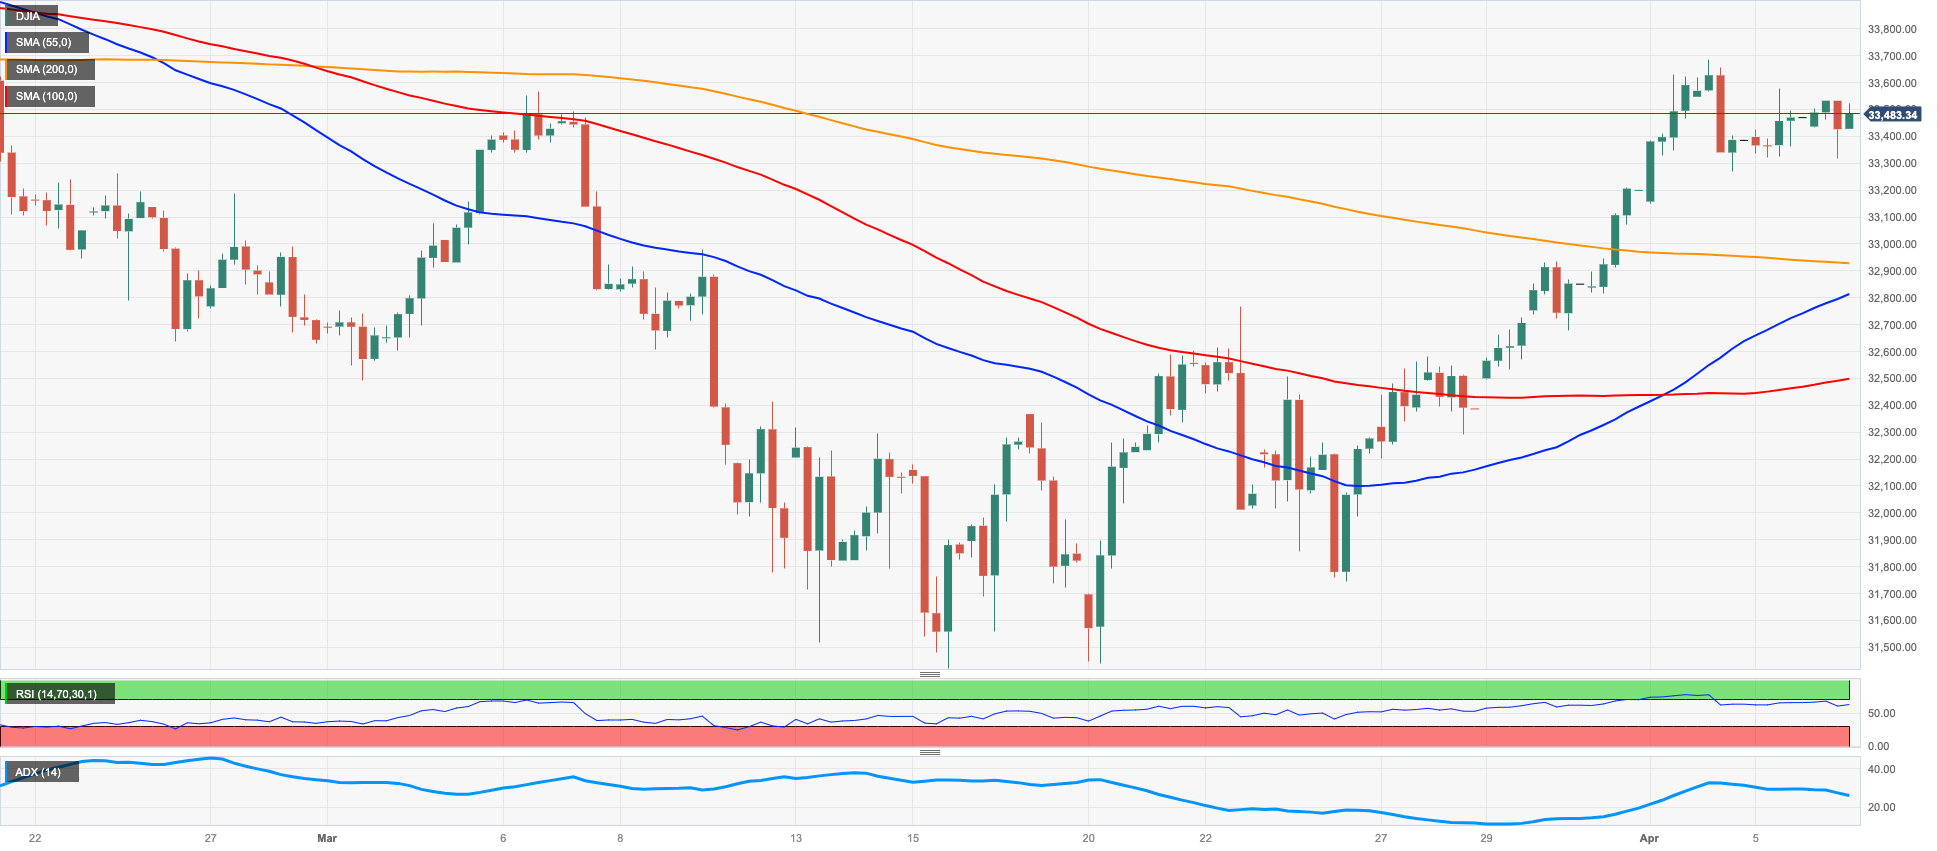
DOW JONES
US equities tracked by the Dow Jones managed to regain some composure and returned to the positive ground on Thursday, adding at the same time to gains seen in the previous session.
In the meantime, recession concerns continued to hover around markets and propped up the cautious tone among investors ahead of Friday’s inactivity due to the Easter holiday and the release of US Nonfarm Payrolls.
All in all, the Dow Jones gained 0.12% to 33512, the S&P500 rose 0.30% to 4102 and the tech-heavy Nasdaq Composite advanced 0.56% to 12064.
Extra gains in the Dow Jones remain focused on the April peak at 33634 (April 4) ahead of the 2023 high at 34342 (January 13) and the December 2022 top at 34712 (December 13). Once this level is cleared, the April 2022 peak at 35492 (April 21) could return to the investors’ radar prior to the February 2022 high at 35824 (February 9). Having said that, the 55-day SMA at 33158 emerges as an interim support before the more relevant 200-day SMA at 32454 and the 2023 low at 31429 (March 15). Further down aligns the 30000 mark seconded by the 2022 low at 28660 (October 13). The daily RSI advanced marginally past 60.
Top Performers: Microsoft, Honeywell, Amgen
Worst Performers: Caterpillar, Salesforce Inc, IBM
Resistance levels: 33634 34334 34712 (4H chart)
Support levels: 32624 31805 31429 (4H chart)
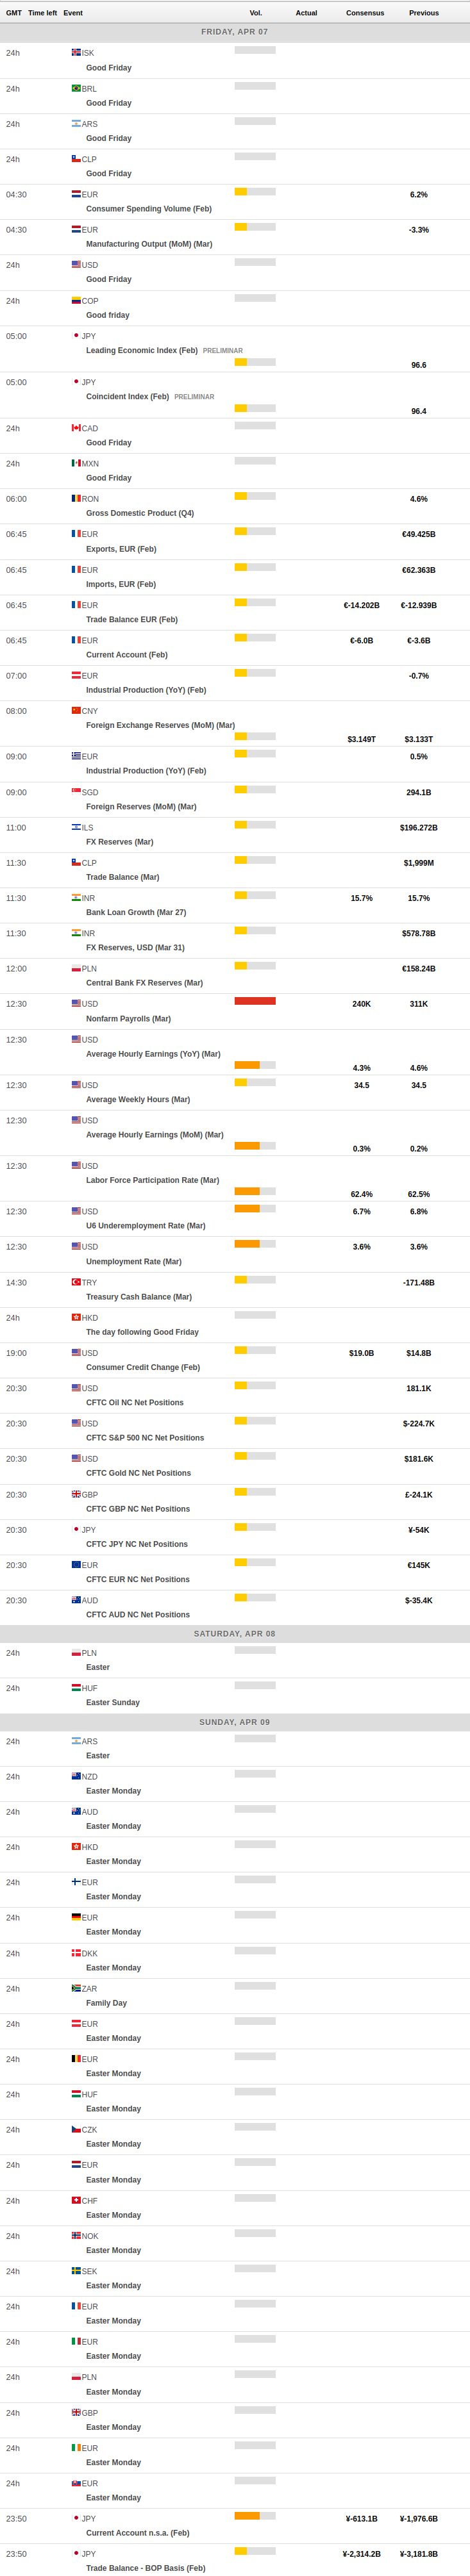
MACROECONOMIC EVENTS
All Information & Updates provided by:

All information relating to the financial markets available on this page has been prepared and issued by FXStreet (Forexstreet SL, Spain, Reg: B62498233) on the basis of publicly available information and all information believed to be reliable and does not conflict with Kuwaiti local laws, and all necessary care has been taken to before the company to ensure that the facts mentioned are correct from the source.
NCM Investment nor any of its directors or employees shall in any way be held responsible for the contents of this news, and the information contained on this page is intended only to provide clients with publicly available information and should not be construed as investment advice, report or analysis and/or constitute an offer or invitation to buy or sell financial instruments of any kind.
RISK WARNING: Forex and CFDs are highly risky leveraged products, as losses can exceed deposits. Please ensure you understand all the risks and take independent advice if necessary. NCM will segregate the clients based on the criteria of the regulator and its bylaws. NCM does not provide any advisory service; the material published does not constitute advice or a recommendation for a transaction in any financial instrument. NCM accepts no responsibility for any use of the content presented and any consequences of that use. Anyone acting on the information provided does so at their own risk.