
- Contact Us:
-

-

-

-


Daily Market Updates
10 Apr 2023
USDJPY
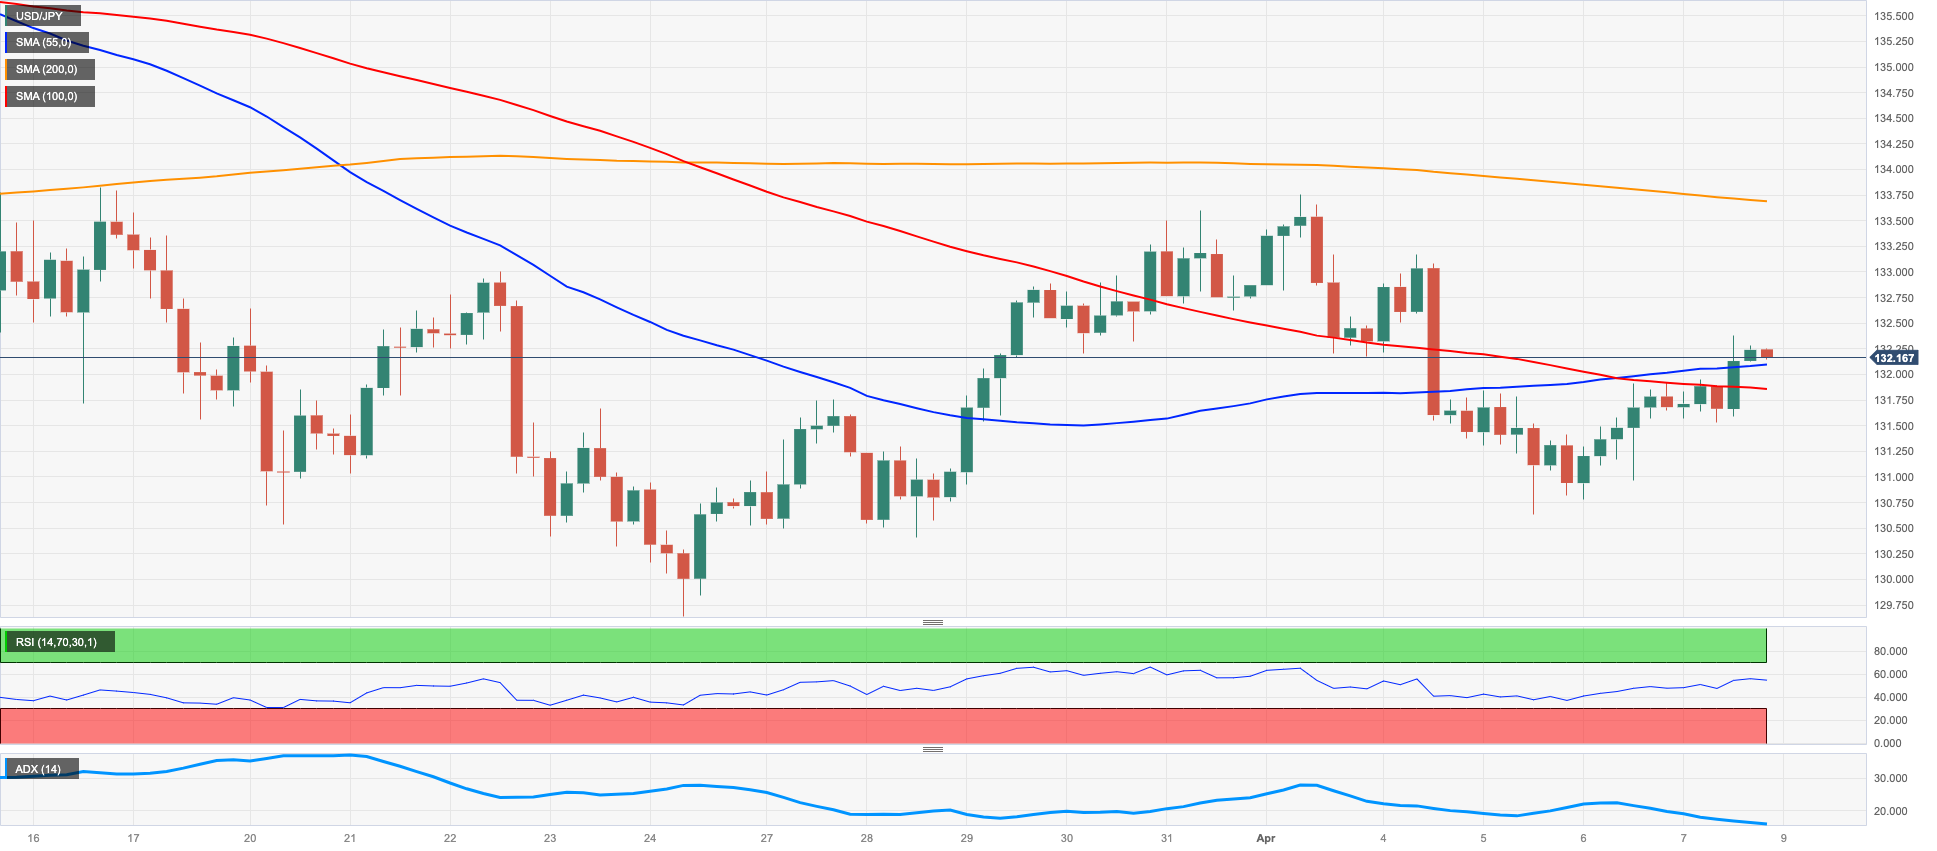
USD/JPY added to Thursday’s gains and extended further the bounce off weekly lows near 130.60 (April 5), managing to reclaim the area beyond the 132.00 hurdle at the end of the week.
The continuation of the weekly recovery in the greenback saw the USD Index (DXY) regain the 102.00 barrier and beyond, while strong readings from US Nonfarm Payrolls (+236K in March) lent much needed oxygen to US yields across the curve.
In Japan, the JGB 10-year yields traded within a very tight range.
In what was his last press conference, BoJ’s H. Kuroda said the ultra-accommodative monetary stance has been effective for prices and the economy. He added that the current tight labour market bodes well for higher wages and noted that non-traditional policy is to be assessed from here on. Kuroda finally suggested that achieving the 2% stable price target is now closer.
In the calendar, Household Spending expanded 1.6% in the year to February. In addition, preliminary readings saw the Coincident Index and the Leading Economic Index expected to have improved to 99.2 and 97.7, respectively, in February.
Next on the upside for USD/JPY comes the weekly peak at 133.75 (April 3) prior to the key 200-day SMA at 137.20 and just before the 2023 high at 137.91 (March 8). Further gains could retest weekly tops at 139.89 (November 30 2022) and 142.25 (November 21 2022). On the contrary, the March low at 129.63 (March 24) appears as the immediate support level ahead of the February low at 128.08 (February 2) and the 2023 low at 127.21 (January 16). The daily RSI rebounded past the 47 mark.
Resistance levels: 133.16 133.74 135.11 (4H chart)
Support levels: 130.62 130.40 129.63 (4H chart)
GBPUSD
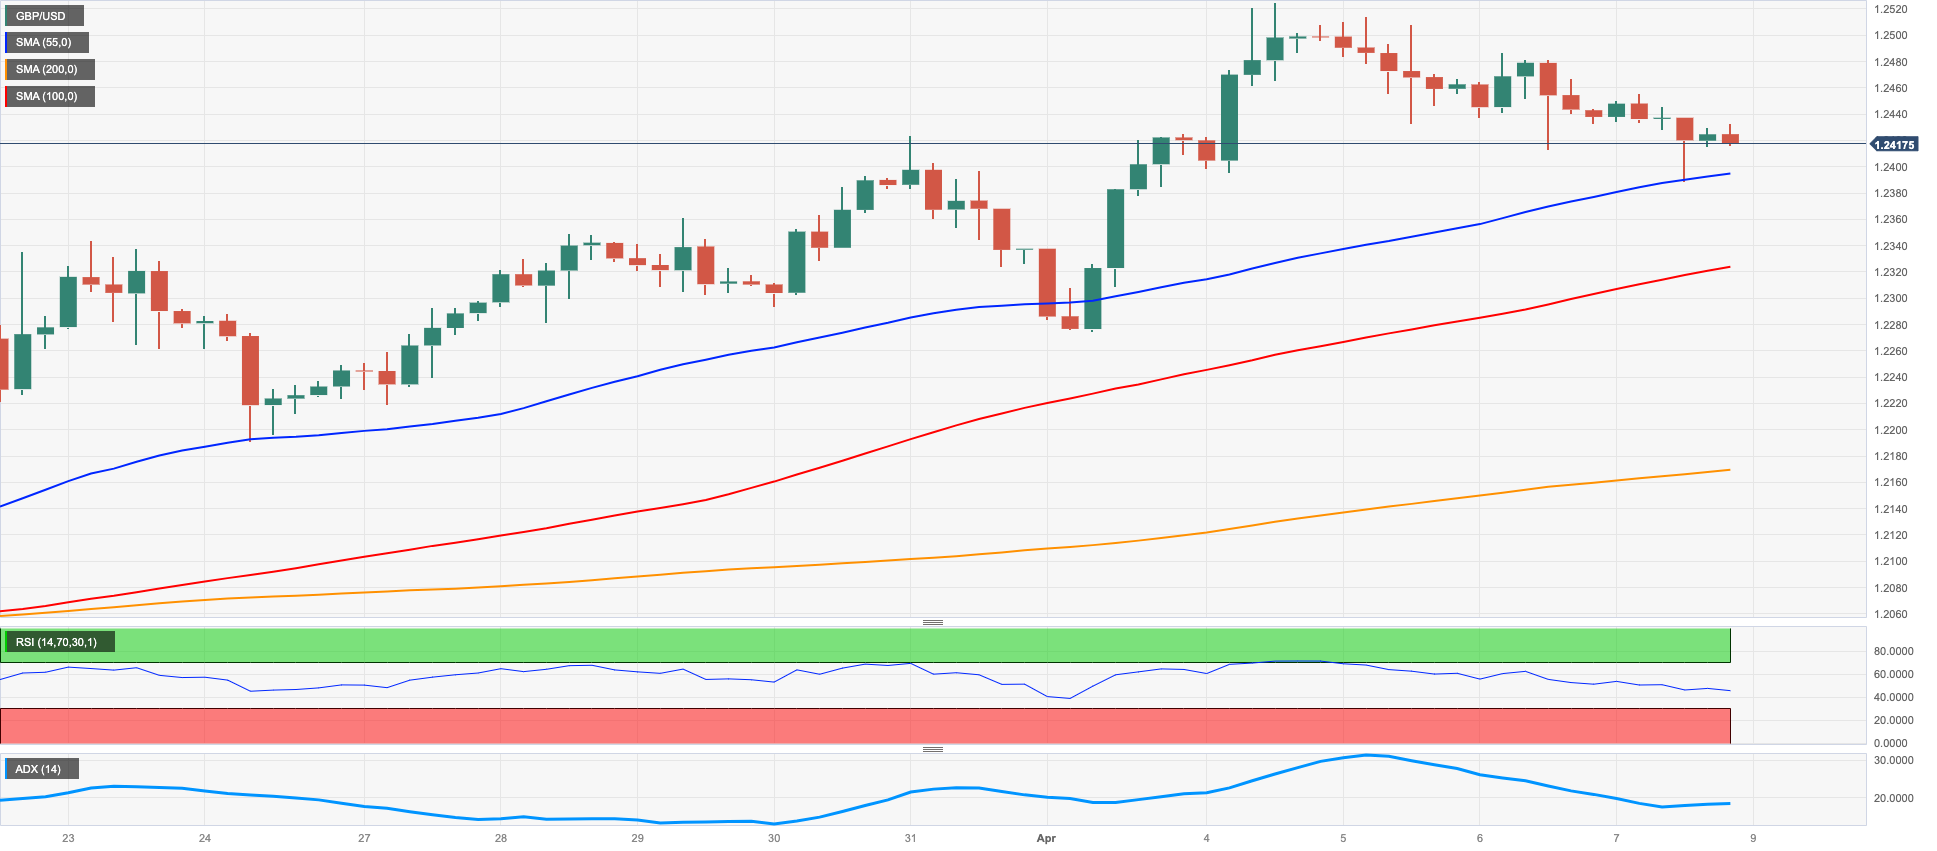
Further improvement in the greenback kept propping up the corrective retracement in the risk complex and forced GBP/USD to retreat for the third consecutive session, this time piercing the key 1.2400 support to record fresh multi-day lows on Friday.
As a matter of fact, the dollar accelerated its upside on the back of another firm monthly increase in new jobs in the US economy (236K), which at the same time morphed into rising bets of a 25 bps rate raise by the Fed at the May 3 event.
In the meantime, Cable maintained the positive weekly streak despite the poor price action seen in the last three sessions, as bears failed to eclipse a very promising start of the week, including a move to new highs past 1.2500 the figure.
Markets were closed across the Channel and the calendar was empty due to the Good Friday Holiday.
The 2023 high at 1.2525 (April 4) emerges as the immediate up-barrier for GBP/USD ahead of the May 2022 top at 1.2666 (May 27) and the 200-week SMA at 1.2868, which is deemed as the last defense of a test of the psychological 1.3000 yardstick. Just the opposite, the April low at 1.2274 (April 3) aligns as the initial support prior to temporary contention areas at the 55- and 100-day SMAs at 1.2173 and 1.2157, respectively. South from here emerges the weekly low at 1.2010 (March 15) seconded by the key 200-day SMA at 1.1899 and the 2023 low at 1.1802 (March 8). The daily RSI grinded lower and approached 59.
Resistance levels: 1.2486 1.2525 1.2599 (4H chart)
Support levels: 1.2389 1.2274 1.2189 (4H chart)
AUDUSD
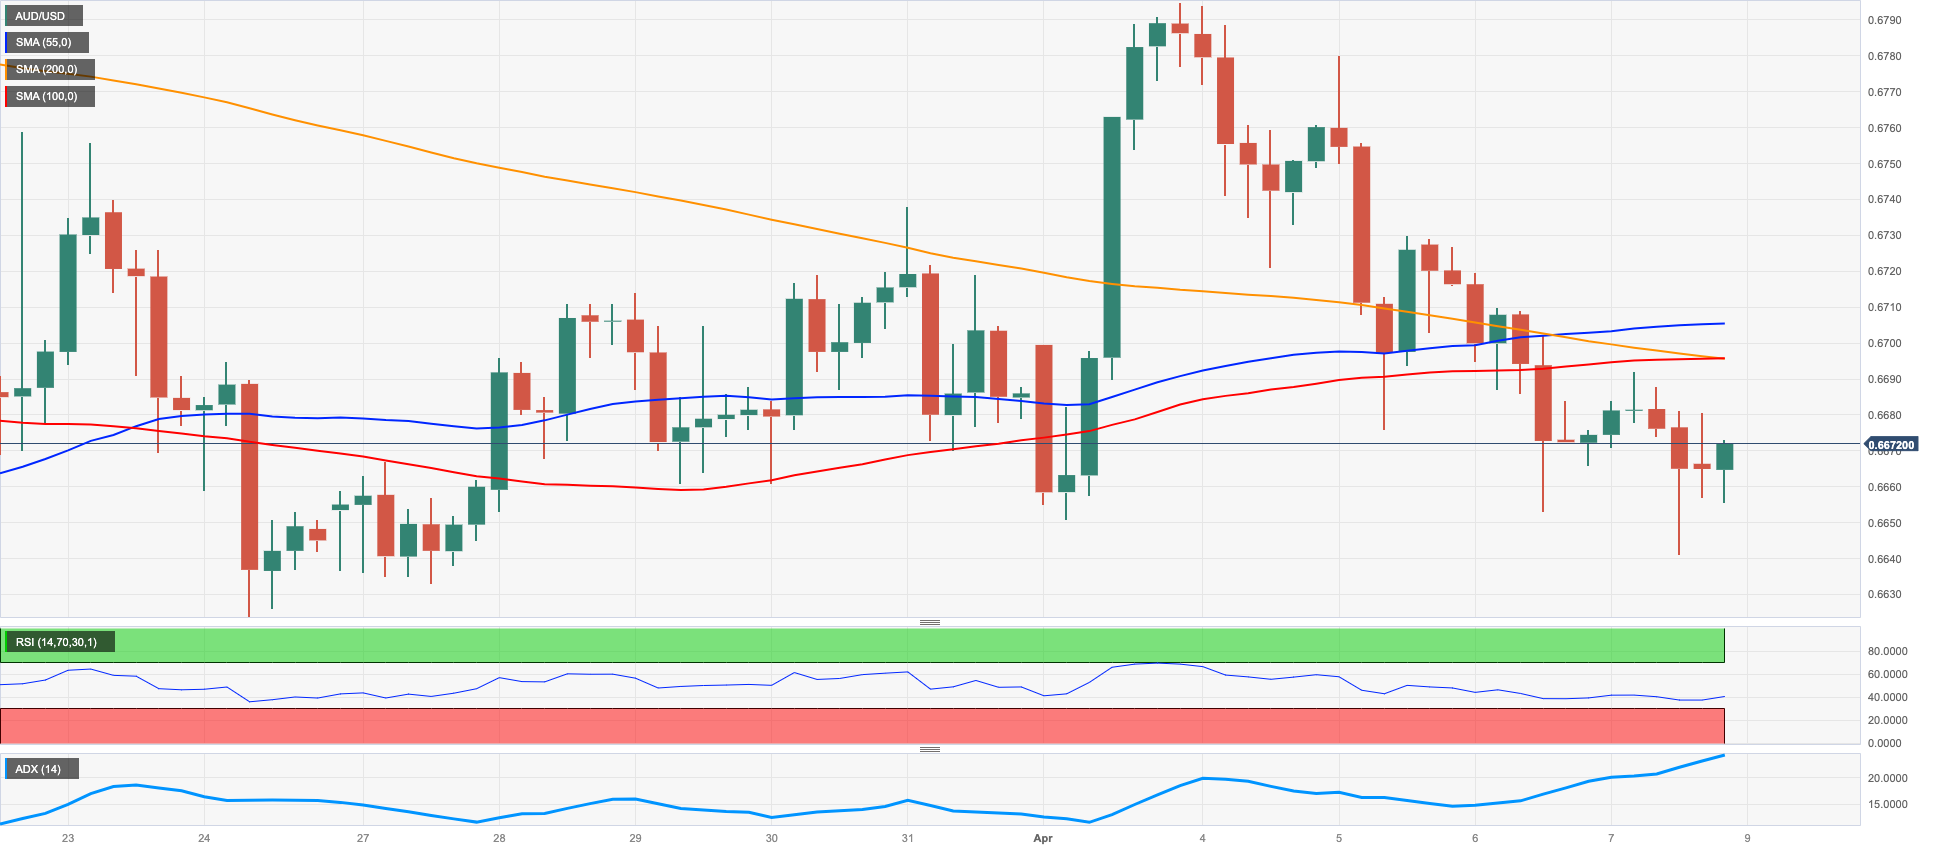
The broad-based offered stance in the risk-associated universe coupled with the flattish mood in the greenback and higher US yields all put the Aussie dollar under heavy pressure and forced AUD/USD to lose ground for the fourth consecutive session on Good Friday.
Additionally, the inactivity in the commodity complex played against any meaningful recovery attempt in the pair.
The recent breakdown of the key 200-day SMA (0.6745) seems to have also opened the door to the continuation of the leg lower in the short-term horizon at least.
There were no data releases nor market activity in Oz at the end of the week.
AUD/USD now faces the tangible possibility of a drop to the 2023 low at 0.6563 (March 10), while the loss of this level could expose a probable visit to the weekly low at 0.6386 (November 10 2022) followed by the November 2022 low at 0.6272 (November 3). The other way around, the immediate hurdle appears at the 200-day SMA at 0.6745 prior to the April peak at 0.6793 (April 4), which precedes the temporary 100-day SMA at 0.6798 and lies just ahead of the interim 55-day SMA at 0.6808. The breakout of the latter could put the key round level at 0.7000 back on the radar ahead of the weekly high at 0.7029 (February 14). The daily RSI grinder lower to the sub-45 region.
Resistance levels: 0.6699 0.6779 0.6793 (4H chart)
Support levels: 0.6640 0.6625 0.6589 (4H chart)
GOLD
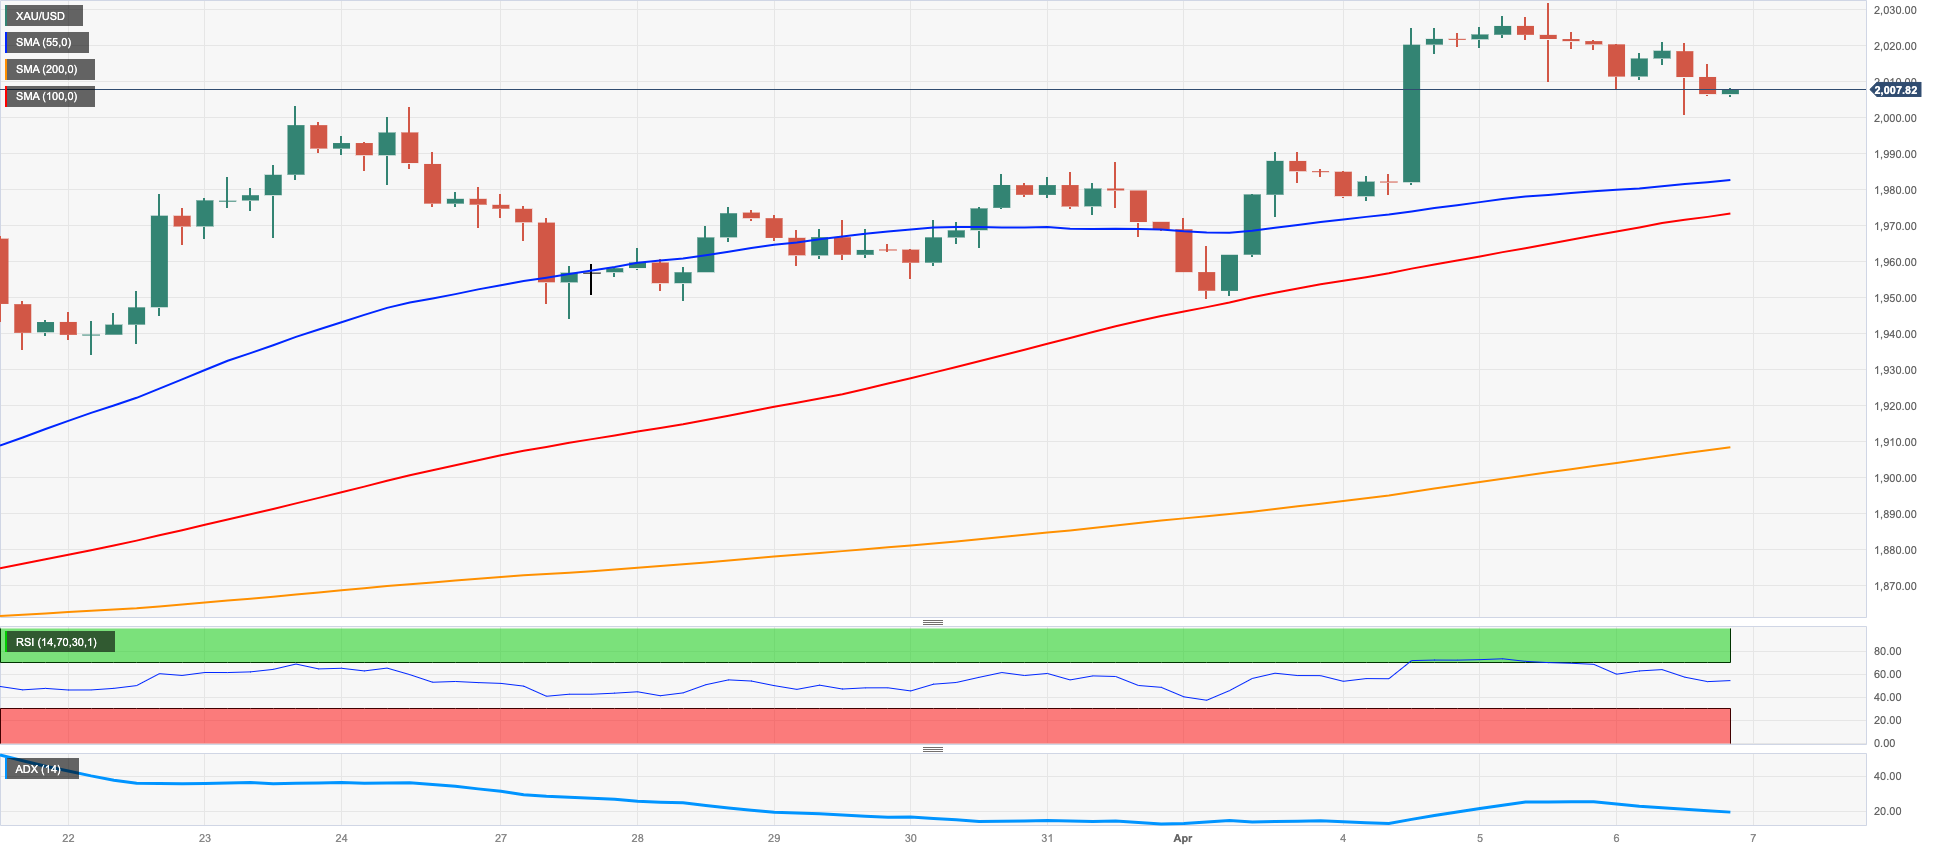
Prices of the ounce troy of the yellow metal appear to have met a firm resistance zone in the $2030 region, or YTD highs, for the time being.
Despite the inactivity in the commodity complex on Good Friday, the rebound in the dollar along with the marked bounce in US yields across the curve are expected to put some extra pressure on bullion as soon as traders return to their desks.
Also weighing on the yellow metal emerges the now rising bets for a 25 bps rate hike by the Federal Reserve at the May gathering, a view that gathered fresh support in the wake of another firm result from the US jobs report on Friday.
The outlook for gold prices continues to face upside risks. Against that, once the 2023 top at $2032 (April 5) is cleared, then the commodity could challenge the 2022 peak at $2070 (March 8) closely followed by the all-time high at $2075 (August 7 2020). On the opposite side, there is still a minor support at the weekly low at $1934 (March 22) ahead of interim contention at the 55- and 100-day SMAs at $1901 and $1861, respectively. The loss of this region exposes the March low at $1809 (March 8) followed by the 2023 low at $1804 (February 28) and the key 200-day SMA at $1787.
Resistance levels: $2032 $2070 $2075 (4H chart)
Support levels: $2000 $1982 $1949 (4H chart)
CRUDE WTI
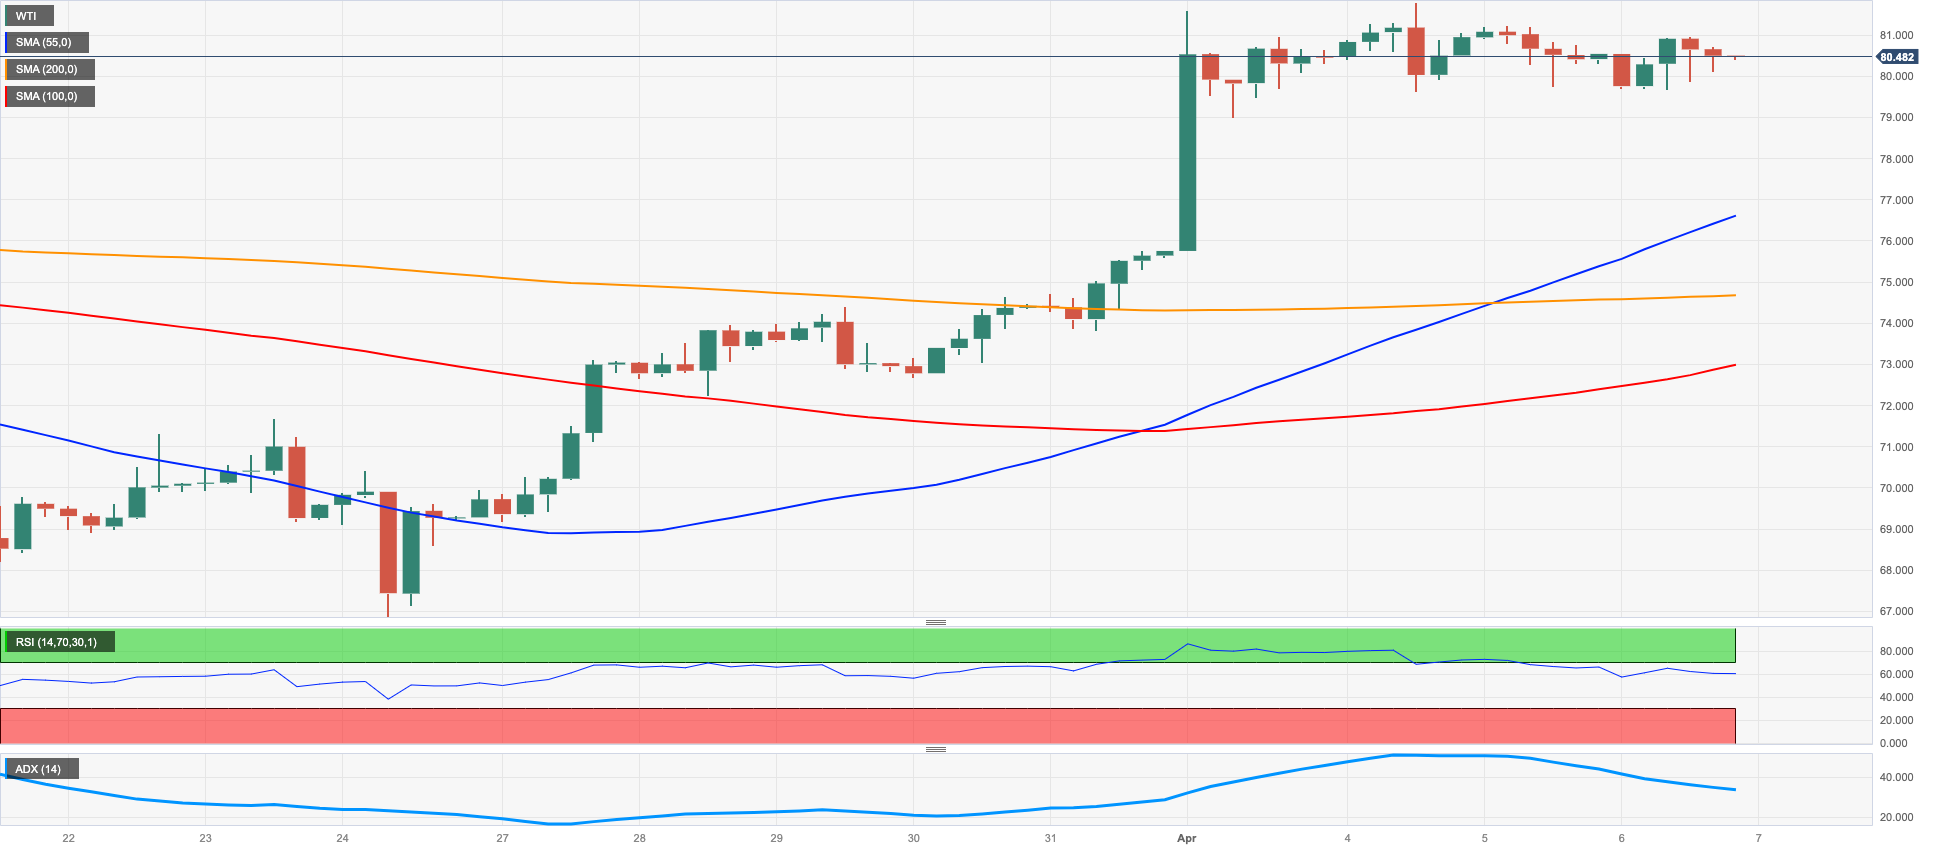
WTI prices rose for the third straight week exclusively boosted by the announcement that the OPEC+ will reduce oil output by around 1.7 mbpd.
However, the commodity failed to sustain the post-OPEC+ peak around $81.70 per barrel on the back of rising concerns that the US (and global) economy could slow down in the next periods in response to the monetary tightening by the Fed and other major central banks.
Those recession jitters returned to the fore at the end of the week after the US economy added 236K jobs during March, as indicated by the Nonfarm Payrolls, as well as renewed expectations of a 25 bps rate hike in May.
Closing the weekly calendar, driller Baker Hughes reported that the US oil rig count dropped by 2 in the week to April 7, taking the total US active oil rigs to 590.
Further gains in the WTI should leave behind the April top at $81.75 (April 4) ideally in the very near term to confront the 2023 peak at $82.60 (January 23) and the December 2022 high at $83.32 (December 1). Up from here comes the November 2022 top at $93.73 (November 7). Contrarily, the April low at $79.05 (April 3) appears as an initial support seconded by the provisional 100- and 55-day SMAs at $76.75 and $76.08, respectively The loss of this area could put the commodity en route to test the $66.86 level (March 24) prior to the 2023 low at $64.41 (March 20) and the December 2021 low at $62.46 (December 2).
Resistance levels: $81.75 $82.60 $83.32 (4H chart)
Support levels: $78.97 $74.62 $72.57 (4H chart)
GER40
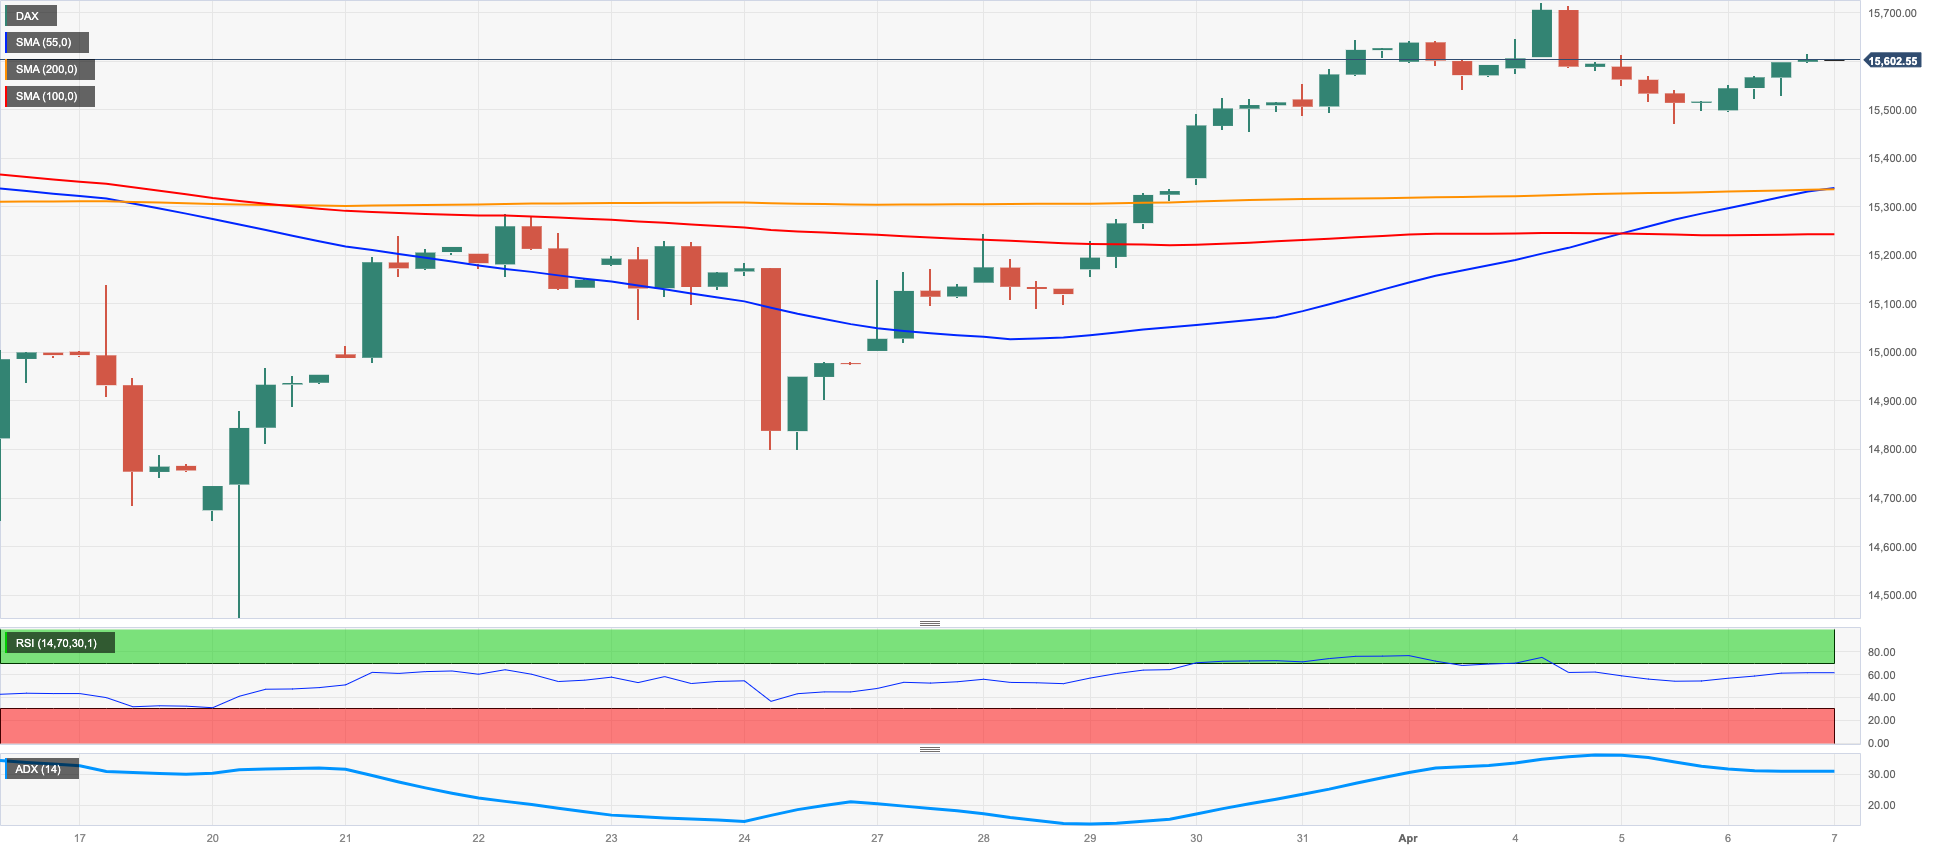
There was no activity in the German stock market on Good Friday, in line with the rest of its European peers.
In the meantime, the benchmark index appears to have met some tough resistance around the 15700 region so far, as market participants shifted to a more cautious stance amidst recession fears on both sides of the Atlantic as well as the persistent hawkish message from ECB policy makers regarding the continuation of the hiking cycle in the euro area.
In the German money market, the recent pick-up in the demand for bonds put yields under further pressure and forced the 10-year Bund yields to recede below the 2.20% zone.
Immediately to the upside for the DAX40 appears the April peak at 15736 (April 4) followed by the round level at 16000 and the 2022 high at 16285 (January 5). Having said that, the 55- and 100-day SMAs at 15314 and 14908 turn up as temporary contention levels, respectively, before the minor support at 14809 (March 24) and the March low at 14458 (March 20). Down from here, the index could put the key 200-day SMA at 13981 to the test. The daily RSI gathered steam and approached 58.
Best Performers: Vonovia, Symrise AG, Commerzbank
Worst Performers: Siemens AG, Deutsche Telekom, Beiersdorf AG
Resistance levels: 15736 15912 16090 (4H chart)
Support levels: 15482 15237 14809 (4H chart)
NASDAQ
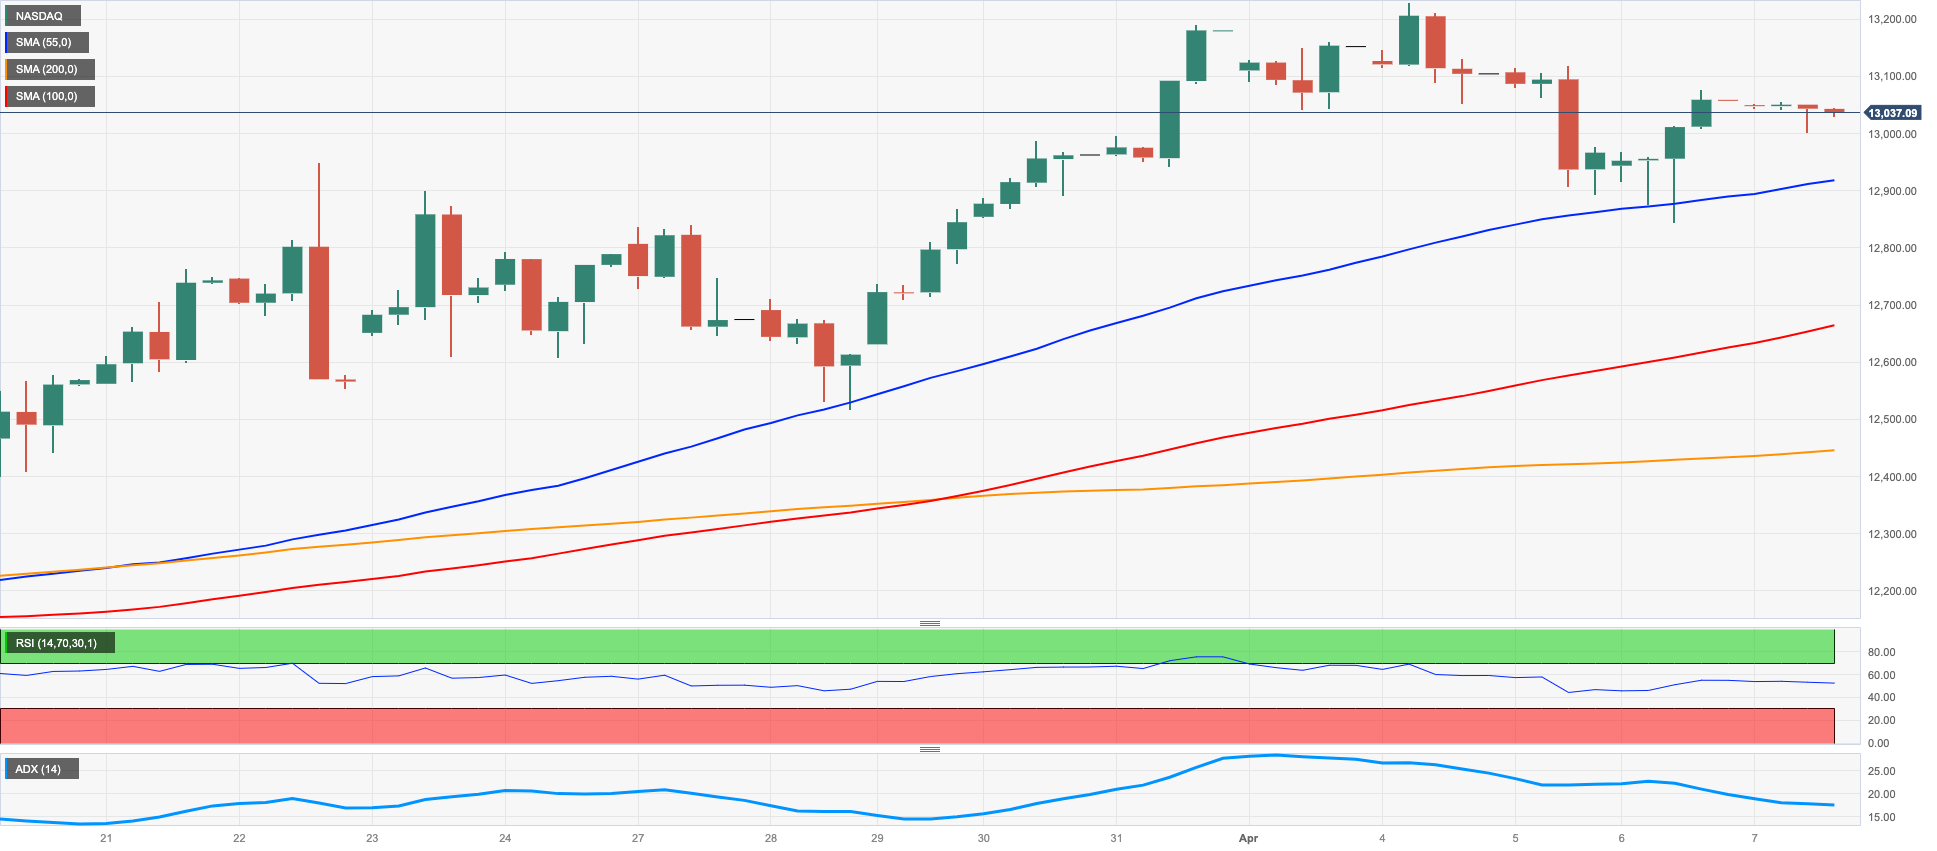
The tech reference Nasdaq 100 set aside three consecutive daily retracements and regained the area just above the 13000 mark at the end of last week.
The marked advance, however, was not enough to keep the positive streak alive for the fourth week in a row.
Declining US yields lent support to the tech sector in the second half of the week, although the rising perception that the economy could enter a recession period later in the year should keep investors on the cautious side of the trade in the near term.
Extra gains in the Nasdaq 100 are seen facing the next hurdle at the 2023 high at 13204 (April 4) prior to the August 2022 top at 13720 (August 16) and the round level at 14000. Further north emerges the March 2022 top at 15265 (March 29). In opposition, the next support of note appears at the weekly low at 12517 (March 28) ahead of the provisional 55-day SMA at 12362 and the key 200-day SMA at 11962. The breakdown of this region could motivate the index to challenge the March low at 11695 (March 13) ahead of weekly lows at 11550 (January 25) and 11251 (January 19), all before the 2023 low at 10696 (January 6). The daily RSI rose to the boundaries of 63.
Top Gainers: Alphabet A, Alphabet C, Micron
Top Losers: Airbnb, Applied Materials, Costco
Resistance levels: 13204 13720 14277 (4H chart)
Support levels: 12846 12517 11934 (4H chart)
DOW JONES
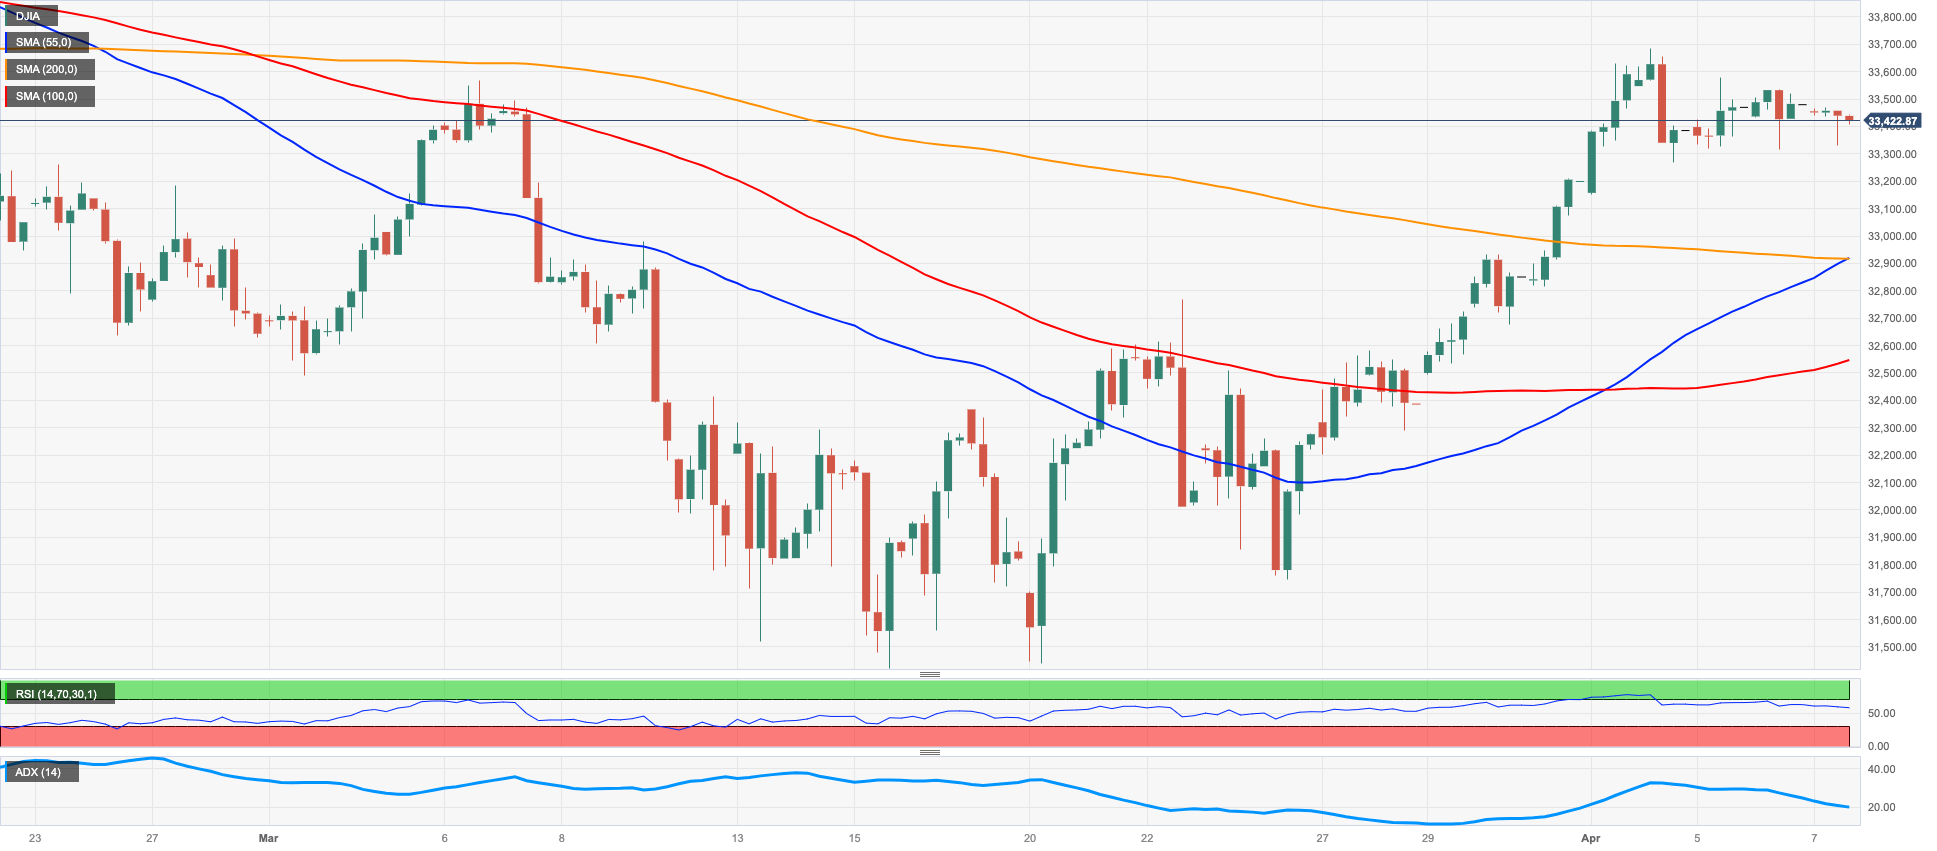
The US stock benchmark Dow Jones closed the third consecutive week with gains and approached the 78.6% Fibo retracement (of the February-March steep pullback) around the 33600 region, an area also coincident with the 100-week SMA.
The strong recovery from the 2023 lows near the 31400 area (March 15) has been on the back of rising conviction that the Fed might pause its hiking cycle at the May event, although the late resurgence of recession fears has been also weighing on investors’ sentiment and reinforced by extra evidence of the loss of momentum in key fundamentals, like the labour market.
So far, the Dow Jones advanced 0.01% to 33485, the S&P500 gained 0.36% to 4105 and the tech-reference Nasdaq Composite rose 0.76% to 12087.
The next key target on the upside for the Dow Jones remains at the April high at 33634 (April 4) prior to the 2023 top at 34342 (January 13) and the December 2022 peak at 34712 (December 13). The breakout of the latter could prompt the April 2022 high at 35492 (April 21) to emerge on the horizon ahead of the February 2022 top at 35824 (February 9). On the other hand, provisional contention appears at the 55-day SMA at 33157 seconded by the 200-day SMA at 32454 and the 2023 low at 31429 (March 15). The breach of this level could put the 30000 mark on the radar ahead of the 2022 low at 28660 (October 13). The daily RSI remained consolidative near 60.
Top Performers: Microsoft, Walmart, UnitedHealth
Worst Performers: Caterpillar, Salesforce Inc, American Express
Resistance levels: 33634 34334 34712 (4H chart)
Support levels: 32624 31805 31429 (4H chart)
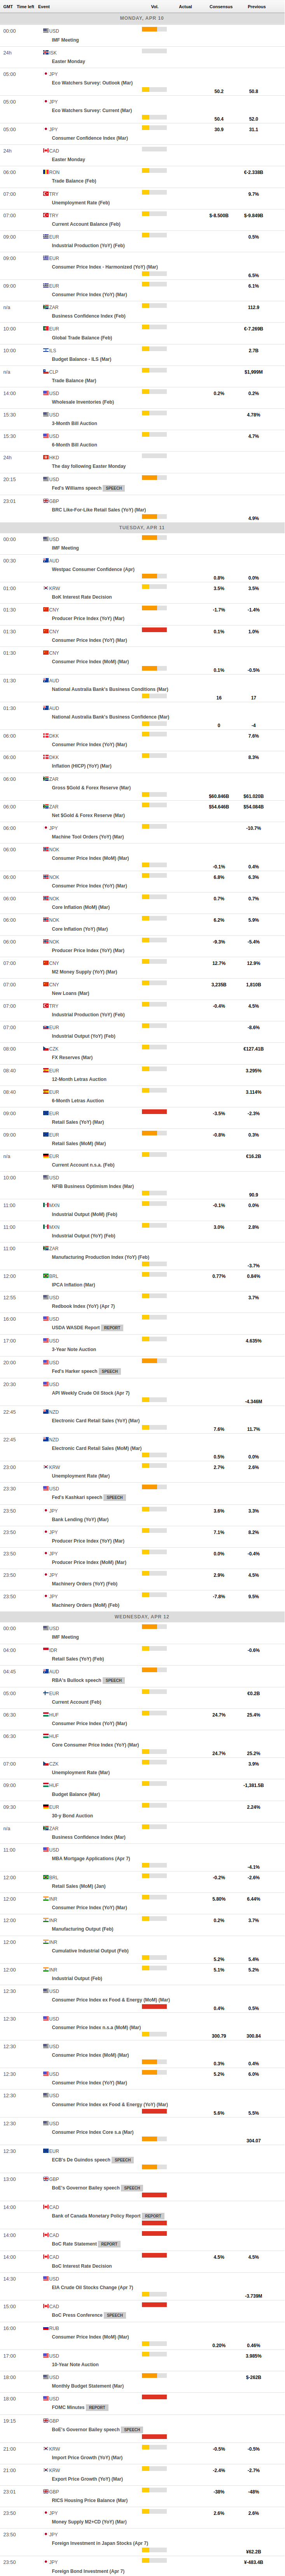
MACROECONOMIC EVENTS
All Information & Updates provided by:

All information relating to the financial markets available on this page has been prepared and issued by FXStreet (Forexstreet SL, Spain, Reg: B62498233) on the basis of publicly available information and all information believed to be reliable and does not conflict with Kuwaiti local laws, and all necessary care has been taken to before the company to ensure that the facts mentioned are correct from the source.
NCM Investment nor any of its directors or employees shall in any way be held responsible for the contents of this news, and the information contained on this page is intended only to provide clients with publicly available information and should not be construed as investment advice, report or analysis and/or constitute an offer or invitation to buy or sell financial instruments of any kind.
RISK WARNING: Forex and CFDs are highly risky leveraged products, as losses can exceed deposits. Please ensure you understand all the risks and take independent advice if necessary. NCM will segregate the clients based on the criteria of the regulator and its bylaws. NCM does not provide any advisory service; the material published does not constitute advice or a recommendation for a transaction in any financial instrument. NCM accepts no responsibility for any use of the content presented and any consequences of that use. Anyone acting on the information provided does so at their own risk.