
- Contact Us:
-

-

-

-


Daily Market Updates
11 Apr 2023
USDJPY
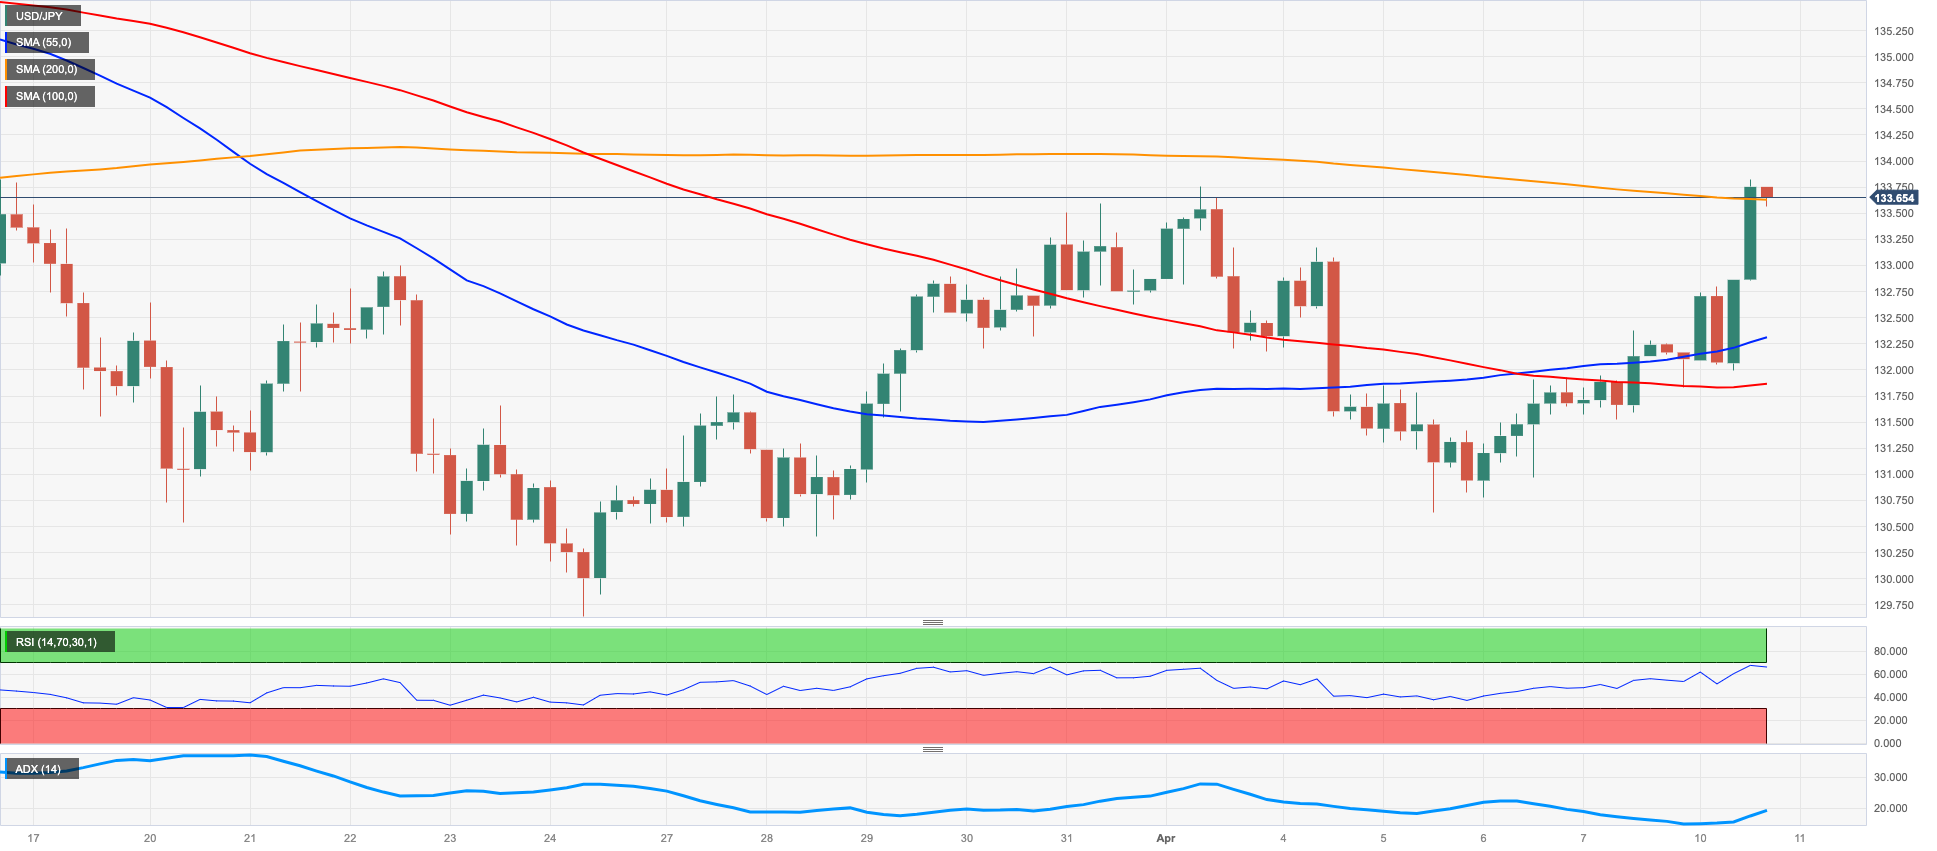
Further strength in the dollar in combination with the continuation of the recovery in US yields across the curve sponsored the third consecutive daily uptick in USD/JPY, this time trading at shouting distance from the 134.00 hurdle on Monday, or new monthly highs.
In addition, firmer conviction that the Fed might eventually raise the Fed Funds Target Range by another 25 bps at the May gathering also added to the upside momentum in the pair, particularly following another healthy US job report for the month of March.
From the BoJ, Governor K.Ueda said that the bank’s challenge is how to continue with monetary easing, at the time when he stressed that the bank’s ultra-accommodative stance has helped Japan leave deflation.
In the calendar, Consumer Confidence in Japan improved to 33.9 in March, while the Eco Watchers Survey Current rose to 53.9 in the same period and the Eco Watchers Survey Outlook climbed to 54.1.
USD/JPY clocked a new April high at 133.87 (April 10). The breakout of this level could prompt the key 200-day SMA at 137.19 to return to the investors’ radar prior to the 2023 top at 137.91 (March 8). The continuation of the uptrend could see peaks at 139.89 (November 30 2022) and 142.25 (November 21 2022) revisited. Just the opposite, there is an initial support at the March low at 129.63 (March 24) before the February low at 128.08 (February 2) and the 2023 low at 127.21 (January 16). The daily RSI bounced sharply and approached the 55 yardstick.
Resistance levels: 133.87 135.11 136.99 (4H chart)
Support levels: 131.90 130.62 130.40 (4H chart)
GBPUSD
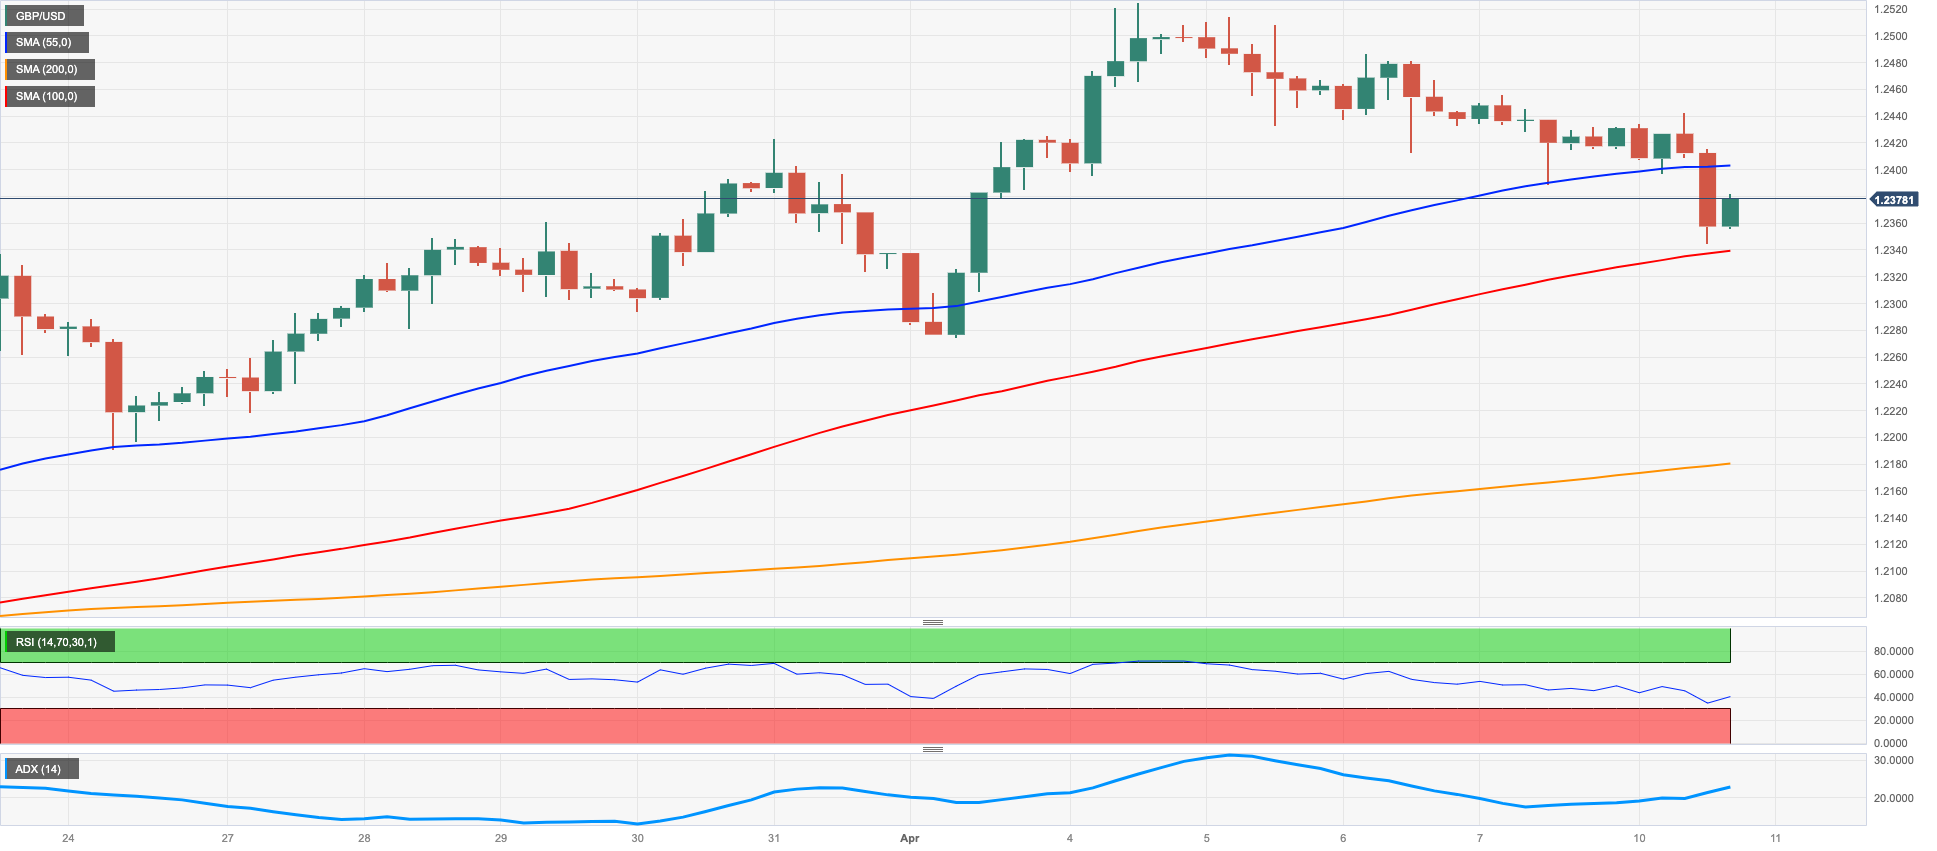
The sharp rebound in the dollar put the risk complex under heightened pressure and dragged GBP/USD to the mid-1.2300s, or multi-session lows, at the beginning of the week.
Indeed, Cable breached the 1.2400 support with certain conviction to print new lows in a context dominated by the dollar’s strength, higher yields and expectations that the Fed might not pause its tightening process next month.
There were no data releases scheduled in the UK calendar on Easter Monday.
Extra weakness could prompt GBP/USD to retest the April low at 1.2274 (April 3) ahead of the provisional 55- and 100-day SMAs at 1.2173 and 1.2162, respectively. The loss of this region could motivate the weekly low at 1.2010 (March 15) to re-emerge on the horizon followed by the key 200-day SMA at 1.1901 and the 2023 low at 1.1802 (March 8). On the flip side, the immediate up-barrier aligns at the 2023 top at 1.2525 (April 4) prior to the May 2022 peak at 1.2666 (May 27) and the 200-week SMA at 1.2867, just ahead of the psychological 1.3000 mark. The daily RSI lost the grip and approached the 57 area.
Resistance levels: 1.2442 1.2486 1.2525 (4H chart)
Support levels: 1.2344 1.2274 1.2189 (4H chart)
AUDUSD
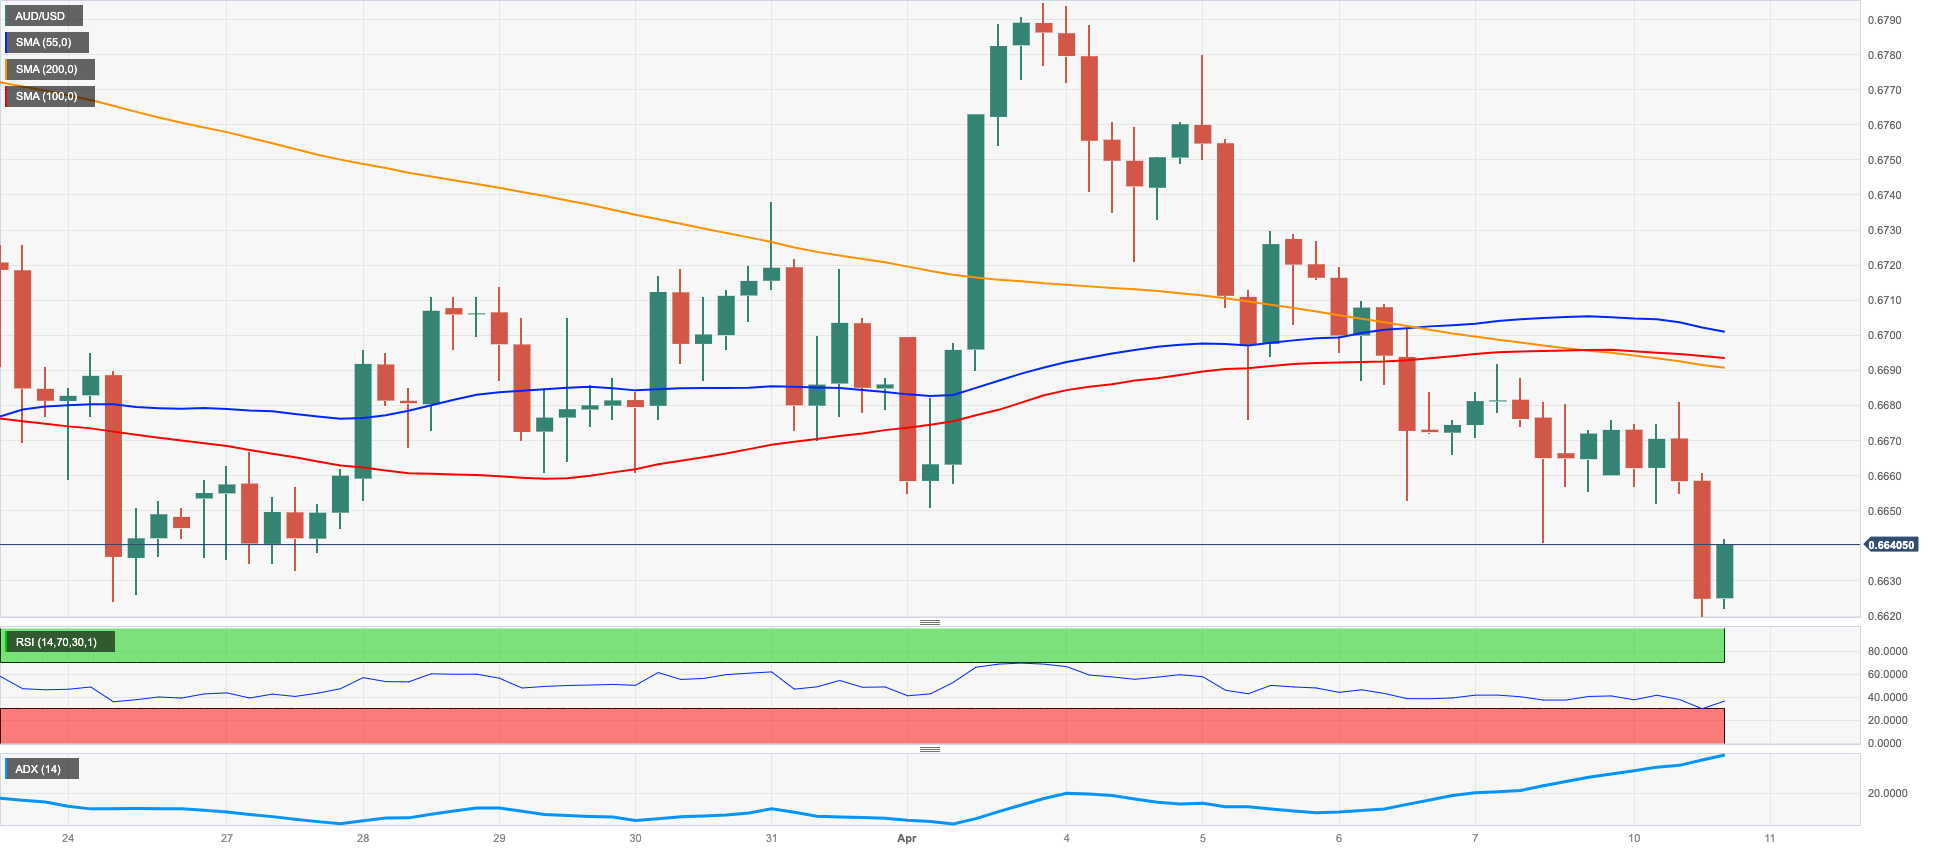
The prevailing risk-off sentiment morphed into extra selling pressure and dragged AUD/USD to levels last seen back in mid-March around the 0.6620 zone at the beginning of the week.
Indeed, the intense rebound in the greenback forced the Aussie dollar to lose ground for the fifth consecutive session on Monday. The downtick in spot was also bolstered by the downward bias witnessed in the commodity universe, where both copper prices and the iron ore remained on the defensive.
The Australian docket was empty on Monday.
Occasional bullish attempts in AUD/USD are expected to meet the next resistance area of note at the 200-day SMA at 0.6744 ahead of the April high at 0.6793 (April 4), an area also reinforced by the vicinity of the provisional 100- and 55-day SMAs. Further up emerges the key round level at 0.7000 seconded by the weekly top at 0.7029 (February 14). On the contrary, bears remain focused on the 2023 low at 0.6563 (March 10) ahead of the weekly low at 0.6386 (November 10 2022) and the November 2022 low at 0.6272 (November 3). The daily RSI debilitated further and approached the 42 zone.
Resistance levels: 0.6694 0.6779 0.6793 (4H chart)
Support levels: 0.6619 0.6589 0.6563 (4H chart)
GOLD
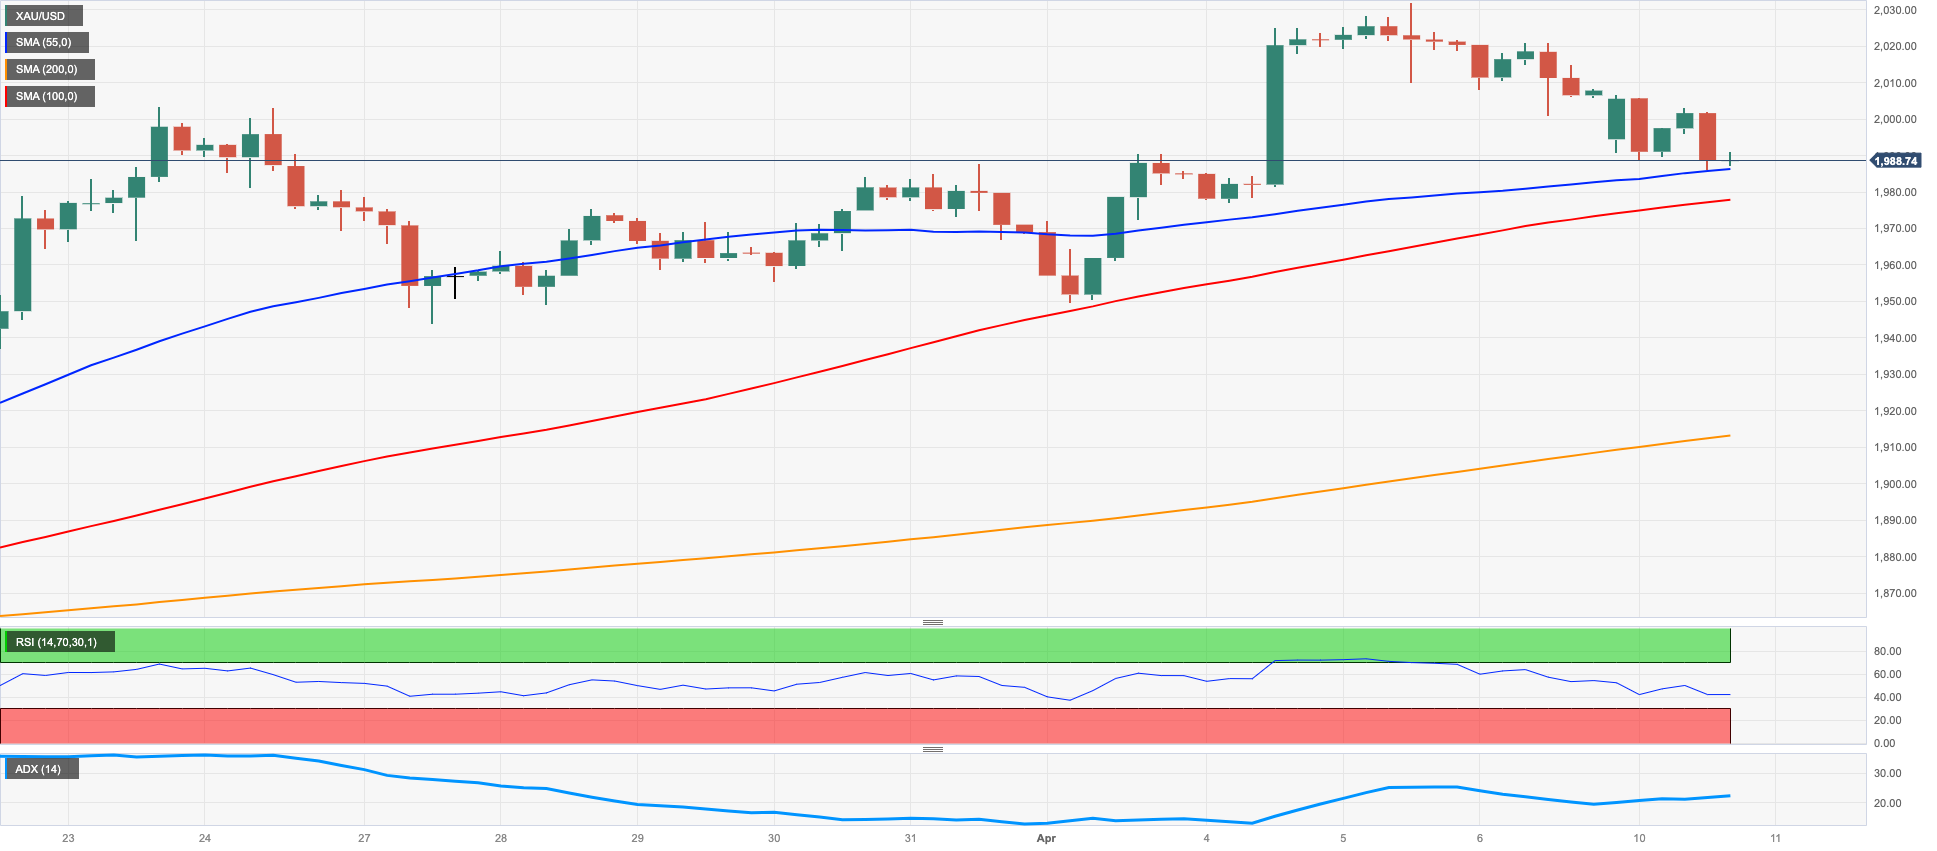
Gold prices added to Thursday’s losses and broke below the key $2000 support to record 3-day lows near $1980 on Monday.
The sharp move higher in the greenback coupled with further upside pressure in US yields across the curve undermined the recent rally in the yellow metal, while rising likelihood that the Fed might extend the tightening stance in May via another 25 bps rate hike also kept bullion’s price action depressed at the beginning of the week.
Moving forward, the precious metal is expected to see its volatility increase in the next couple of sessions in light of the publication of US inflation figures for the month of March on April 12.
The April low at $1949 (April 3) should offer some initial support in case the decline in gold accelerates. The loss of this level could spark a move to the weekly low at $1934 (March 22) prior to temporary support levels at the 55- and 100-day SMAs at $1903 and $1863, respectively. Down from here turns up the March low at $1809 (March 8) seconded by the 2023 low at $1804 (February 28) and the key 200-day SMA at $1788. The other way around, the breakout of the 2023 peak at $2032 (April 5) could shift the attention to the 2022 high at $2070 (March 8) just ahead of the all-time top at $2075 (August 7 2020).
Resistance levels: $2032 $2070 $2075 (4H chart)
Support levels: $1981 $1949 $1934 (4H chart)
CRUDE WTI
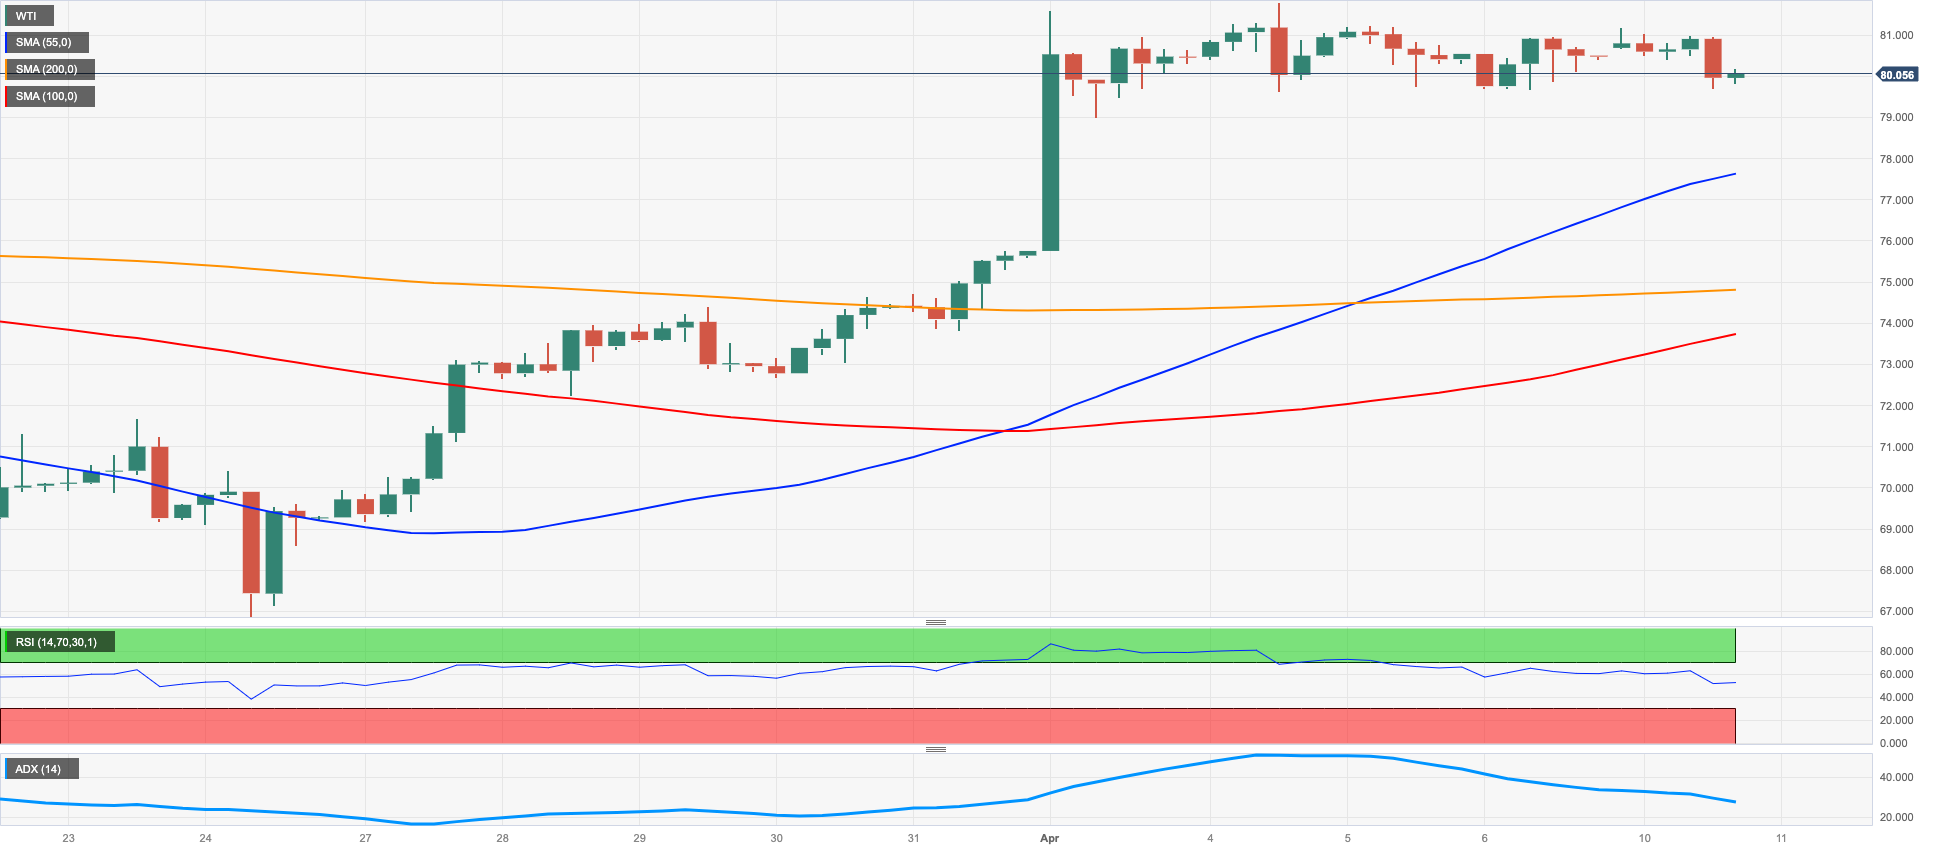
Prices of the West Texas Intermediate (WTI) extended the multi-session consolidative theme around the $80.00 mark per barrel at the beginning of the week.
The commodity traded in a vacillating mood against the backdrop of the strong rebound in the greenback and prospects for another rate hike by the Fed at its May 3 gathering.
In addition, recession concerns were also in play and somewhat counteracted the expected tighter supply in response to the recently announced OPEC+ reduction of the oil output.
It will be an interesting week for crude oil data wise, as the API and the EIA will publish their usual reports on US crude oil supplies on Tuesday and Wednesday, respectively, while the OPEC will release its monthly report on Thursday and the IEA’s report is due on Friday.
WTI faces the immediate hurdle at the April peak at $81.75 (April 4) seconded by the 2023 high at $82.60 (January 23) and the December 2022 top at $83.32 (December 1). The surpass of this level could pave the way for a potential test of the November 2022 peak at $93.73 (November 7). By contrast, the April low at $79.05 (April 3) lines up ahead of the temporary 100- and 55-day SMAs at $76.70 and $76.05, respectively, while the breach of this region could spark a deeper decline to the $66.86 level (March 24) ahead of the 2023 low at $64.41 (March 20) and the December 2021 low at $62.46 (December 2).
Resistance levels: $81.75 $82.60 $83.32 (4H chart)
Support levels: $78.97 $74.62 $72.57 (4H chart)
GER40
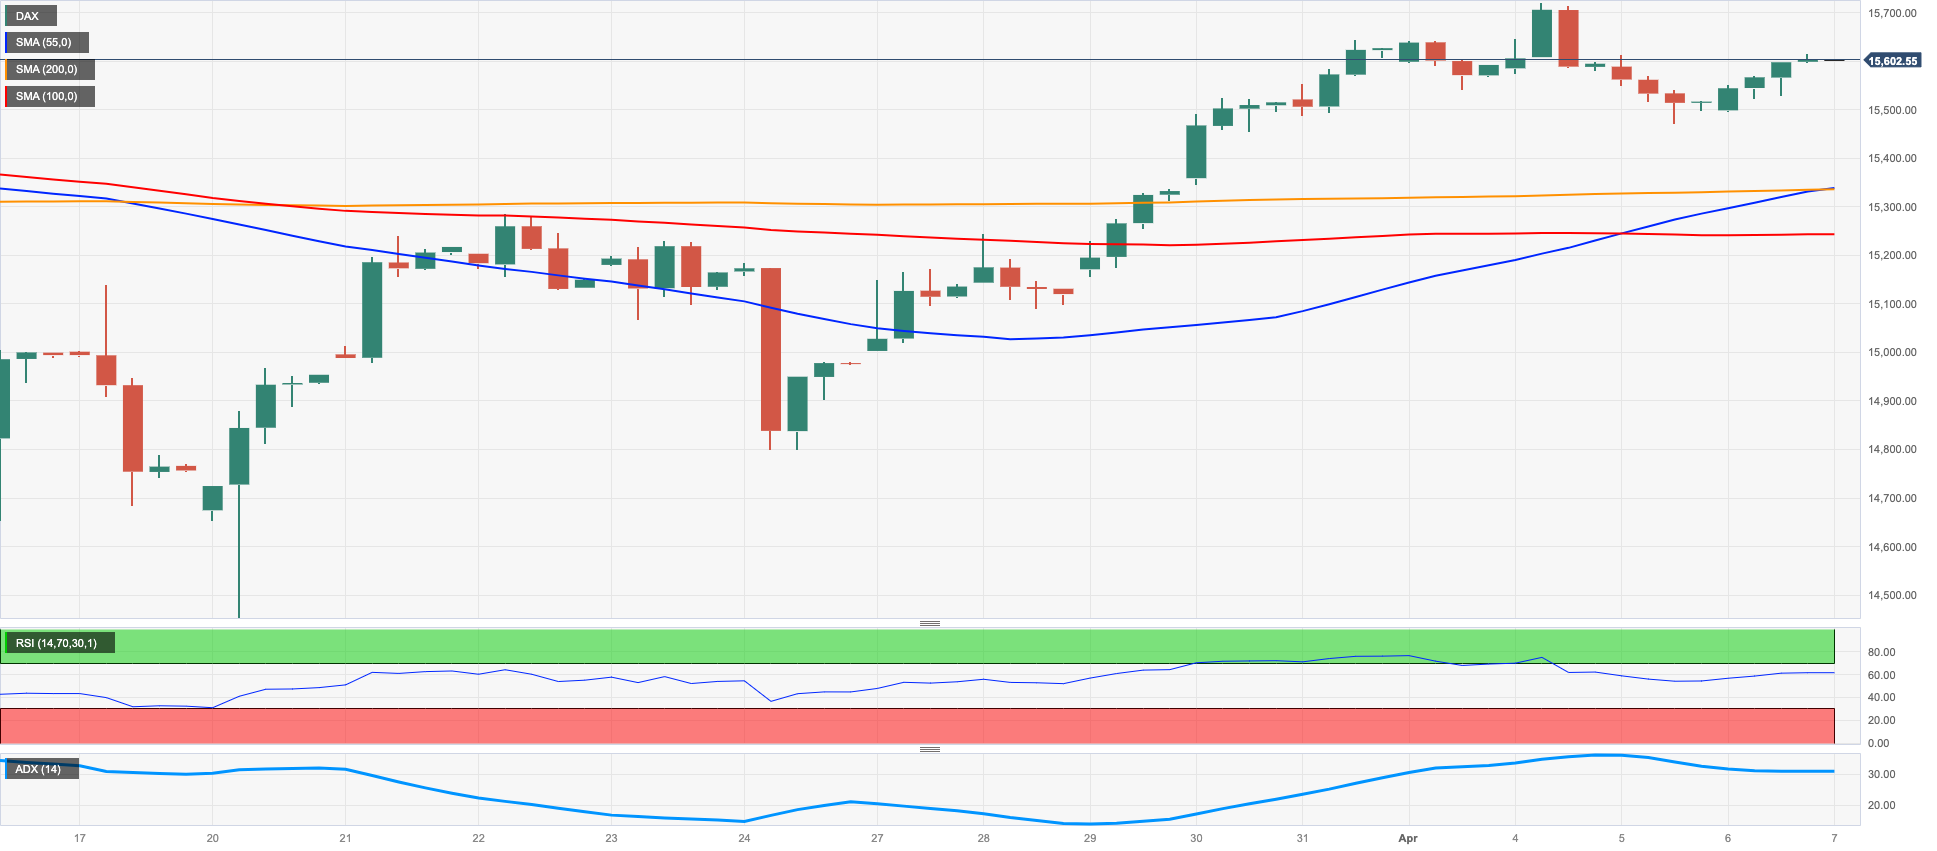
Markets in Germany and many of their European peers remained closed on Easter Monday.
In the meantime, recession concerns on both sides of the ocean are expected to keep investors’ sentiment subdued in the very near term and in light of the ECB and Fed monetary policy meetings in May, where so far market participants expect another 25 bps rate raise.
Moving forward, the salient events this week will be the FOMC Minutes and the release of the US inflation figures tracked by the CPI, which should shed further details on the potential next steps from the Fed regarding its tightening process.
Next on the upside for the DAX40 comes the April high at 15736 (April 4), while a break above this level could prompt the index to confront the round level at 16000 prior to the 2022 top at 16285 (January 5). On the other hand, there are provisional support levels at the 55- and 100-day SMAs at 15314 and 14908, respectively, seconded by the minor support at 14809 (March 24) and the March low at 14458 (March 20). The loss of the latter exposes the key 200-day SMA at 13981. The daily RSI flirted with the 58 zone.
Best Performers: Vonovia, Symrise AG, Commerzbank
Worst Performers: Siemens AG, Deutsche Telekom, Beiersdorf AG
Resistance levels: 15736 15912 16090 (4H chart)
Support levels: 15482 15237 14809 (4H chart)
NASDAQ
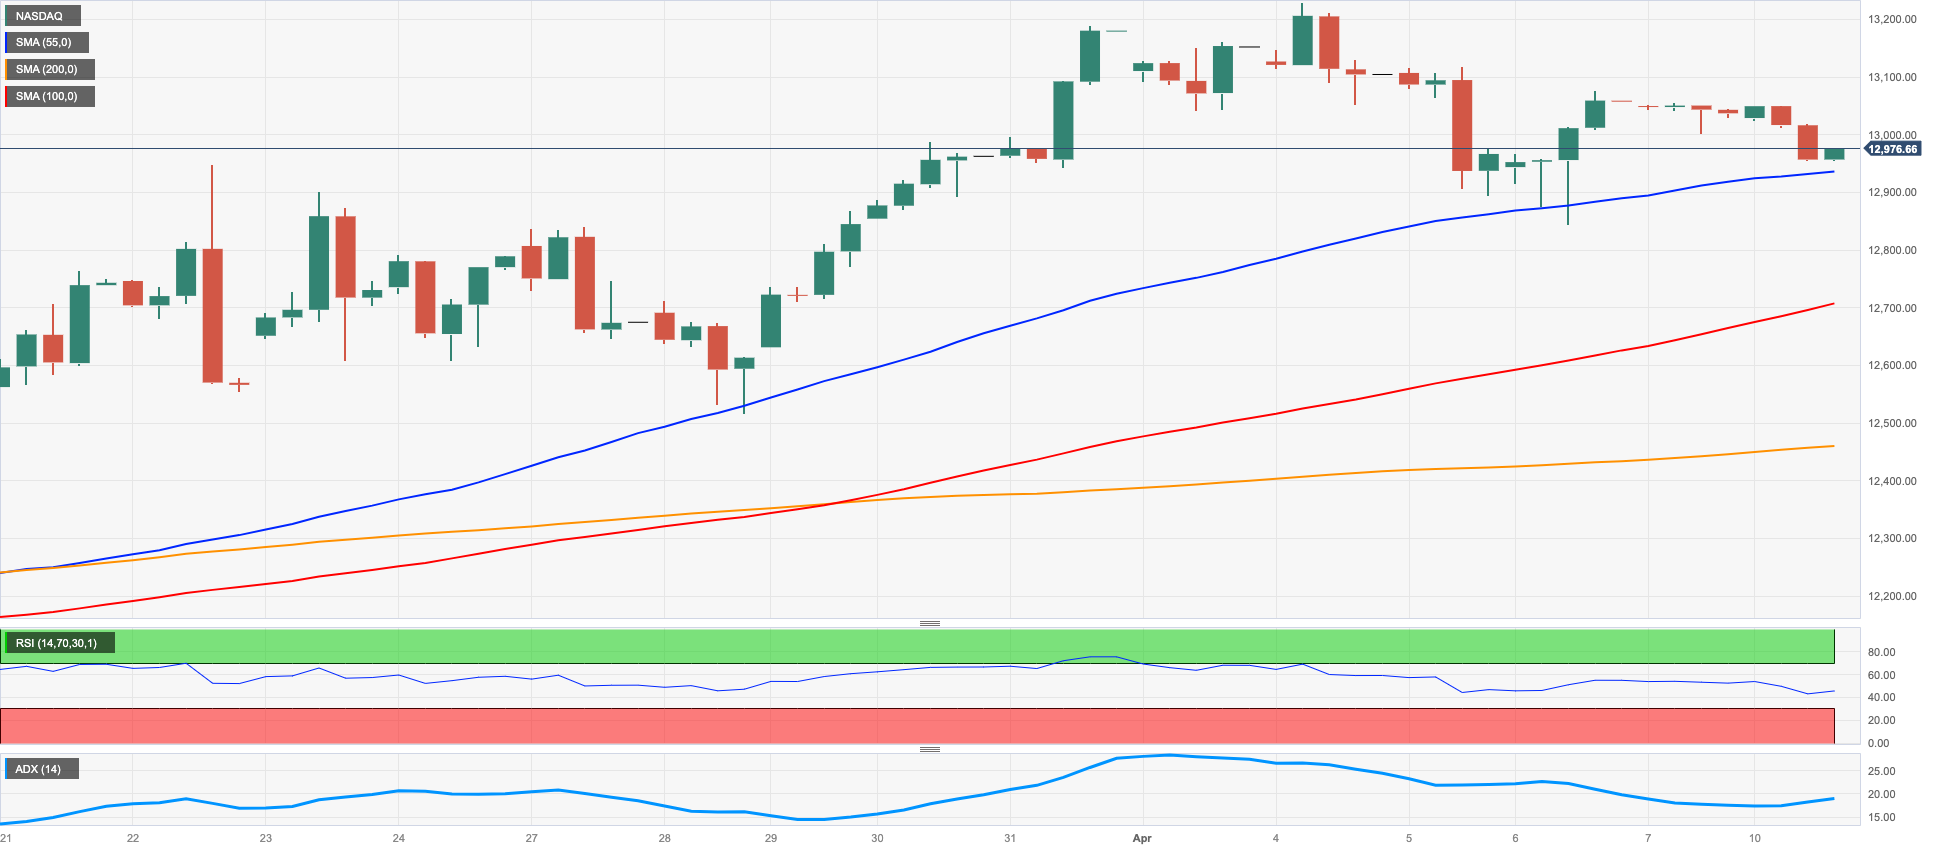
The tech benchmark Nasdaq 100 started the week in a bearish tone and partially faded Thursday’s strong advance on Monday.
Indeed, tech stocks suffered the strong rebound in the greenback and gave away part of recent gains in tandem with rising concerns over the likelihood of further tightening by the Fed.
The mixed performance of the US yields seems to have also added to the downward bias in the sector.
The resumption of the upside momentum in the Nasdaq 100 is expected to meet the next barrier at the 2023 top at 13204 (April 4) ahead of the August 2022 peak at 13720 (August 16) and the round level at 14000. Beyond this level appears the March 2022 peak at 15265 (March 29). Having said that, there is a decent support at the weekly low at 12517 (March 28) just before the interim 55-day SMA at 12393 and seconded by the key 200-day SMA at 11970. Once the index breaches the latter, it could open the door to a drop to the March low at 11695 (March 13) prior to weekly lows at 11550 (January 25) and 11251 (January 19), all ahead of the 2023 low at 10696 (January 6). The daily RSI eased to the 61 area.
Top Gainers: Micron, AMD, Dollar Tree
Top Losers: JD.com Inc Adr, Biogen, Apple
Resistance levels: 13204 13720 14277 (4H chart)
Support levels: 12846 12517 11947 (4H chart)
DOW JONES
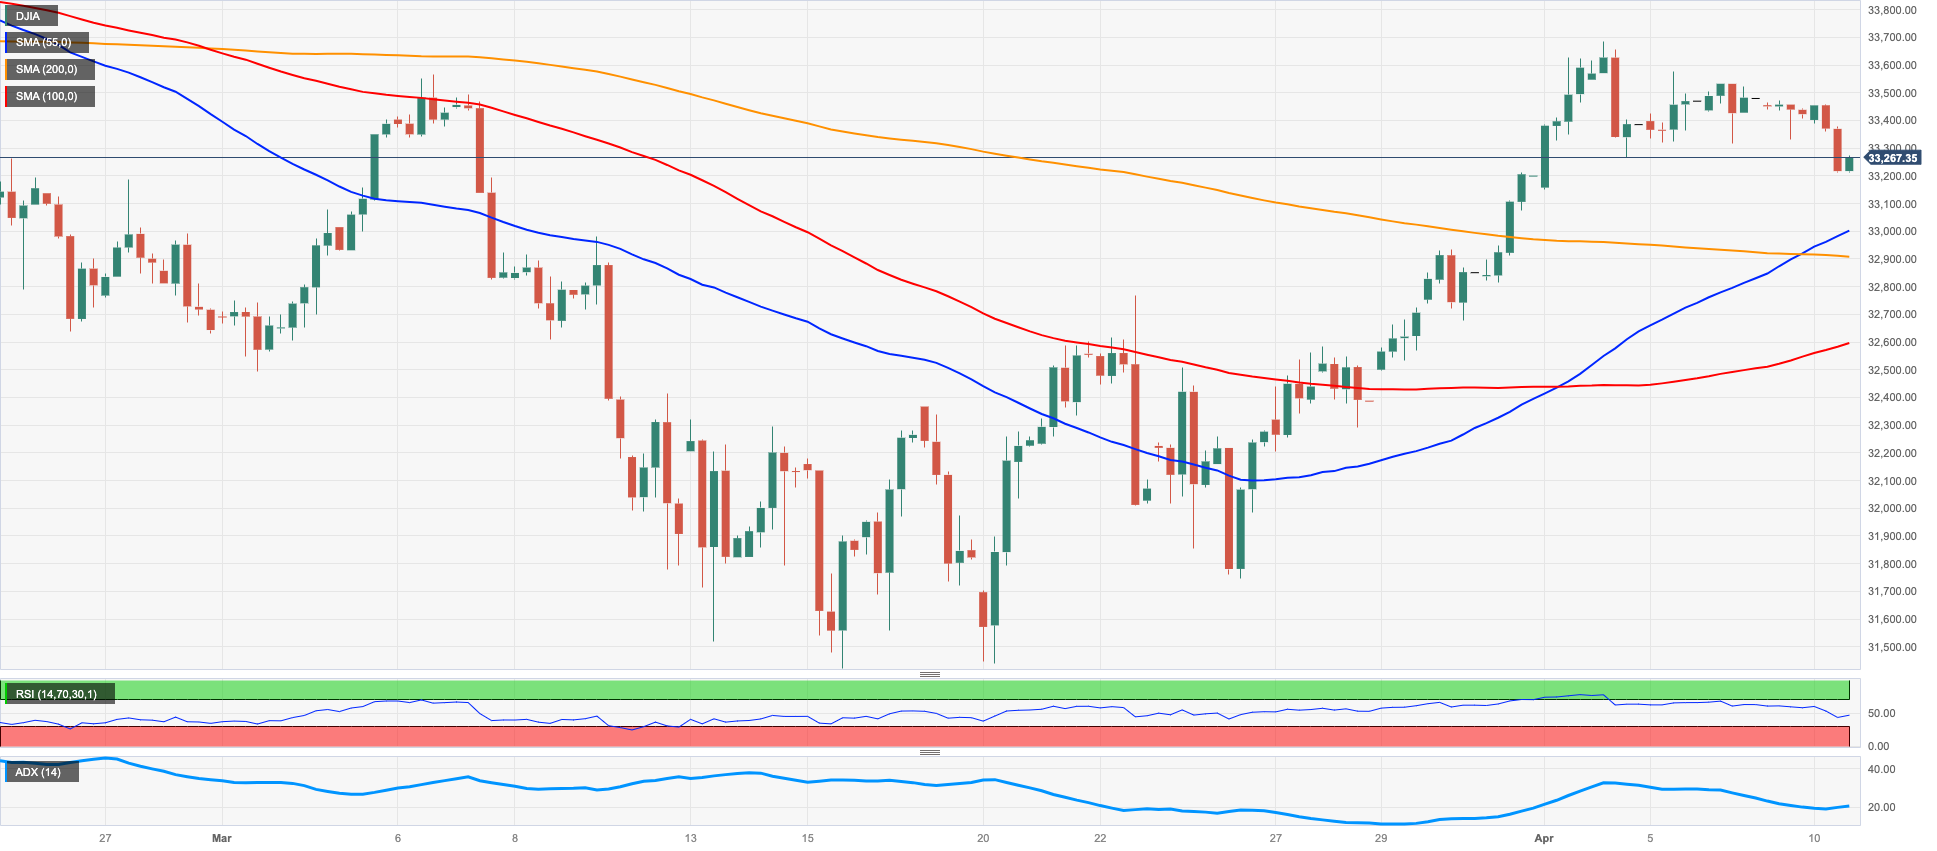
US equities started the week in a mixed tone, as traders slowly returned to their desks following the Easter holidays.
In fact, recession concerns resurfaced once again and weighed on investors’ sentiment after the strong readings from the US jobs report on Friday (+236K) sparked speculation that the Fed might not make an impasse in its tightening stance in May, as was expected just a week ago.
According to CME Group’s FedWatch Tool, the probability of a 25 bps rate raise on May 3 is now at around 70%.
All in all, the Dow Jones rose 0.15% to 33534, the S&P500 retreated 0.16% to 4098 and the tech-heavy Nasdaq Composite dropped 0.38% to 12042.
If the Dow Jones breaks above the April top at 33634 (April 4) it could then challenge the 2023 peak at 34342 (January 13) prior to the December 2022 high at 34712 (December 13). North from here appears the April 2022 top at 35492 (April 21) before the February 2022 peak at 35824 (February 9). Contrarily, the 55-day SMA at 33166 is expected to offer initial contention ahead of the key 200-day SMA at 32469 and the 2023 low at 31429 (March 15). The breakdown of the latter should shift the attention to the 30000 yardstick prior to the 2022 low at 28660 (October 13). The daily RSI advanced marginally to the vicinity of 61.
Top Performers: Caterpillar, Dow, American Express
Worst Performers: Apple, Procter&Gamble, Microsoft
Resistance levels: 33634 34334 34712 (4H chart)
Support levels: 32639 31805 31429 (4H chart)
MACROECONOMIC EVENTS

All Information & Updates provided by:

All information relating to the financial markets available on this page has been prepared and issued by FXStreet (Forexstreet SL, Spain, Reg: B62498233) on the basis of publicly available information and all information believed to be reliable and does not conflict with Kuwaiti local laws, and all necessary care has been taken to before the company to ensure that the facts mentioned are correct from the source.
NCM Investment nor any of its directors or employees shall in any way be held responsible for the contents of this news, and the information contained on this page is intended only to provide clients with publicly available information and should not be construed as investment advice, report or analysis and/or constitute an offer or invitation to buy or sell financial instruments of any kind.
RISK WARNING: Forex and CFDs are highly risky leveraged products, as losses can exceed deposits. Please ensure you understand all the risks and take independent advice if necessary. NCM will segregate the clients based on the criteria of the regulator and its bylaws. NCM does not provide any advisory service; the material published does not constitute advice or a recommendation for a transaction in any financial instrument. NCM accepts no responsibility for any use of the content presented and any consequences of that use. Anyone acting on the information provided does so at their own risk.