
- Contact Us:
-

-

-

-


Daily Market Updates
12 Apr 2023
USDJPY
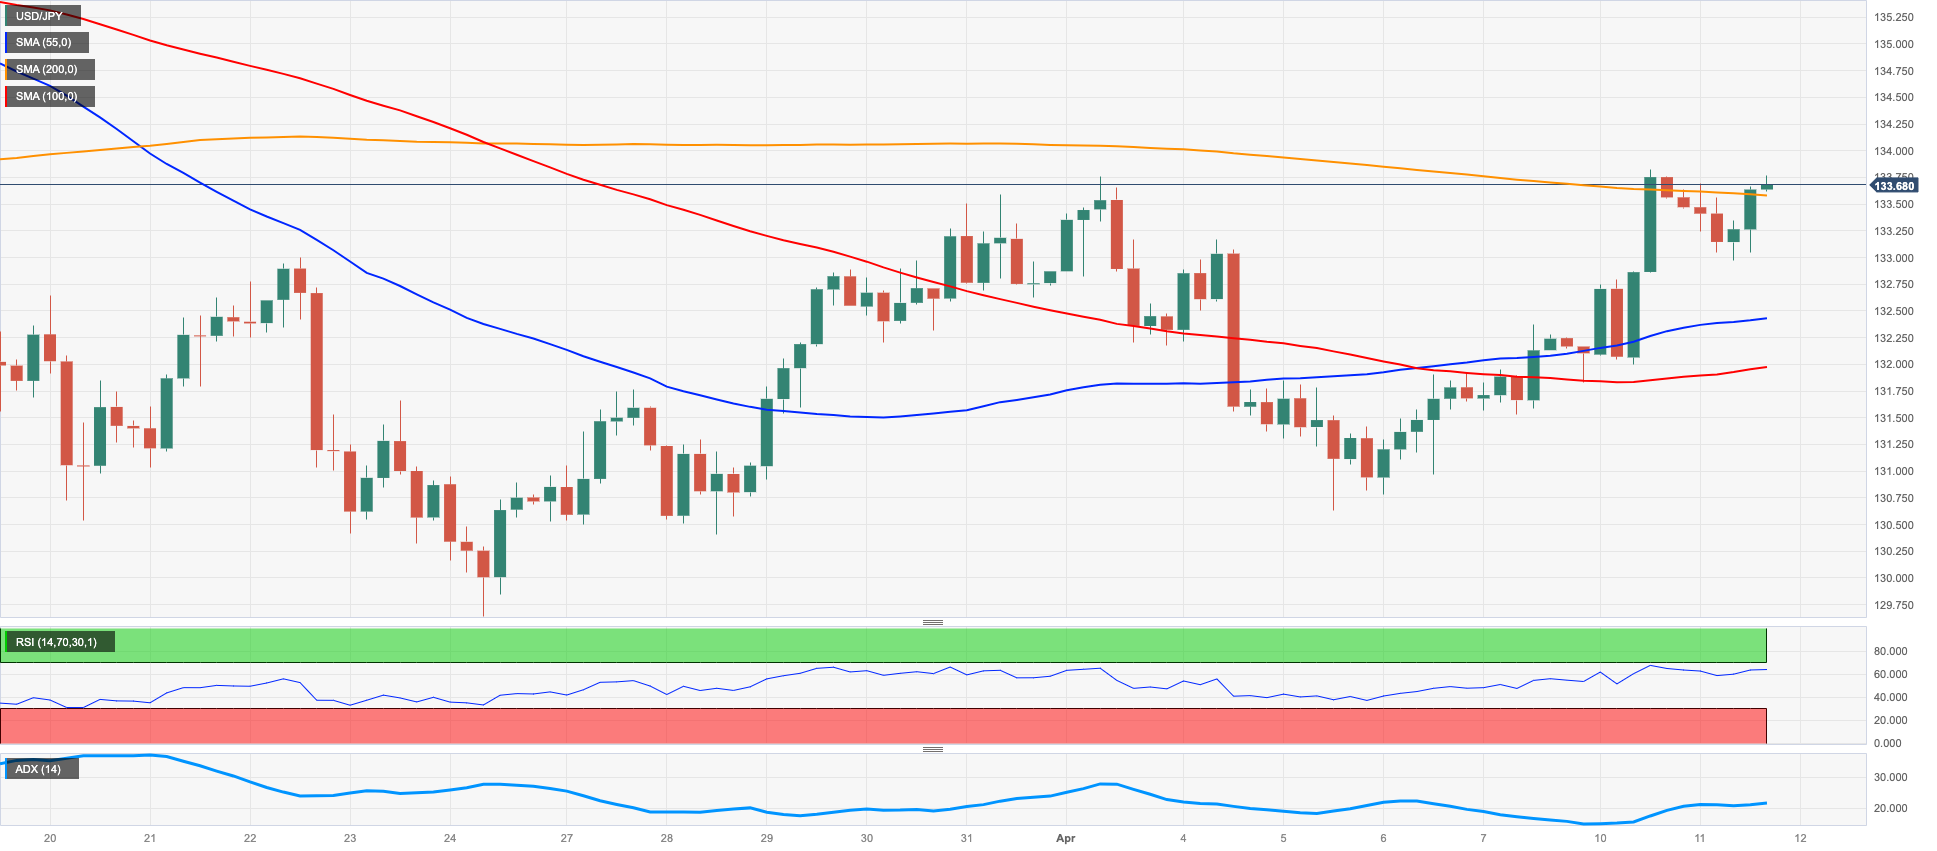
USD/JPY retested the area of 4-week highs in the 133.70/80 band on Tuesday, although it failed to surpass it in a convincing fashion.
The pair’s fourth consecutive daily gain found further oxygen in the positive performance of US yields across the curve, although the strong retracement in the greenback limited the upside.
In the Japanese calendar, Machine Tool Orders contracted at an annualized 15.2% in March, extending the contraction already seen in the previous month.
Immediately to the upside in USD/JPY emerges the April top at 133.87 (April 10) prior to the key 200-day SMA at 137.18 and the 2023 peak at 137.91 (March 8). The breakout of the latter could encourage spot to revisit highs at 139.89 (November 30 2022) and 142.25 (November 21 2022). On the flip side, the March low at 129.63 (March 24) should hold the initial test prior to the February low at 128.08 (February 2) and before the 2023 low at 127.21 (January 16). The daily RSI appeared stable around 55.
Resistance levels: 133.87 135.11 136.99 (4H chart)
Support levels: 132.97 131.52 130.62 130.40 (4H chart)
GBPUSD
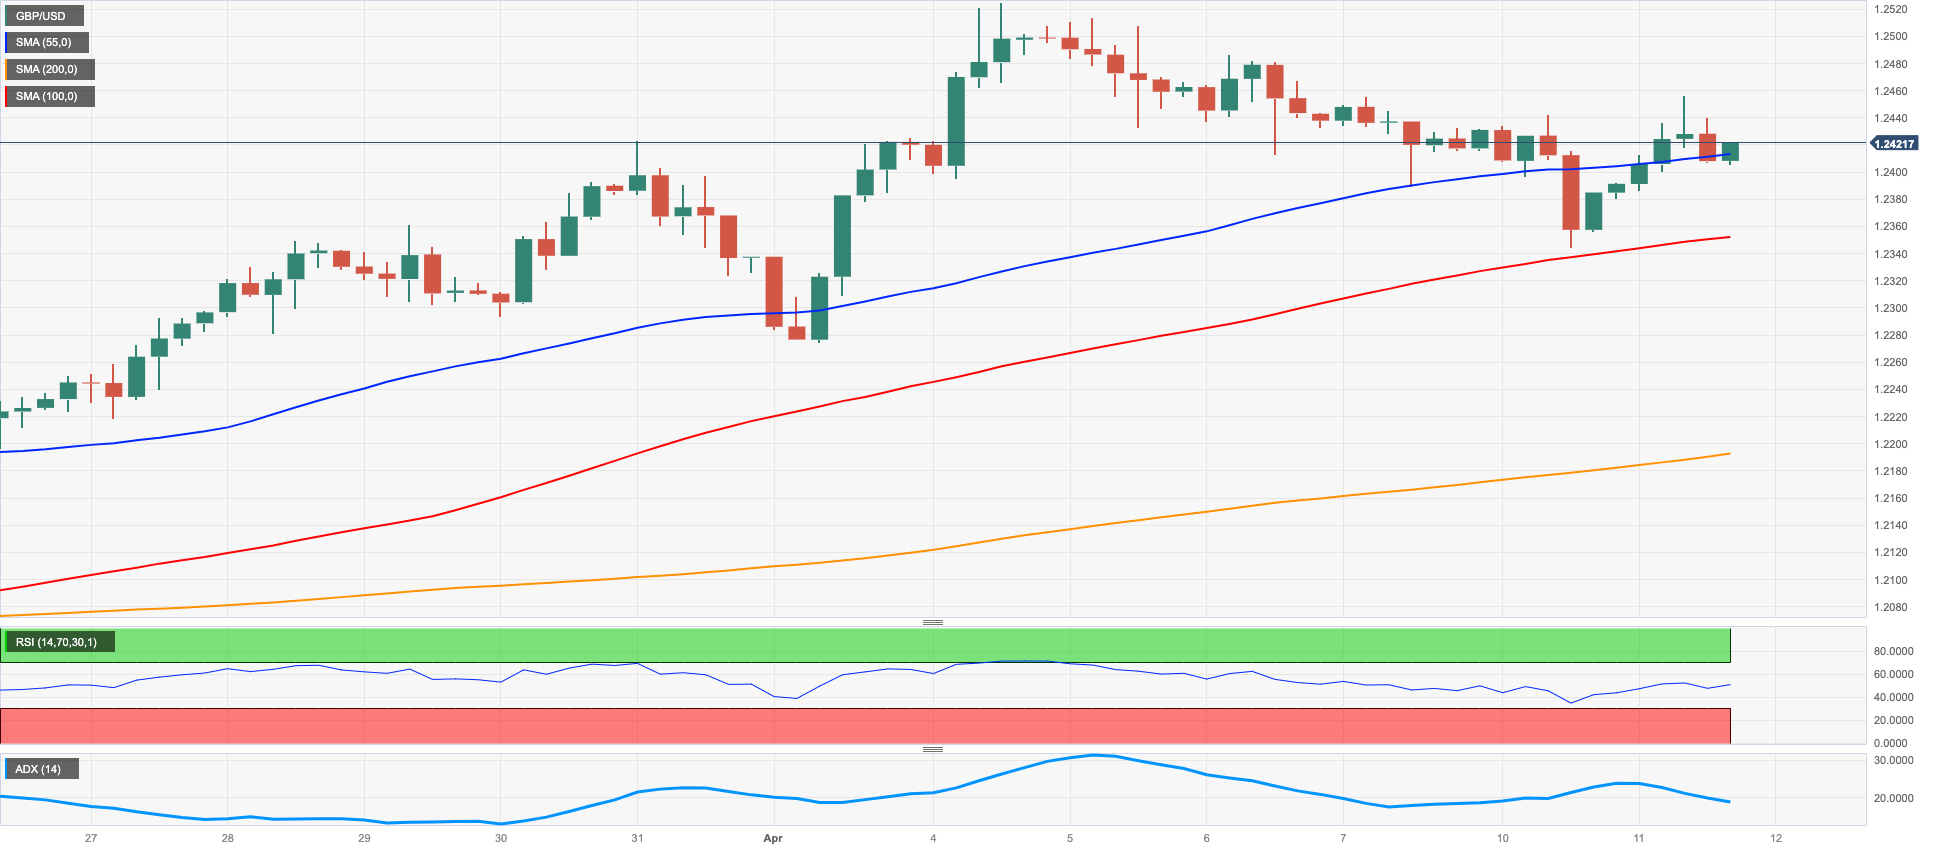
GBP/USD gathered renewed upside traction and trespassed the 1.2400 hurdle to print 2-day highs on Tuesday.
The marked move higher in Cable came in tandem with the marked decline in the greenback, which prompted the USD Index (DXY) to abandon the area of recent tops and correct sharply lower to the 102.00 region, where some support seems to have resurfaced.
In the UK, the BRC Retail Sales Monitor expanded 4.9% in the year to March and the BBA Mortgage Rate rose to 7.22% in the same month.
If the recovery in GBP/USD picks up extra pace, then the next target of note should emerge at the 2023 peak at 1.2525 (April 4) ahead of the May 2022 high at 1.2666 (May 27). The surpass of the latter could pave the way for a test of the 200-week SMA at 1.2867 before the psychological 1.3000 mark. In opposition, the April low at 1.2274 (April 3) aligns as the immediate support ahead of temporary contention at the 55- and 100-day SMAs at 1.2176 and 1.2167, respectively. South from here comes the weekly low at 1.2010 (March 15) seconded by the key 200-day SMA at 1.1903 and the 2023 low at 1.1802 (March 8). The daily RSI bounced slightly and trespassed the 59 region.
Resistance levels: 1.2456 1.2525 1.2599 (4H chart)
Support levels: 1.2344 1.2274 1.2184 (4H chart)
AUDUSD
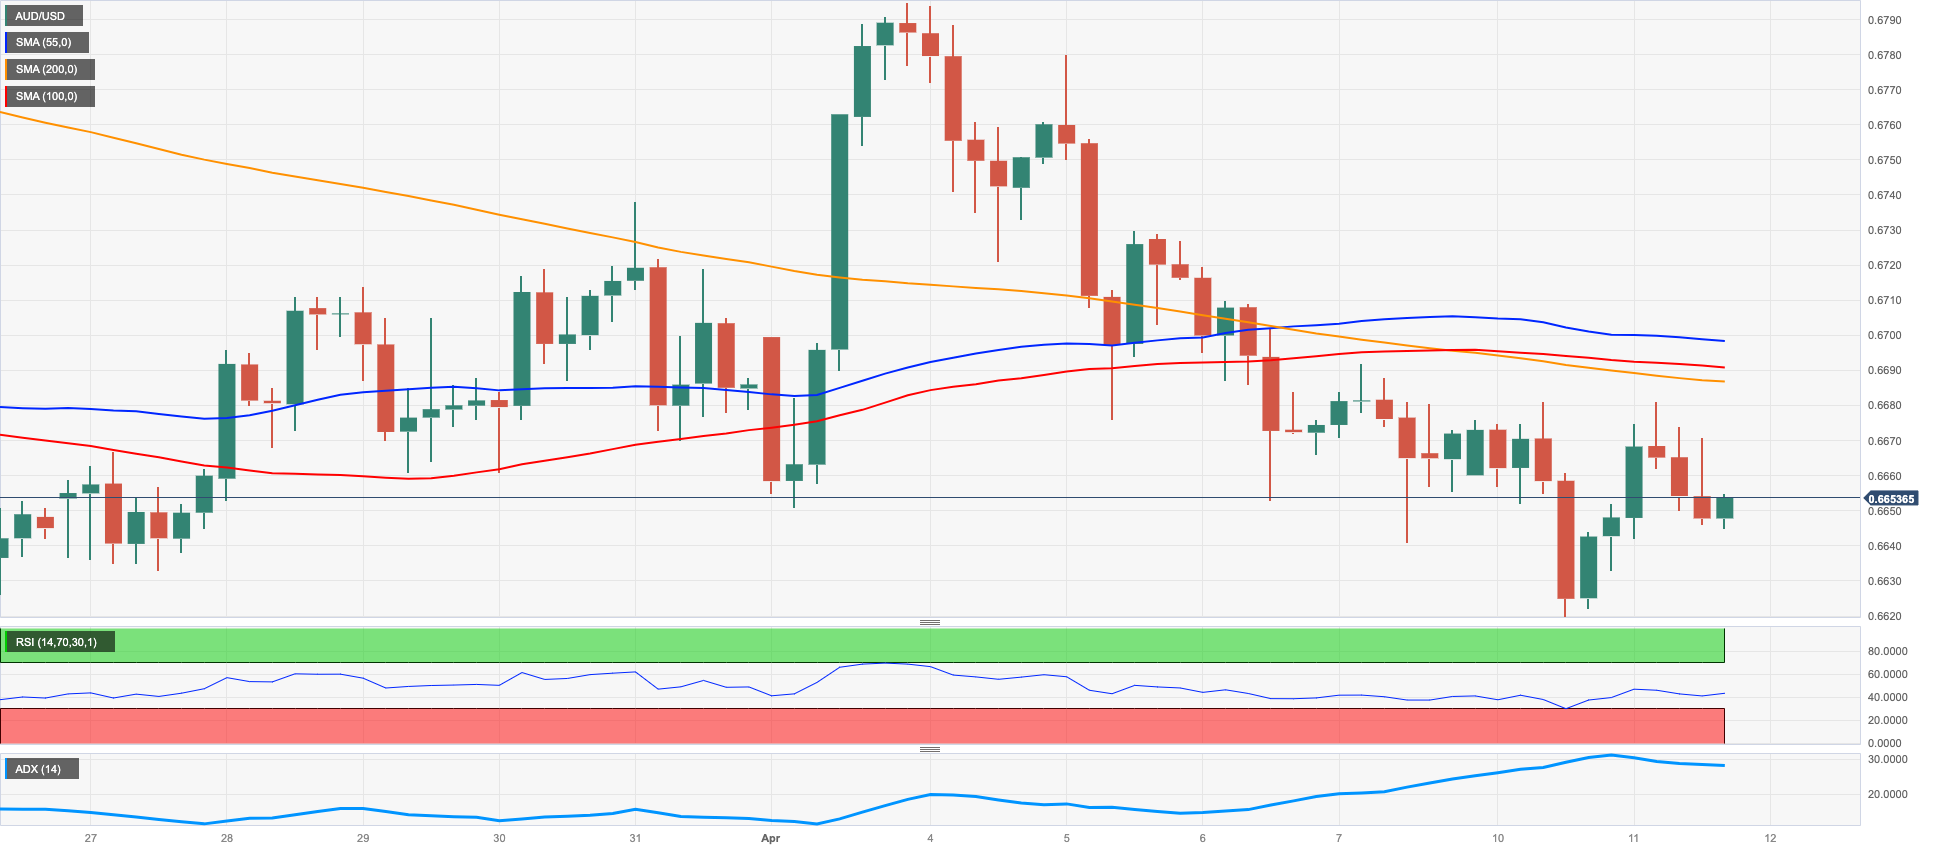
AUD/USD could not sustain the initial bull run to the 0.6680 region, deflating somewhat afterwards although eventually ending Tuesday’s session with humble gains.
The daily uptick in the pair, albeit small, was enough to reverse five consecutive sessions with losses, all following the rejection from April’s tops just below 0.6800 the figure recorded in the wake of the last RBA meeting on April 4.
The better tone in copper prices and the iron ore also added to the renewed optimism around the Aussie dollar.
Down Under, the Consumer Confidence Index tracked by Westpac ticked higher to 85.8 in April, while NAB’s Business Confidence improved to -1 in March.
The April low at 0.6619 (April 10) emerges as the initial support for AUD/USD in case sellers keep pushing harder. Down from here lines up the 2023 low at 0.6563 (March 10) prior to the weekly low at 0.6386 (November 10 2022) and followed by the November 2022 low at 0.6272 (November 3). Just the opposite, the key 200-day SMA at 0.6743 comes first prior to the April top at 0.6793 (April 4), a region also coincident with the temporary 100- and 55-day SMAs. North from here aligns the key round level at 0.7000 just ahead of the weekly peak at 0.7029 (February 14). The daily RSI rose slightly past the 44 yardstick.
Resistance levels: 0.6689 0.6779 0.6793 (4H chart)
Support levels: 0.6619 0.6589 0.6563 (4H chart)
GOLD
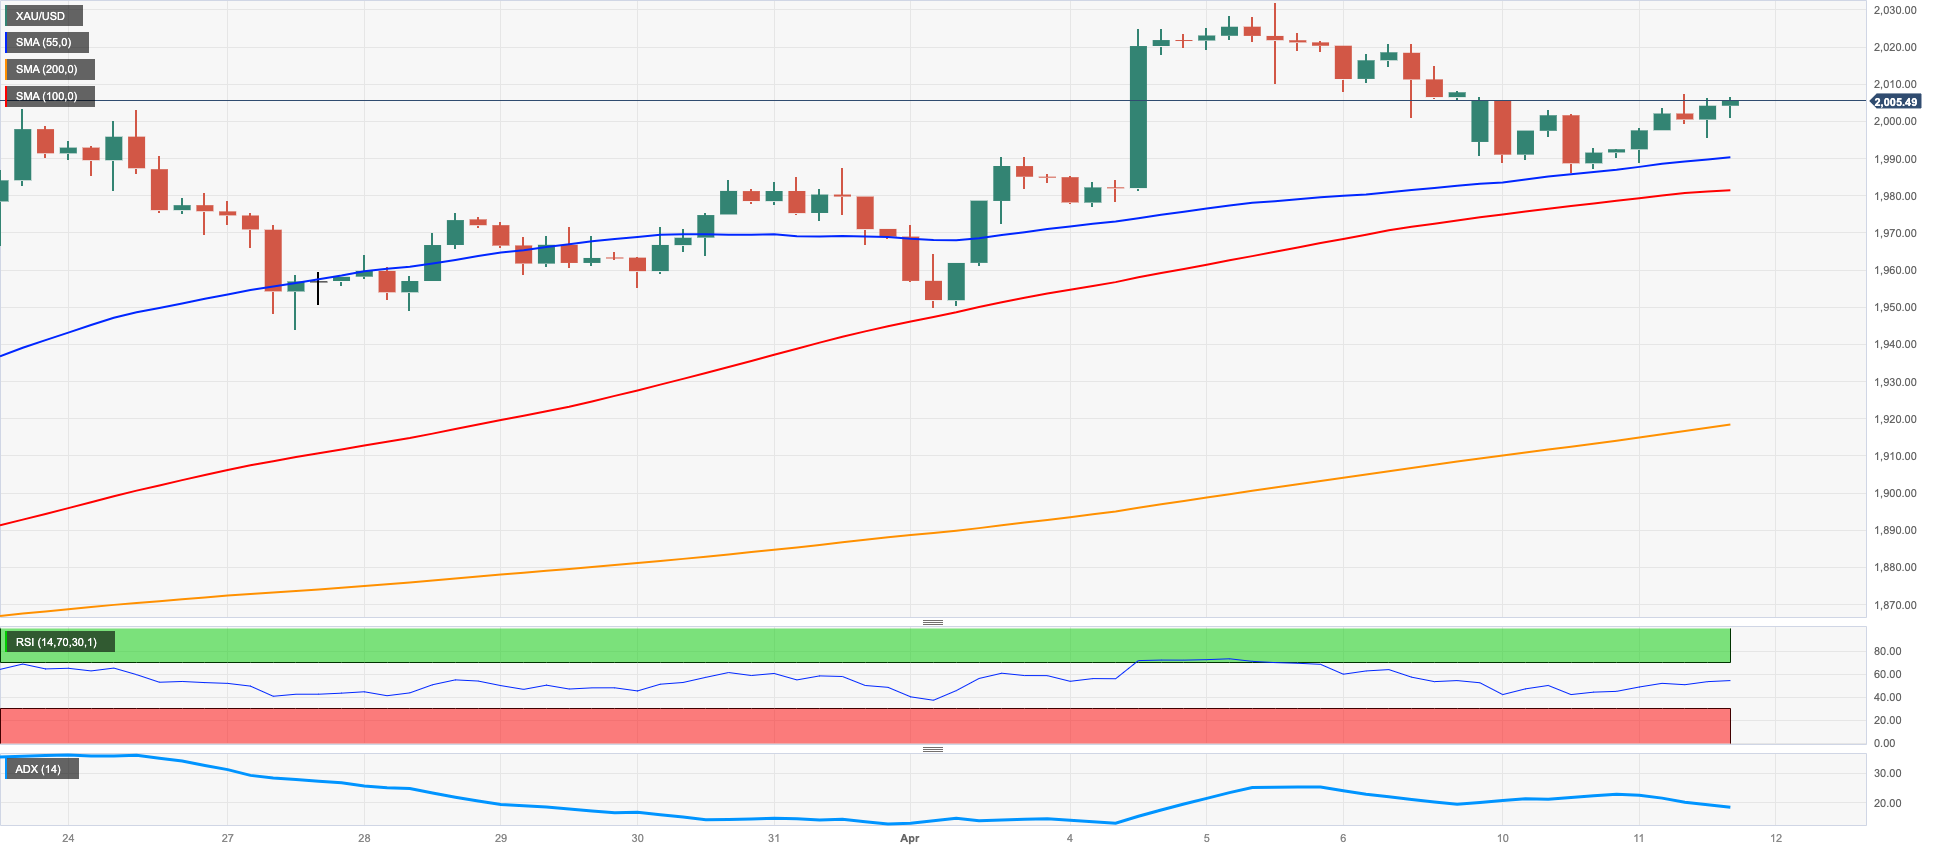
Prices of the ounce troy of gold reversed two sessions in a row with losses and reclaimed the area beyond the key $2000 mark on turnaround Tuesday.
The marked bounce in the precious metal came exclusively in response to the corrective pullback in the greenback, while the move higher in US yields across the curve seems to have limited the daily upside.
Next of note around the yellow metal emerges the publication of US inflation figures gauged by the CPI on April 12, which could be critical in determining the Fed’s move (or lack of it) on rates at the May gathering.
Bulls continue to target the 2023 high at $2032 (April 5) ahead of the 2022 top at $2070 (March 8) and the all-time peak at $2075 (August 7 2020). On the contrary, there is an initial support at the April low at $1949 (April 3) seconded by the weekly low at $1934 (March 22) and ahead of interim contention levels at the 55- and 100-day SMAs at $1904 and $1865, respectively. The breach of this region could open the door to a potential visit to the March low at $1809 (March 8) before the 2023 low at $1804 (February 28) and the key 200-day SMA at $1789.
Resistance levels: $2032 $2070 $2075 (4H chart)
Support levels: $1981 $1949 $1934 (4H chart)
CRUDE WTI
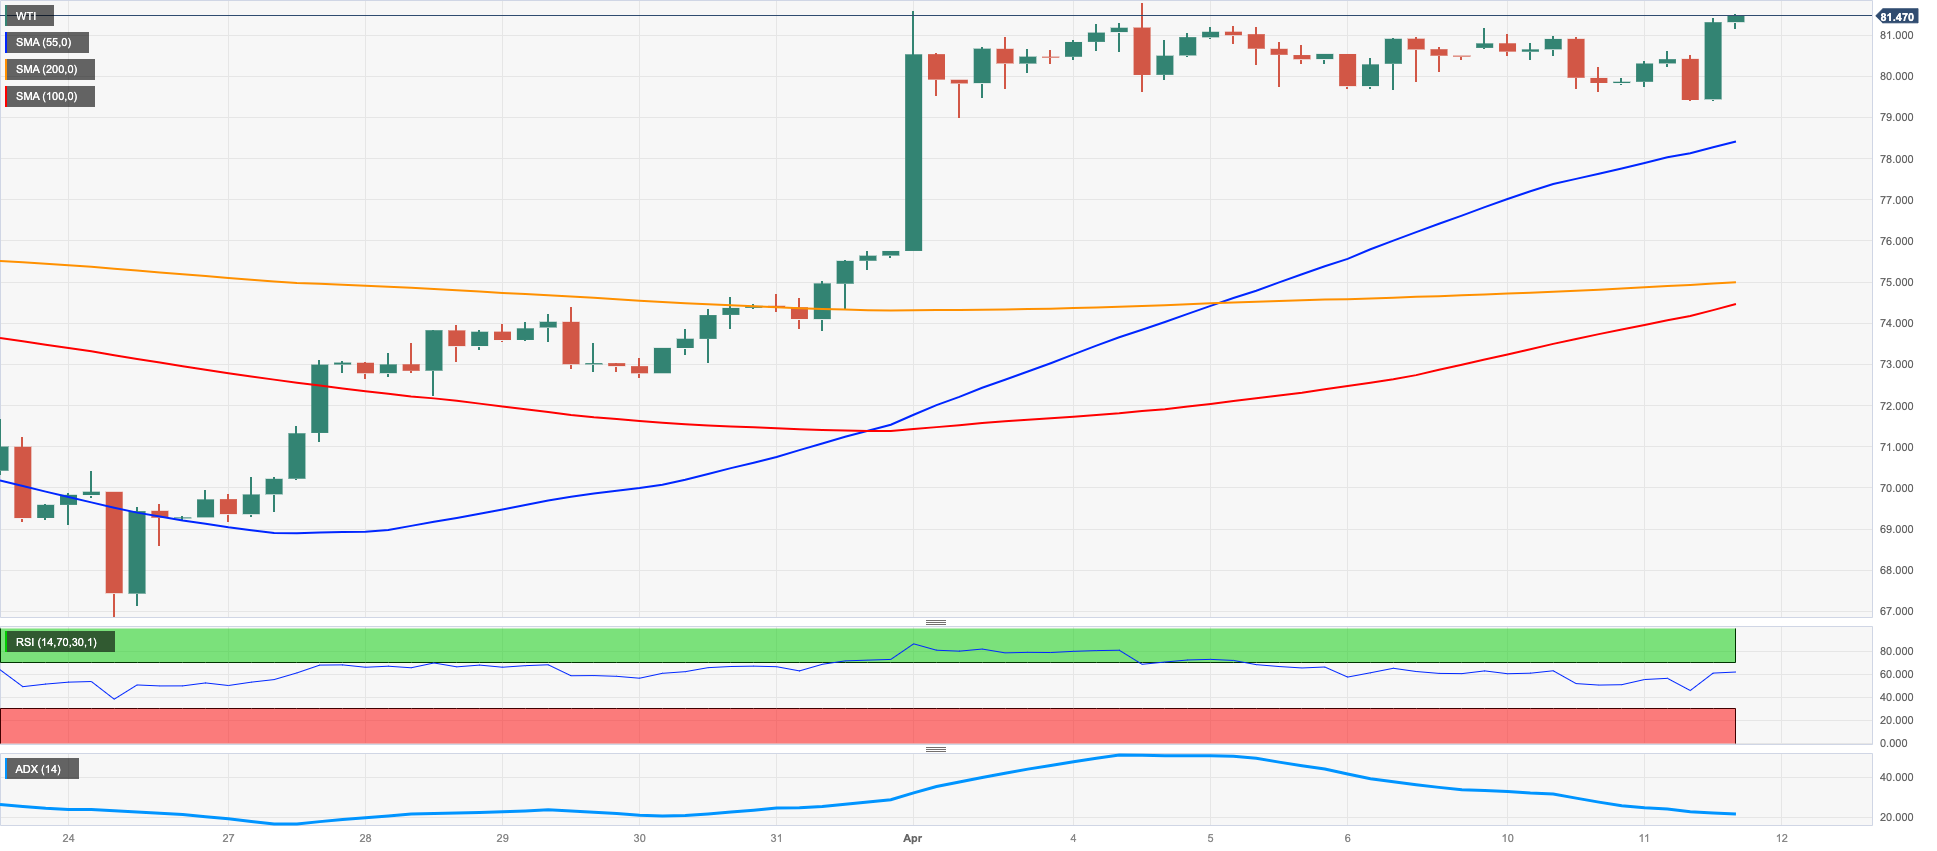
WTI prices regained the $81.00 mark per barrel and above, printing at the same time new 4-day highs on Tuesday.
Increasing weakness in the greenback sponsored the moderated climb in prices of the commodity, while speculation of further disinflation in the US and the probability that the Fed could refrain from acting on rates in May also seems to have bolstered the daily advance in prices of the crude oil.
Further legs to Tuesday’s uptick came after lower-than-expected inflation figures in China (published early in the Asian trading hours) could spark a round of fresh stimulus by the PBoC.
Later in the NA session, the API will report on US crude oil supplies in the week to April 7 ahead of Wednesday’s EIA report, while the OPEC and the IEA will release their monthly reports on Thursday and Friday, respectively.
Next on the upside for the WTI comes the April high at $81.75 (April 4) ahead of the 2023 top at $82.60 (January 23) and the December 2022 peak at $83.32 (December 1). If the commodity breaks above this level it could then confront the November 2022 high at $93.73 (November 7). On the opposite side, the initial support remains at the April low at $79.05 (April 3) followed by the provisional 100- and 55-day SMAs at $76.69 and $76.04, respectively, prior to the $66.86 level (March 24). South from here appears the 2023 low at $64.41 (March 20) ahead of the December 2021 low at $62.46 (December 2).
Resistance levels: $81.75 $82.60 $83.32 (4H chart)
Support levels: $78.97 $74.85 $72.57 (4H chart)
GER40
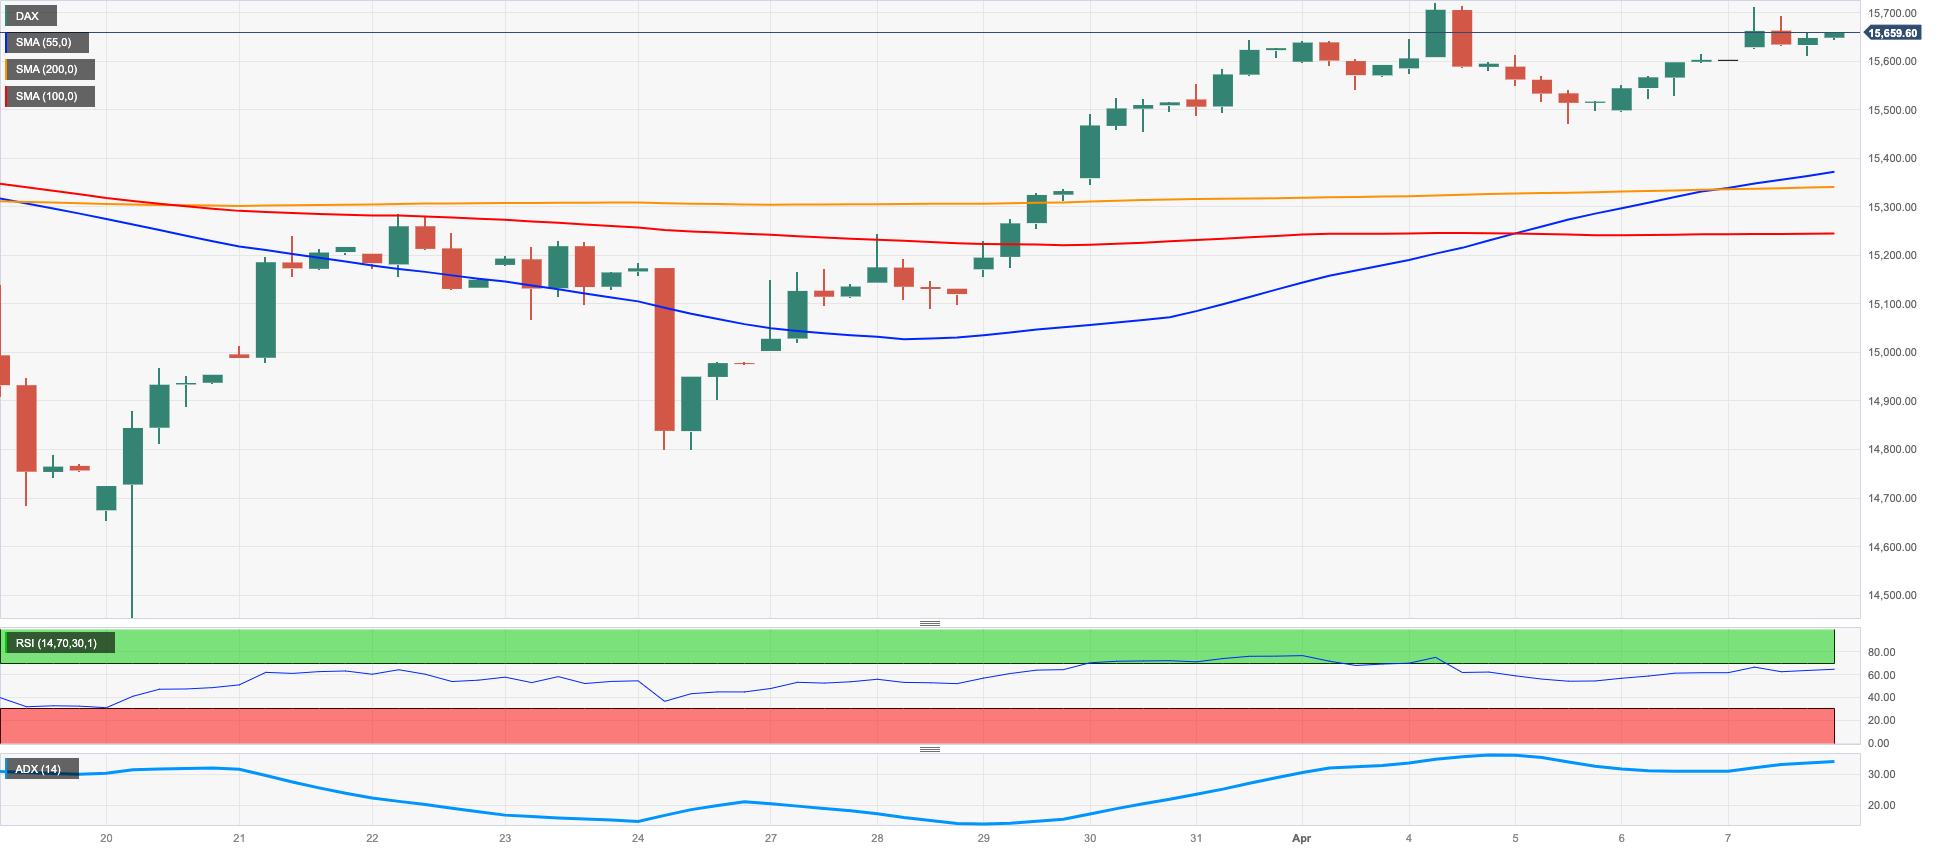
Equities gauged by the German reference DAX40 added to Thursday’s advance and traded at shouting distance from the YTD high (around the 15700 region) on Tuesday.
The generalized appetite for the risk complex was underpinned by lower-than-estimated inflation figures in China, which in turn sparked speculation that the PBoC might introduce extra stimulus to boost the economy in the near term.
In addition, investors’ expectations of a soft print from US CPI on Wednesday seemed to prop up the idea that the Fed might pause its hiking cycle as soon as at the May event, all morphing into extra inflows into the risk-associated universe.
In the German money market, the 10-year Bund yields leapt past the 2.30%, or 4-day highs, in line with their American peers.
The DAX40 faces the next up-barrier at the April top at 15736 (April 4) ahead of the round level at 16000 and the 2022 peak at 16285 (January 5). Contrarily, the immediate support comes at the April low at 15482 (April 5) seconded by temporary contention levels at the 55- and 100-day SMAs at 15325 and 14922, respectively. Further down emerges the minor support at 14809 (March 24) prior to the March low at 14458 (March 20) and the key 200-day SMA at 13995. The daily RSI advanced north of the 59 level.
Best Performers: Heidelbergcement, Vonovia, BMW ST
Worst Performers: Merck, Henkel VZO, Deutsche Telekom
Resistance levels: 15736 15912 16090 (4H chart)
Support levels: 15482 15254 14809 (4H chart)
NASDAQ
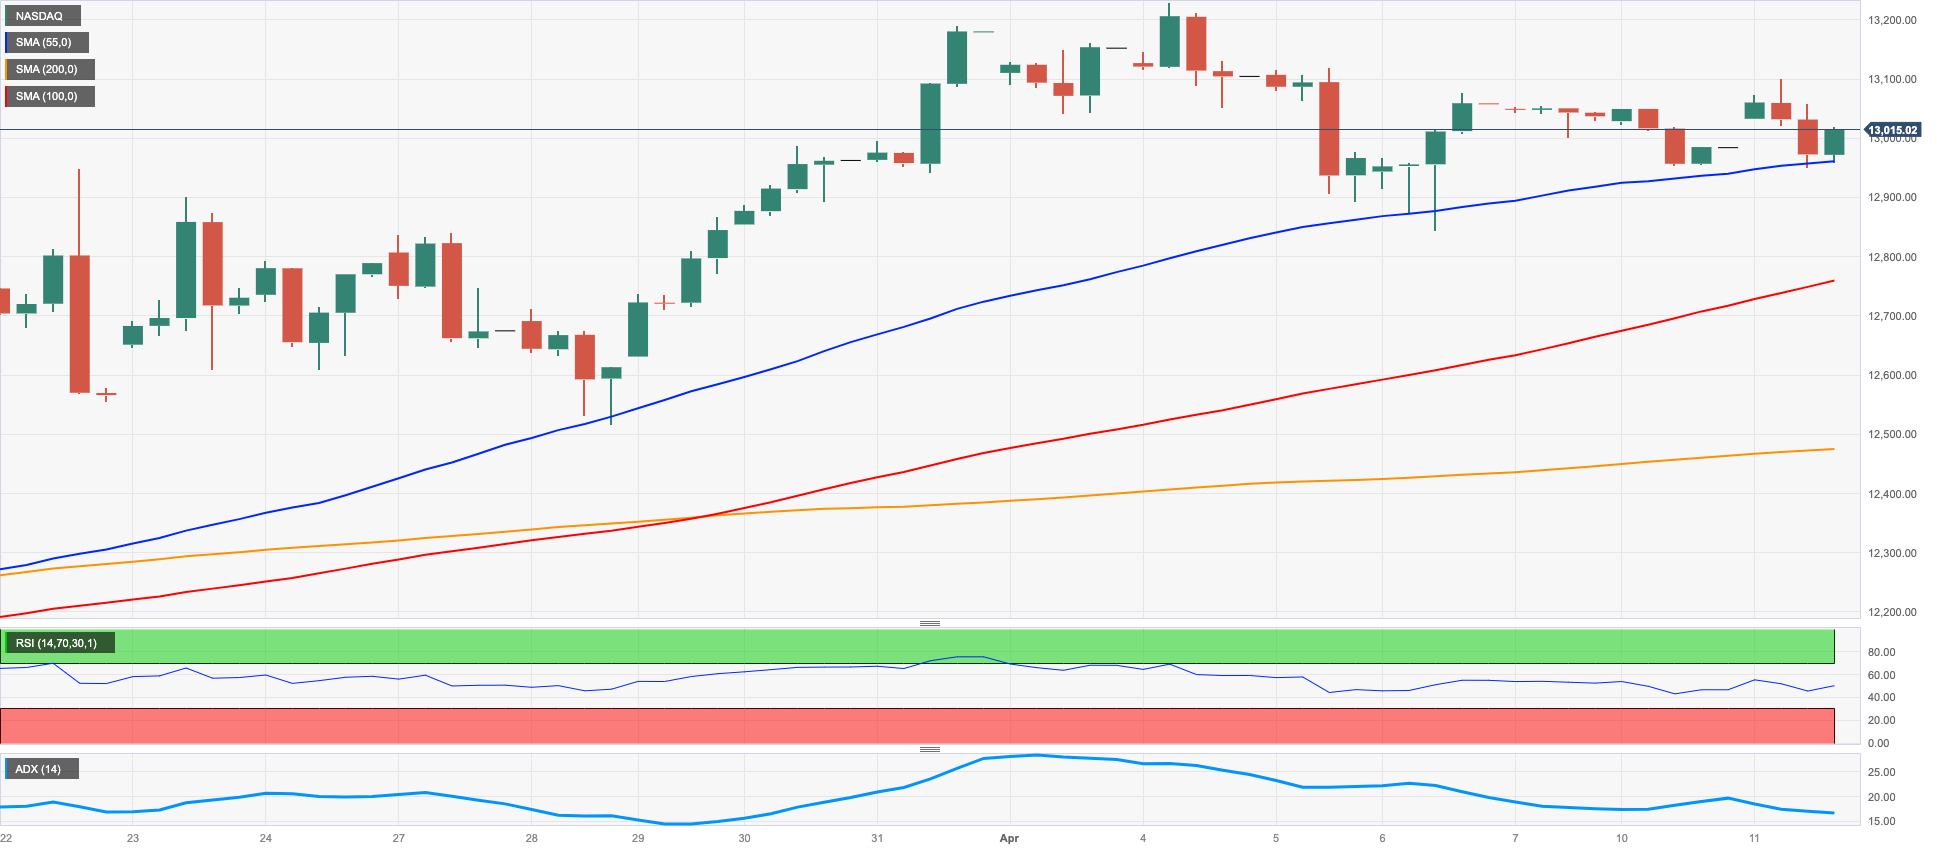
Further selling interest sparked the second daily drop in a row in the Nasdaq 100, this time breaking below the key 13000 yardstick on Tuesday.
In fact, the tech sector extended the pessimism seen at the beginning of the week and lost further ground in response to the firmer tone in US yields across the curve and despite the marked drop in the greenback, while cautiousness remained well in place ahead of the release of US inflation figures on Wednesday.
Further weakness could see the April low at 12846 (April 6) revisited ahead of the weekly low at 12517 (March 28) and the temporary 55-day SMA at 12418. The loss of this level exposes a probable test of the key 200-day SMA at 11977 ahead of the March low at 11695 (March 13) and followed by weekly lows at 11550 (January 25) and 11251 (January 19), all prior to the 2023 low at 10696 (January 6). On the other hand, the big magnet for bulls remains at the 2023 peak at 13204 (April 4) seconded by the August 2022 high at 13720 (August 16) and the round level at 14000. The breakout of this barrier could prompt the March 2022 high at 15265 (March 29) to emerge on the horizon. The daily RSI dropped further and approached the 60 mark.
Top Gainers: Lucid Group, PACCAR, MercadoLibre
Top Losers: Datadog, Moderna, Amazon.com
Resistance levels: 13204 13720 14277 (4H chart)
Support levels: 12846 12517 11959 (4H chart)
DOW JONES
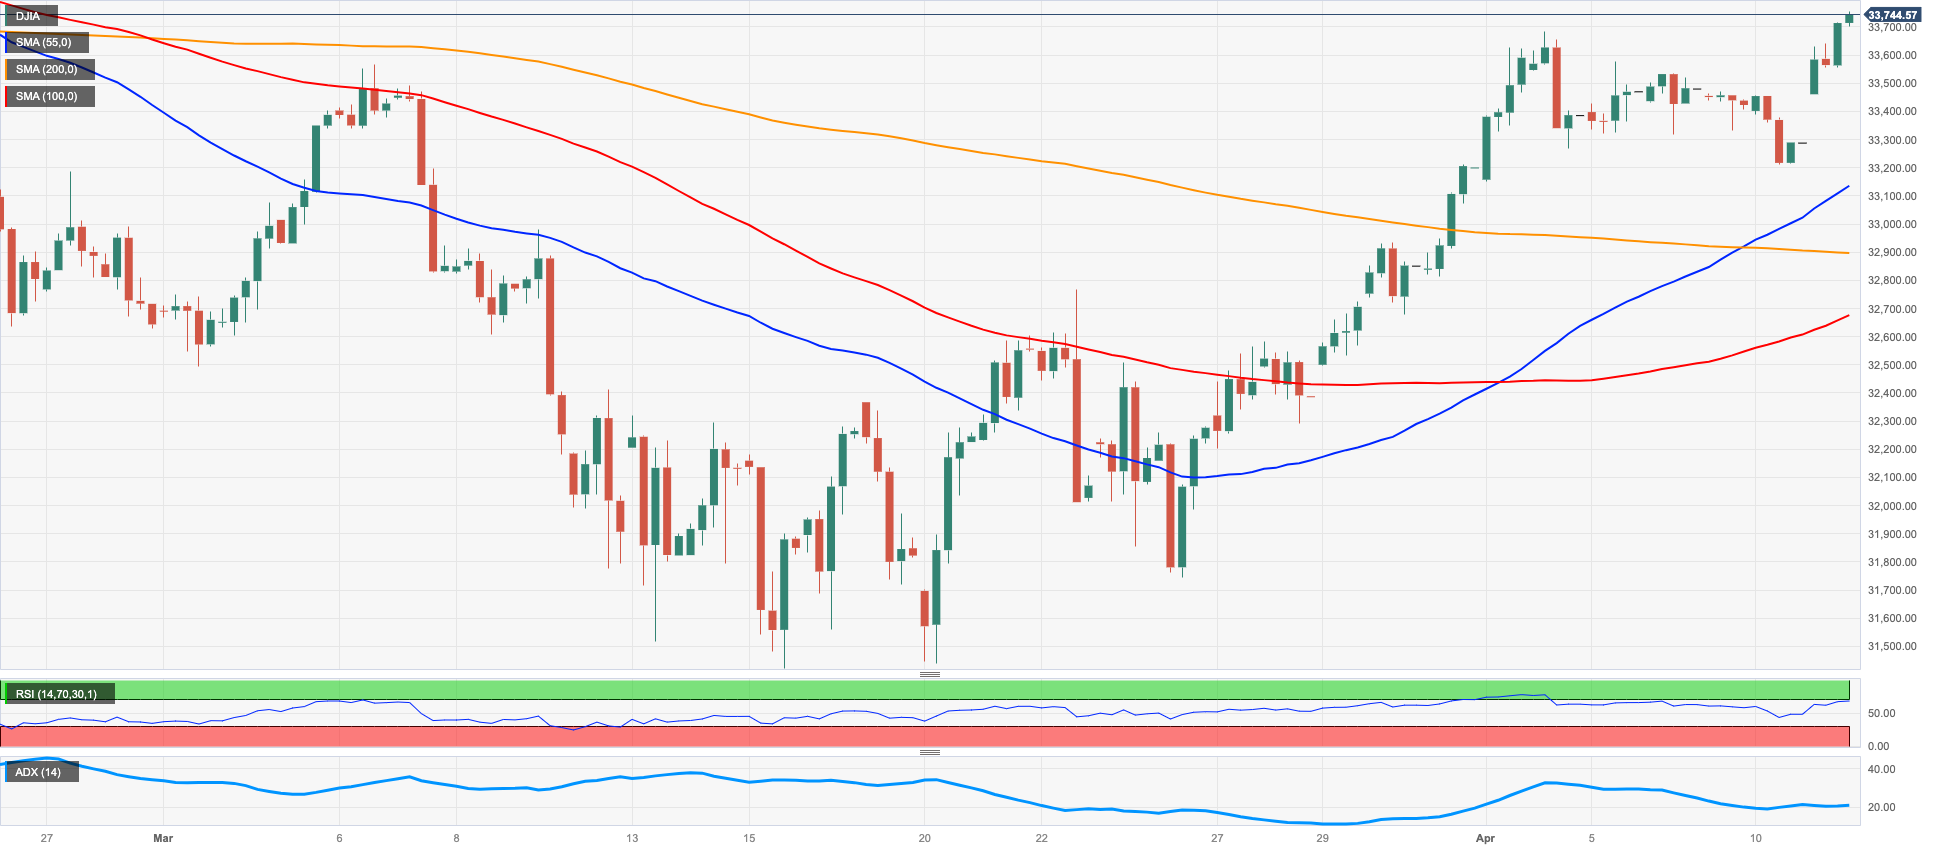
Stocks measured by the Dow Jones extended the uptrend for the fourth straight session on Tuesday, this time advancing to the vicinity of the 33800 zone, or fresh 2-month highs.
In fact, investors kept the upbeat mood on turnaround Tuesday ahead of the release of US inflation figures on April 12, as another low print of the CPI could put the Federal Reserve en route to keep the interest rate unchanged at the May gathering.
Other than the US CPI, investors will closely follow the publication of the FOMC Minutes of the April event, also on April 12 ahead of Producer Prices (April 13) and Retail Sales (April 14).
On the whole, the Dow Jones gained 0.46% to 33741, the S&P500 rose 0.27% to 4120 and the tech-benchmark Nasdaq Composite retreated 0.14% to 12067.
The Dow Jones printed a new April peak at 33761 (April 11). Once the index clears this level, it could spark further upside to the 2023 high at 34342 (January 13) ahead of the December 2022 top at 34712 (December 13) and the April 2022 peak at 35492 (April 21). Further north emerges the February 2022 high at 35824 (February 9). By contrast, there is an interim contention at the 55-day SMA at 33173 seconded by the 50% Fibo retracement (of the February-March drop) at 32880 and the key 200-day SMA at 32484. The breakdown of this region could leave the index vulnerable to a deeper pullback t and the 2023 low at 31429 (March 15) ahead of the 30000 level and followed by the 2022 low at 28660 (October 13). The daily RSI climbed past the 63 level.
Top Performers: Caterpillar, 3M, Dow
Worst Performers: Microsoft, Salesforce Inc, Cisco
Resistance levels: 33761 34334 34712 (4H chart)
Support levels: 33351 31805 31429 (4H chart)
MACROECONOMIC EVENTS

All Information & Updates provided by:

All information relating to the financial markets available on this page has been prepared and issued by FXStreet (Forexstreet SL, Spain, Reg: B62498233) on the basis of publicly available information and all information believed to be reliable and does not conflict with Kuwaiti local laws, and all necessary care has been taken to before the company to ensure that the facts mentioned are correct from the source.
NCM Investment nor any of its directors or employees shall in any way be held responsible for the contents of this news, and the information contained on this page is intended only to provide clients with publicly available information and should not be construed as investment advice, report or analysis and/or constitute an offer or invitation to buy or sell financial instruments of any kind.
RISK WARNING: Forex and CFDs are highly risky leveraged products, as losses can exceed deposits. Please ensure you understand all the risks and take independent advice if necessary. NCM will segregate the clients based on the criteria of the regulator and its bylaws. NCM does not provide any advisory service; the material published does not constitute advice or a recommendation for a transaction in any financial instrument. NCM accepts no responsibility for any use of the content presented and any consequences of that use. Anyone acting on the information provided does so at their own risk.