
- Contact Us:
-

-

-

-


Daily Market Updates
13 Apr 2023
USDJPY
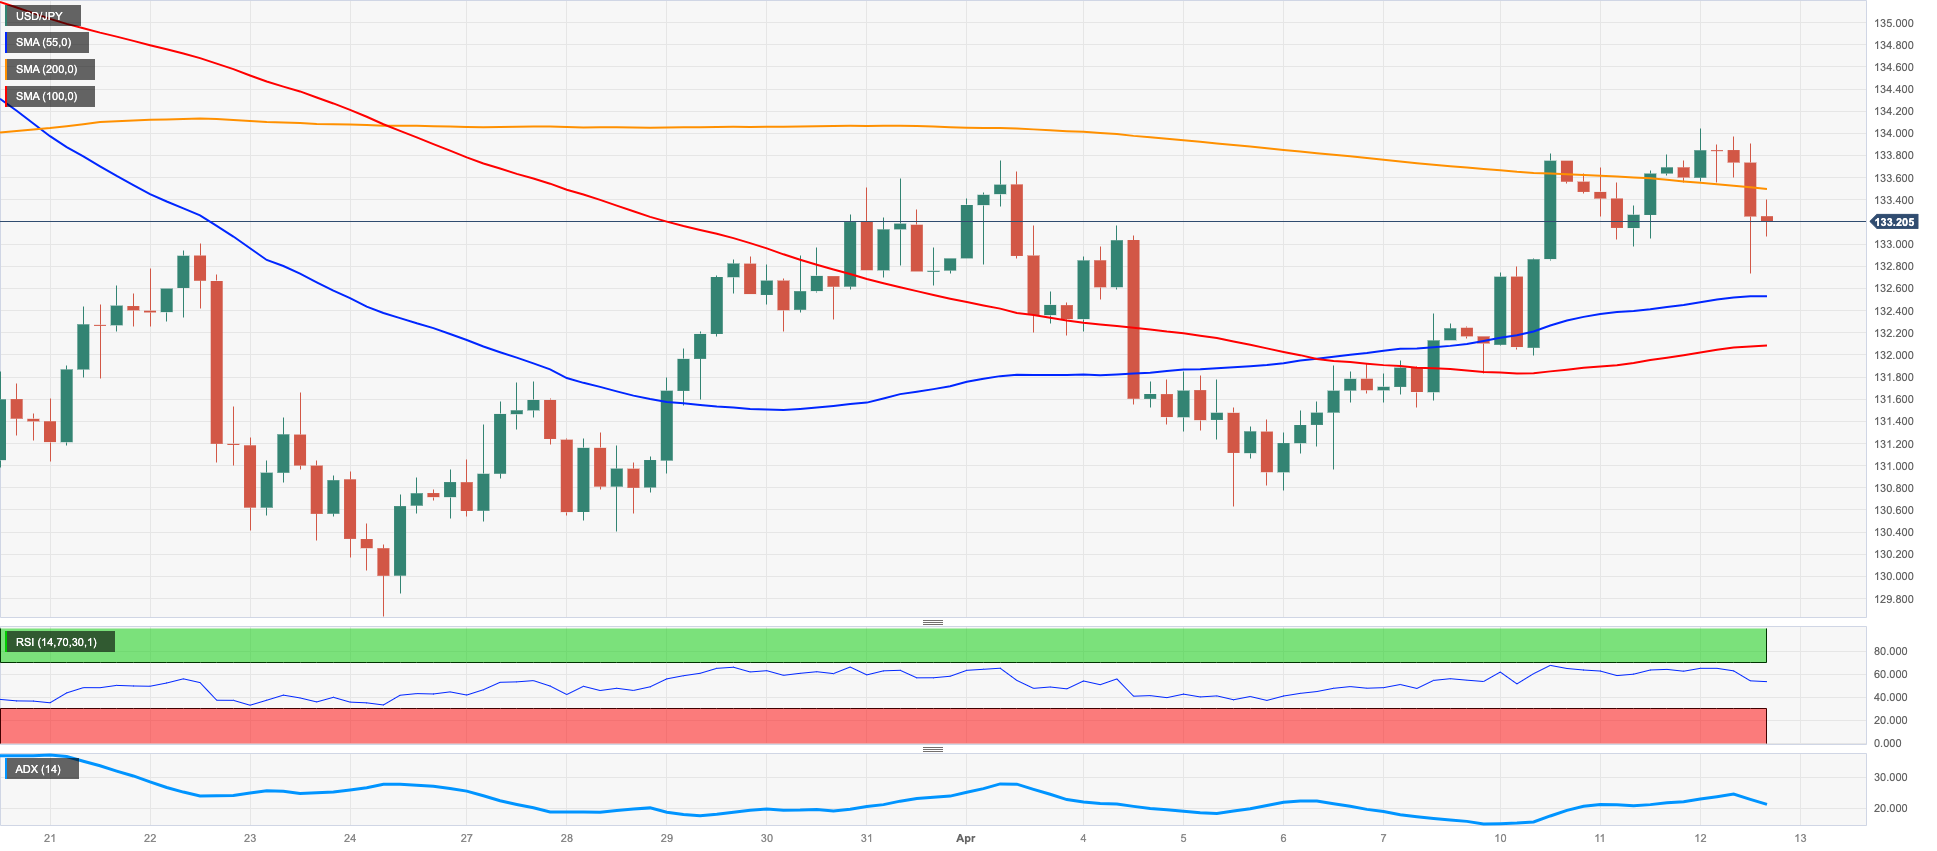
Following the earlier uptick to fresh 4-week highs just beyond 134.00 the figure, USD/JPY sparked a corrective decline pari passu with the deeper pullback in the greenback on Wednesday.
In addition, US yields halted their recent recovery and gave away part of those gains after US inflation figures surprised to the downside in March, reinforcing at the same time the idea of a Fed’s impasse in its hiking cycle.
From the BoJ, Deputy Governor Uchida suggested the bank will continue its monetary easing to achieve the price stability target in a sustainable and stable fashion.
In the “Land of the Rising Sun”, Producer Prices came in flat in March vs. the previous month and rose 7.2% over the last twelve months. In addition, Bank Lending expanded 3% in the year to March and Machinery Orders rose at an annualized 9.8% in February.
The new April peak at 134.04 (April 12) now emerges as the immediate target for the continuation of the upside in USD/JPY. The breakout of this level could open the door to a visit to the key 200-day SMA at 137.17 ahead of the 2023 high at 137.91 (March 8) and weekly tops at 139.89 (November 30 2022) and 142.25 (November 21 2022). In opposition, there is initial contention at the March low at 129.63 (March 24) before the February low at 128.08 (February 2) and ahead of the 2023 low at 127.21 (January 16). The daily RSI deflated to the sub-53 area.
Resistance levels: 134.04 135.11 136.99 (4H chart)
Support levels: 132.73 131.52 130.62 (4H chart)
GBPUSD
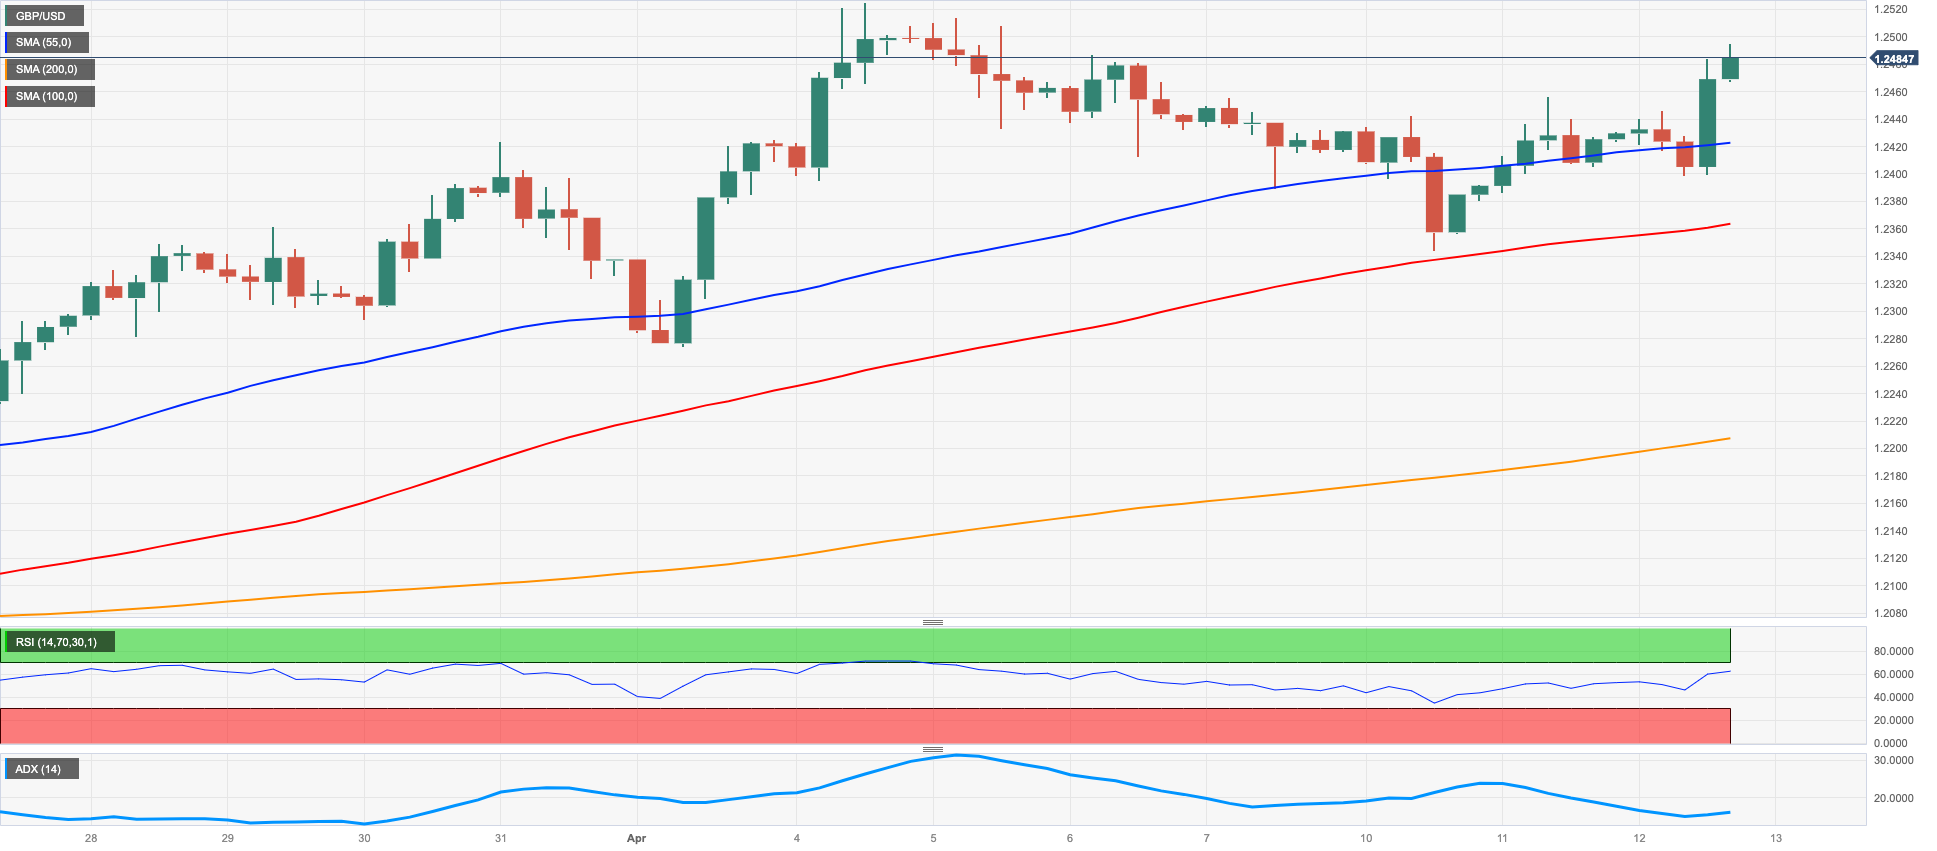
The broad-based selling interest hitting the dollar sponsored the second consecutive daily gain in GBP/USD.
In fact, Cable advanced to multi-session tops and revisited the 1.2500 region on the back of the intense sell-off in the greenback, which has particularly gathered impulse in the wake of the softer-than-expected US inflation figures during March.
There were no data releases in the UK docket on Wednesday, leaving all the attention to a slew of results on Thursday, namely, GDP readings, Trade Balance, Industrial and Manufacturing Production and the NIESR GDP Tracker.
Immediately to the upside in GBP/USD emerges the 2023 high at 1.2525 (April 4) prior to the May 2022 top at 1.2666 (May 27). If the pair breaks above the latter, it could then lead up to a move to the 200-week SMA at 1.2867 ahead of the psychological 1.3000 yardstick. Having said that, there is an initial support at the April low at 1.2274 (April 3) seconded by provisional contention at the 55- and 100-day SMAs at 1.2177 and 1.2172, respectively, and seconded by the weekly low at 1.2010 (March 15). The breach of this level could put a test of the key 200-day SMA at 1.1906 back on the radar before the 2023 low at 1.1802 (March 8). The daily RSI ticked higher to the area above 62.
Resistance levels: 1.2495 1.2525 1.2599 (4H chart)
Support levels: 1.2344 1.2274 1.2197 (4H chart)
AUDUSD
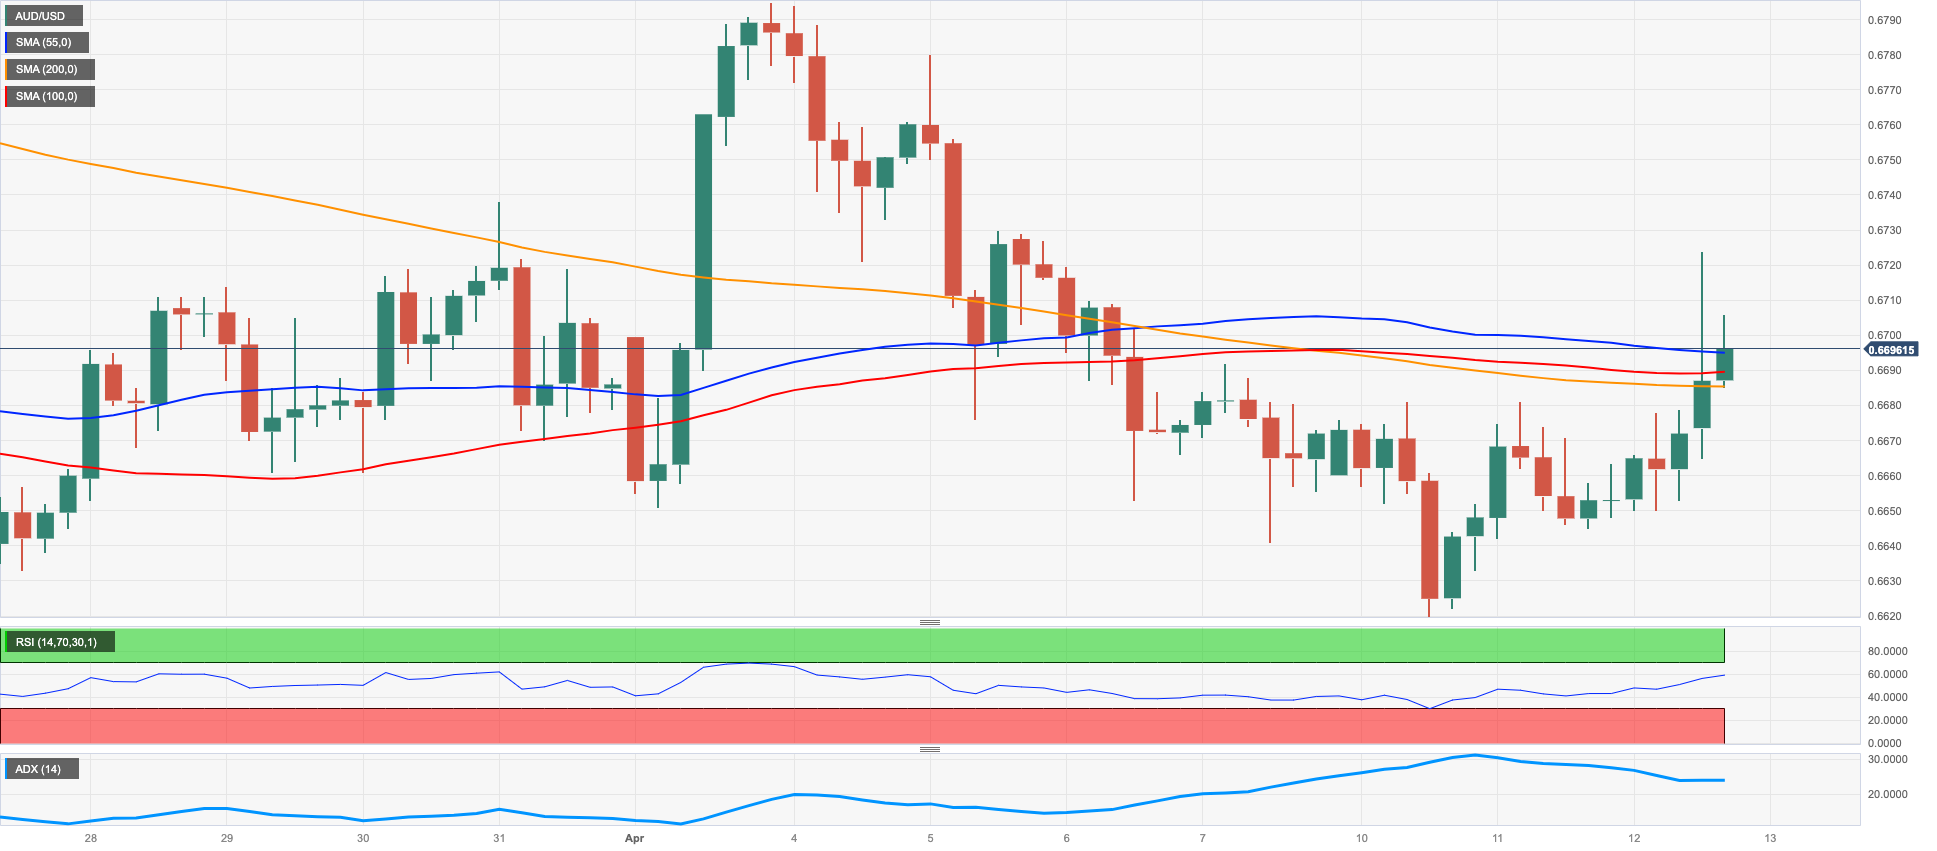
AUD/USD advanced to multi-day tops past 0.6700 the figure early on Wednesday, although part of those gains evaporated towards the end of the NA session on Wednesday.
Another negative session in the greenback allowed the pair to post gains for the second straight day, while the broad-based upbeat tone in the commodity complex also added to the so far weekly recovery.
In the Aussie calendar, final figures saw Building Permits expand 4.0% MoM in February and contract 31.1% vs. the same month of 2022. In addition, Deputy Governor M. Bullock said the bank would have paused its hiking cycle even without the global banking stress, adding that rates remain in the restrictive territory. She suggested that the bank expects to get inflation down and keep progress made on employment.
The continuation of the recovery in AUS/USD now targets the key 200-day SMA at 0.6743 seconded by the April top at 0.6793 (April 4). The latter remains bolstered by the proximity of the interim 55- and 100-day SMAs. Beyond this region emerges the key round level at 0.7000 before the weekly high at 0.7029 (February 14). On the flip side, if the pair breaches the 2023 low at 0.6563 (March 10) it could put the weekly low at 0.6386 (November 10 2022) to the test ahead of the November 2022 low at 0.6272 (November 3). The daily RSI leapt to the boundaries of the 50 zone.
Resistance levels: 0.6723 0.6779 0.6793 (4H chart)
Support levels: 0.6619 0.6589 0.6563 (4H chart)
GOLD
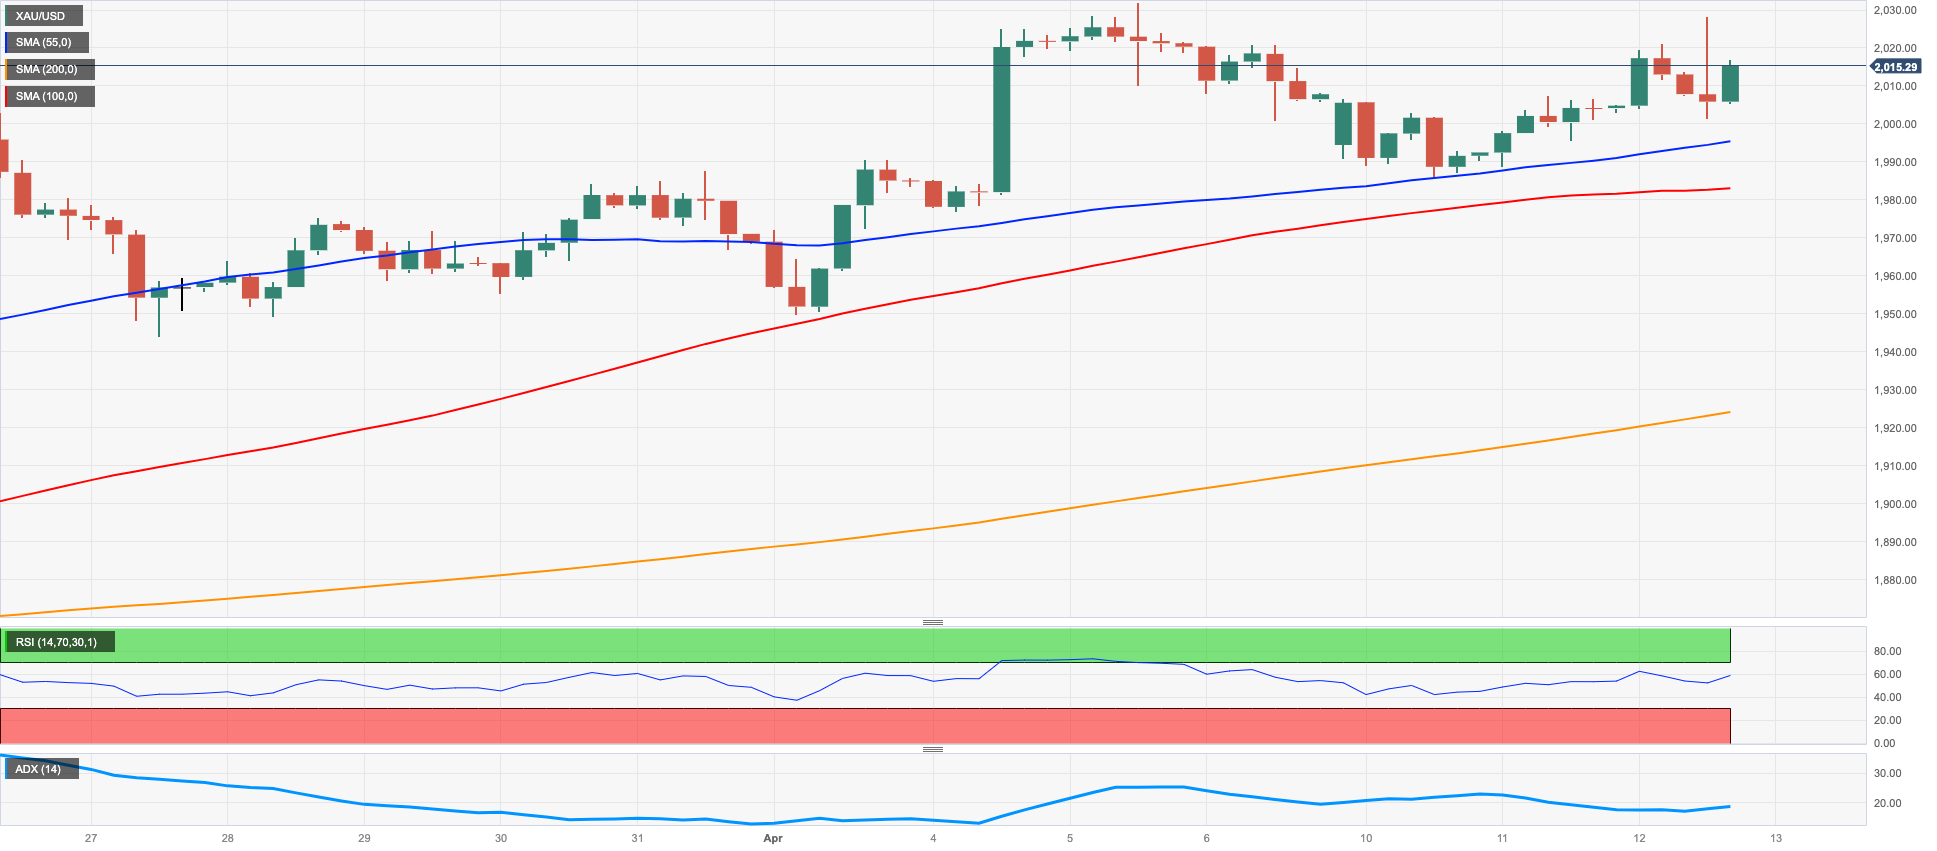
Another negative performance of the greenback allowed prices of the yellow metal to edge higher and poke with the area of YTD peaks around the $2030 level per ounce troy on Wednesday.
Indeed, a downside surprise in US inflation figures in March accelerated the decline in the USD Index (DXY) further south of the 102.00 barrier, although the mixed note in US yields across the curve seem to have limited the daily upside.
The 2023 top at $2032 (April 5) aligns as the immediate obstacle for gold prices seconded by the 2022 peak at $2070 (March 8) and the all-time high at $2075 (August 7 2020). Just the opposite, the April low at $1949 (April 3) is expected to hold the initial test ahead of the weekly low at $1934 (March 22) and temporary contention levels at the 55- and 100-day SMAs at $1905 and $1868, respectively. Down from here, bullion could be vulnerable to extra losses to the March low at $1809 (March 8) seconded by the 2023 low at $1804 (February 28) and the key 200-day SMA at $1790.
Resistance levels: $2032 $2070 $2075 (4H chart)
Support levels: $1981 $1949 $1934 (4H chart)
CRUDE WTI
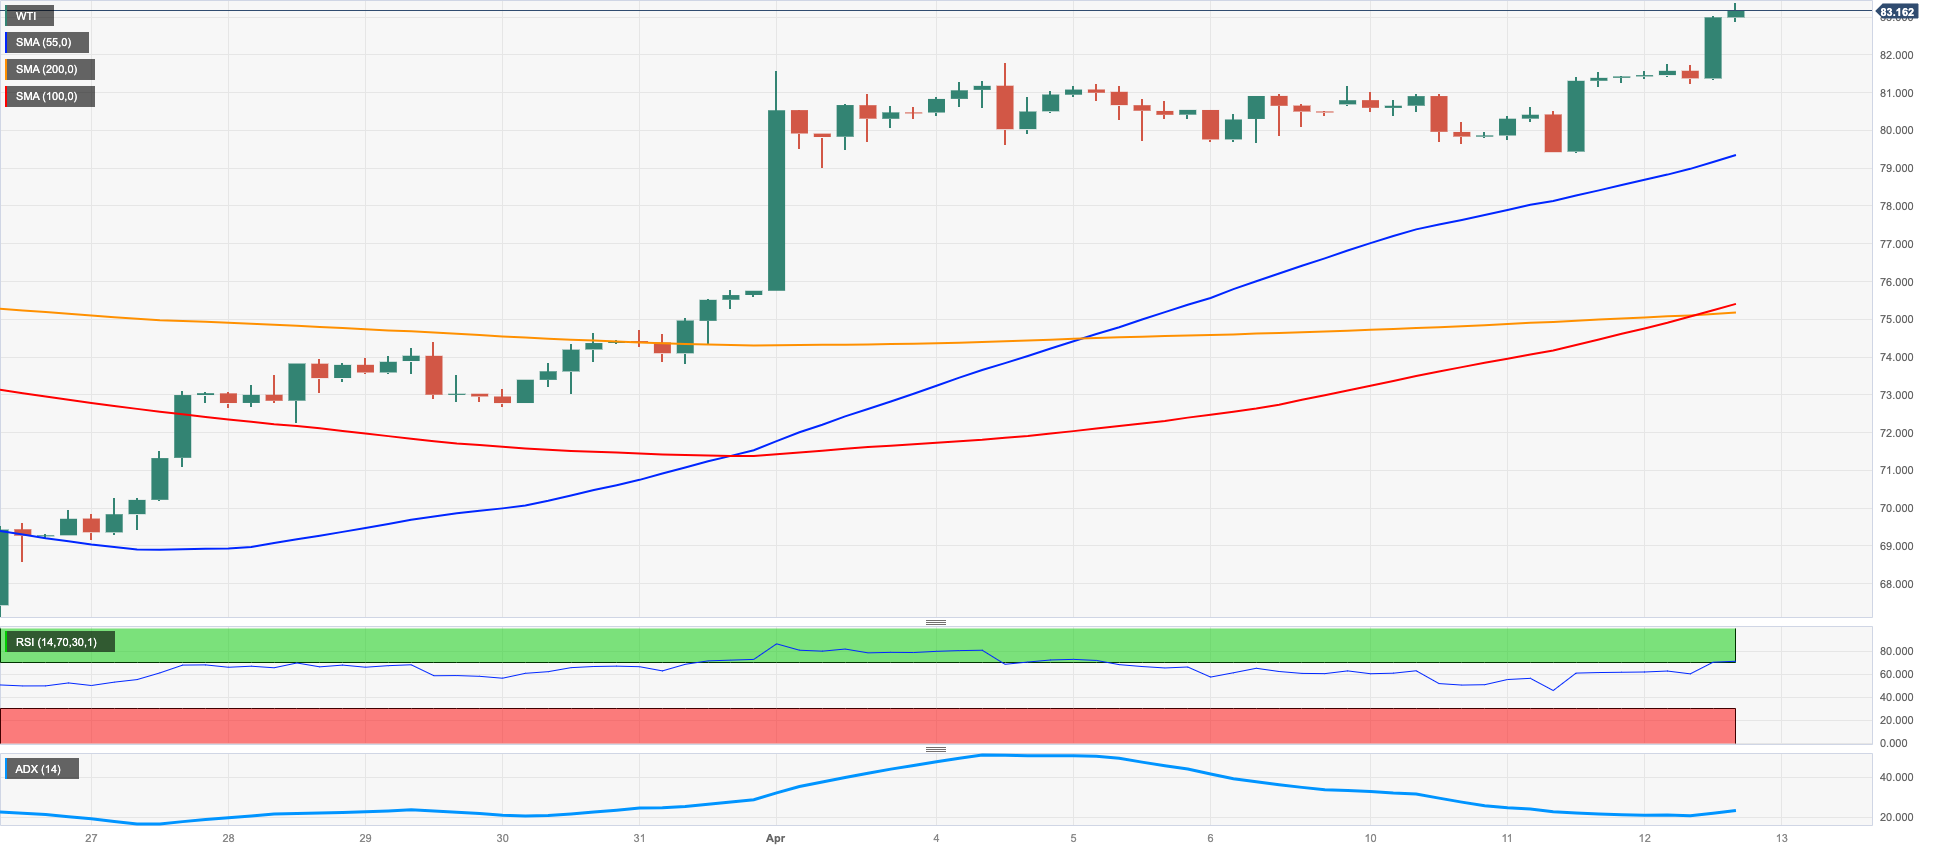
Prices of the barrel of the WTI added to Tuesday’s gains and hit new 2023 highs around $83.50 on Wednesday.
In fact, the move higher in the commodity was largely driven by expectations that the Fed might pause its hiking cycle in May, while speculation of interest rate cuts at some point by year end also added to the upbeat sentiment among traders.
By the same token, the greenback lost further ground and lent extra oxygen to the USD-denominated universe and the risk complex in general.
The solid move in crude oil seems to have been enough to practically ignore the EIA’s weekly report, where US crude oil inventories unexpectedly went up by 0.597M barrels in the week to April 7, while supplies at Cushing shrank by 0.409M barrels, Weekly Distillate Stocks declined by 0.606M barrels and gasoline stockpiles decreased by 0.331M barrels.
Later in the week, the OPEC and the IEA will release their monthly reports on Thursday and Friday, respectively.
WTI now faces the next hurdle at the 2023 peak at $83.49 (April 12). The breakout of this level is expected to see the next resistance level of note at the November 2022 high at $93.73 (November 7). The other way around, the April low at $79.05 (April 3) should offer initial contention before the interim 100- and 55-day SMAs at $76.72 and $76.10, respectively, seconded by the $66.86 level (March 24) and ahead of the 2023 low at $64.41 (March 20), The loss of the latter exposes the December 2021 low at $62.46 (December 2).
Resistance levels: $83.49 $88.65 $90.08 (4H chart)
Support levels: $78.97 $74.85 $72.57 (4H chart)
GER40
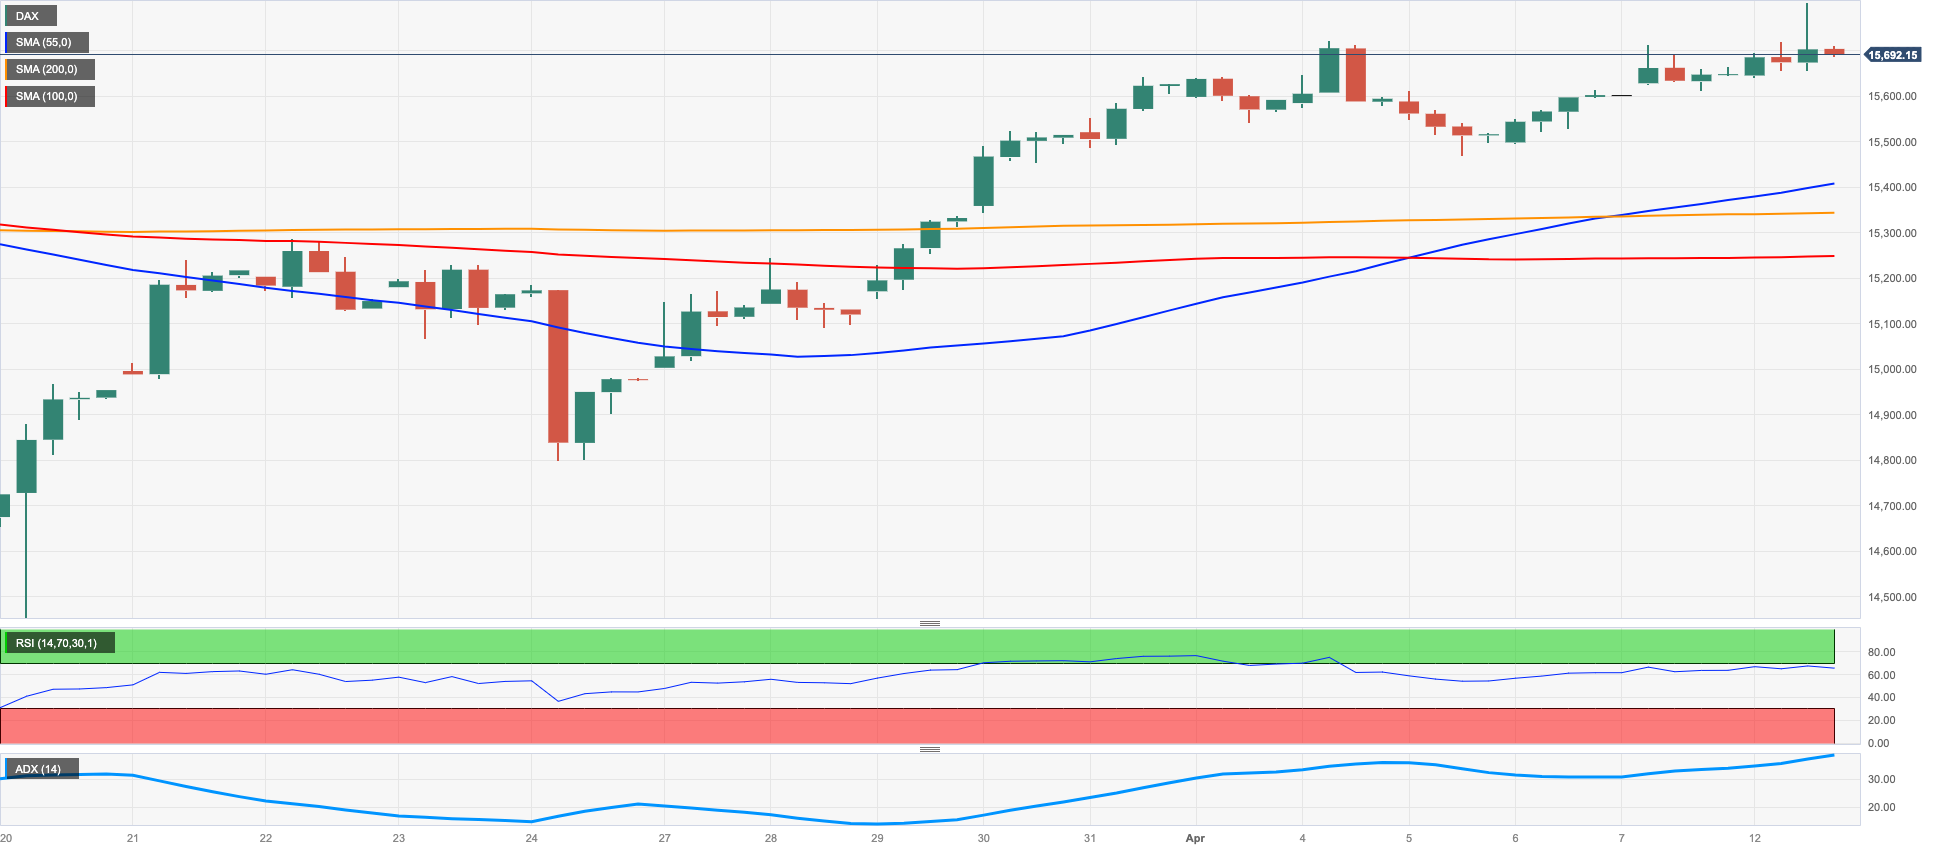
The German benchmark DAX40 advanced to fresh 2023 tops past the 15800 level on Wednesday, although the move lacked follow through and the index receded a tad towards the end of the European trading hours.
Optimism around another weak print from US CPI fuelled speculation of a Fed’s pivot in the near term, although hawkish comments from ECB’s Board member Holzmann – who favoured a 50 bps rate hike – poured cold water over that initial upbeat mood.
In Germany, the 10-year Bund yields advanced further and flirted with the 2.40%, or multi-session highs.
The German docket was empty on Wednesday, leaving all the attention to Thursday’s release of final inflation figures for the month of March, February’s Current Account and the speech by BuBa’s J. Nagel.
The next target of note for the DAX40 now appears at the 2023 high at 15827 (April 12) prior to the round level at 16000 and the 2022 high at 16285 (January 5). By contrast, the April low at 15482 (April 5) comes first ahead of the provisional 55- and 100-day SMAs at 15336 and 14935, respectively, before the minor support at 14809 (March 24) and the March low at 14458 (March 20). A drop below the latter could put the key 200-day SMA at 14010 to the test. The daily RSI trespassed the 60 area.
Best Performers: Daimler Truck Holdings, BMW ST, Vonovia
Worst Performers: Merck, Zalando SE, Adidas
Resistance levels: 15827 15912 16090 (4H chart)
Support levels: 15482 15273 14809 (4H chart)
NASDAQ
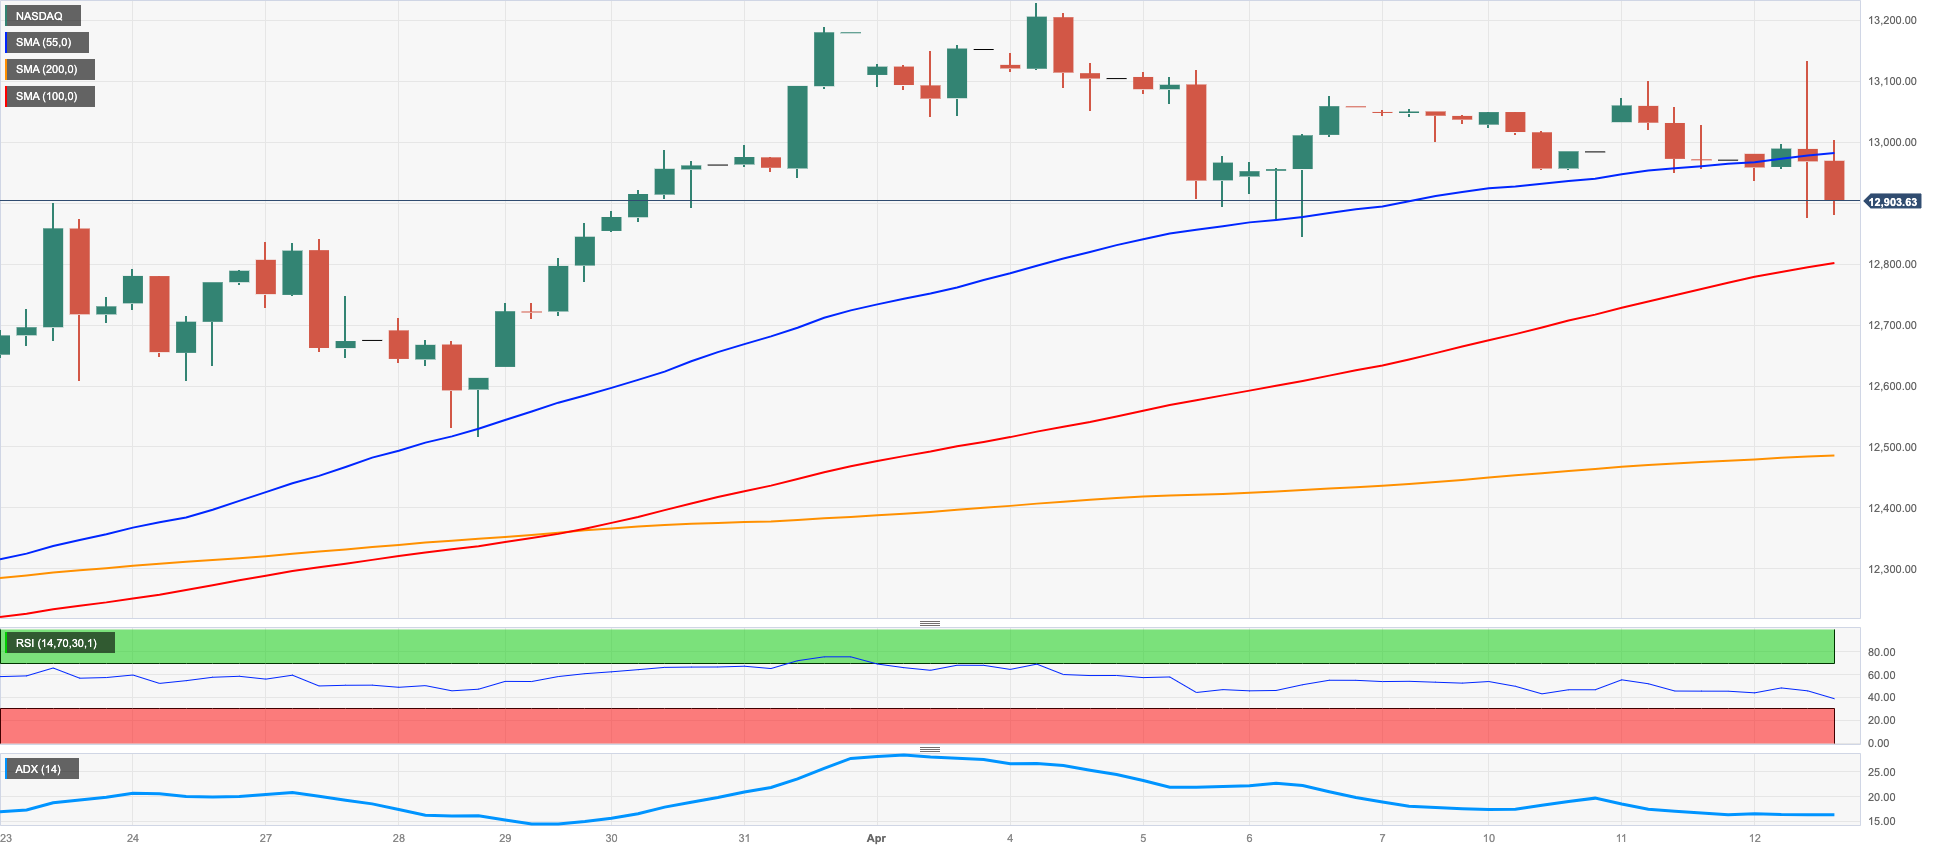
The tech sector charted a negative session on Wednesday and prompted the reference Nasdaq 100 to extend at the same time the multi-session consolidative theme around the 13000 region.
The tech sector remained unable to gather some upside traction despite the sharp decline in the dollar and the mixed activity in the US money markets, while comments from some FOMC members in the wake of the release of US inflation figures stressing that there is still more work to do regarding consumer prices weighed on investors’ sentiment.
If the Nasdaq 100 breaks below the April low at 12846 (April 6), it could then put the weekly low at 12517 (March 28) back on the radar prior to the interim 55-day SMA at 12438. Further losses could revisit the key 200-day SMA at 11981 before the March low at 11695 (March 13) and weekly lows at 11550 (January 25) and 11251 (January 19), all ahead of the 2023 low at 10696 (January 6). Contrarily, the initial hurdle remains at the 2023 high at 13204 (April 4) followed by the August 2022 top at 13720 (August 16) and the round level at 14000. The continuation of the upside could see the March 2022 top at 15265 (March 29) revisited. The daily RSI receded to the sub-60 region.
Top Gainers: Crowdstrike Holdings, Datadog, AstraZeneca ADR
Top Losers: JD.com Inc Adr, PDD Holdings DRC, Charter Communications Inc
Resistance levels: 13204 13720 14277 (4H chart)
Support levels: 12846 12517 11971 (4H chart)
DOW JONES
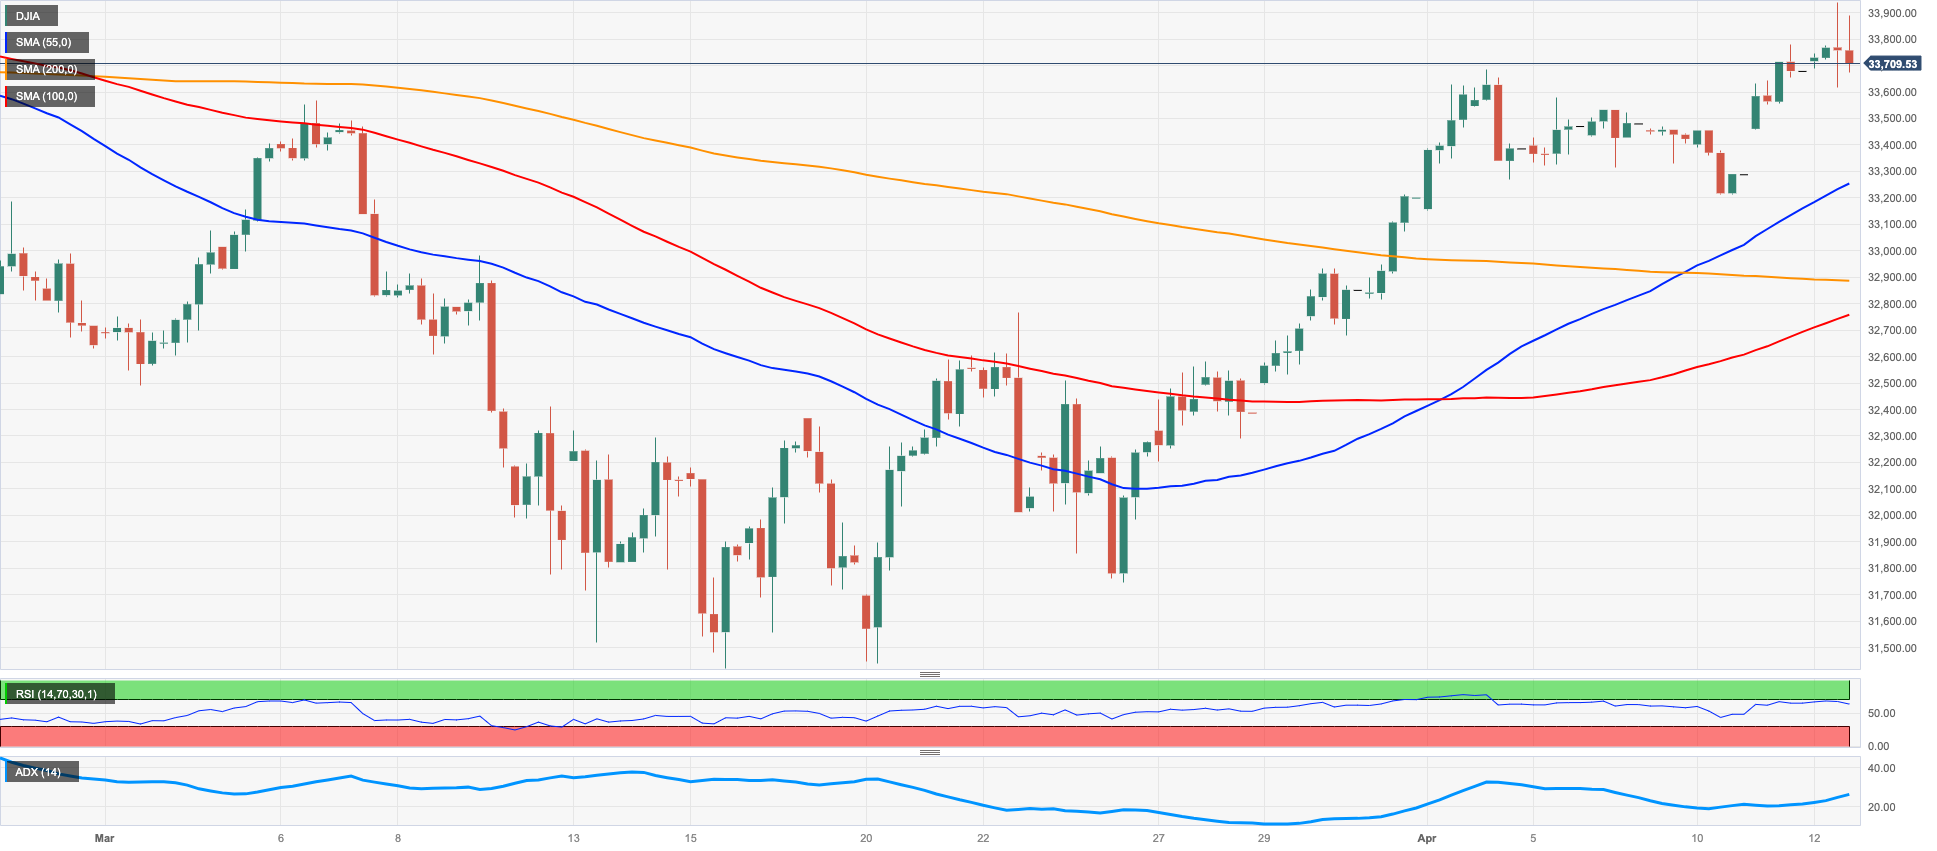
Equities tracked by the Dow Jones advanced to new 2-month highs in the area just shy of the 34000 barrier on Wednesday.
In fact, the index clinched the fifth consecutive session with gains and this time appeared underpinned by the persevering sell-off in the dollar, lack of traction in US yields and the lower-than-estimated US inflation figures.
The latter reinforced the likelihood of a pause in the Fed’s tightening cycle in the relatively short-term horizon at the same time, a view that was suggested by some Fed officials at the March meeting, according to the FOMC Minutes.
All in all, the Dow Jones gained 0.58% to 33894, the S&P500 dropped 0.08% to 4105 and the tech-reference Nasdaq Composite eased 0.43% to 11980.
Further rebound in the Dow Jones targets the April high at 33894 (April 12) ahead of the 2023 top at 34342 (January 13) and the December 2022 peak at 34712 (December 13. The surpass of this level could open the door to a visit to the April 2022 high at 35492 (April 21) prior to the February 2022 top at 35824 (February 9). On the opposite side, the 55-day SMA at 33177 offers provisional contention ahead of the 50% Fibo retracement (of the February-March drop) at 32880 and the key 200-day SMA at 32496. Down from here emerges the 2023 low at 31429 (March 15) prior to the 30000 level and the 2022 low at 28660 (October 13). The daily RSI rose past the 65 yardstick.
Top Performers: Dow, Microsoft, Merck&Co
Worst Performers: Walgreen Boots, Walt Disney, IBM
Resistance levels: 33894 34334 34712 (4H chart)
Support levels: 33354 31805 31429 (4H chart)
MACROECONOMIC EVENTS

All Information & Updates provided by:

All information relating to the financial markets available on this page has been prepared and issued by FXStreet (Forexstreet SL, Spain, Reg: B62498233) on the basis of publicly available information and all information believed to be reliable and does not conflict with Kuwaiti local laws, and all necessary care has been taken to before the company to ensure that the facts mentioned are correct from the source.
NCM Investment nor any of its directors or employees shall in any way be held responsible for the contents of this news, and the information contained on this page is intended only to provide clients with publicly available information and should not be construed as investment advice, report or analysis and/or constitute an offer or invitation to buy or sell financial instruments of any kind.
RISK WARNING: Forex and CFDs are highly risky leveraged products, as losses can exceed deposits. Please ensure you understand all the risks and take independent advice if necessary. NCM will segregate the clients based on the criteria of the regulator and its bylaws. NCM does not provide any advisory service; the material published does not constitute advice or a recommendation for a transaction in any financial instrument. NCM accepts no responsibility for any use of the content presented and any consequences of that use. Anyone acting on the information provided does so at their own risk.