
- Contact Us:
-

-

-

-


Daily Market Updates
14 Apr 2023
USDJPY
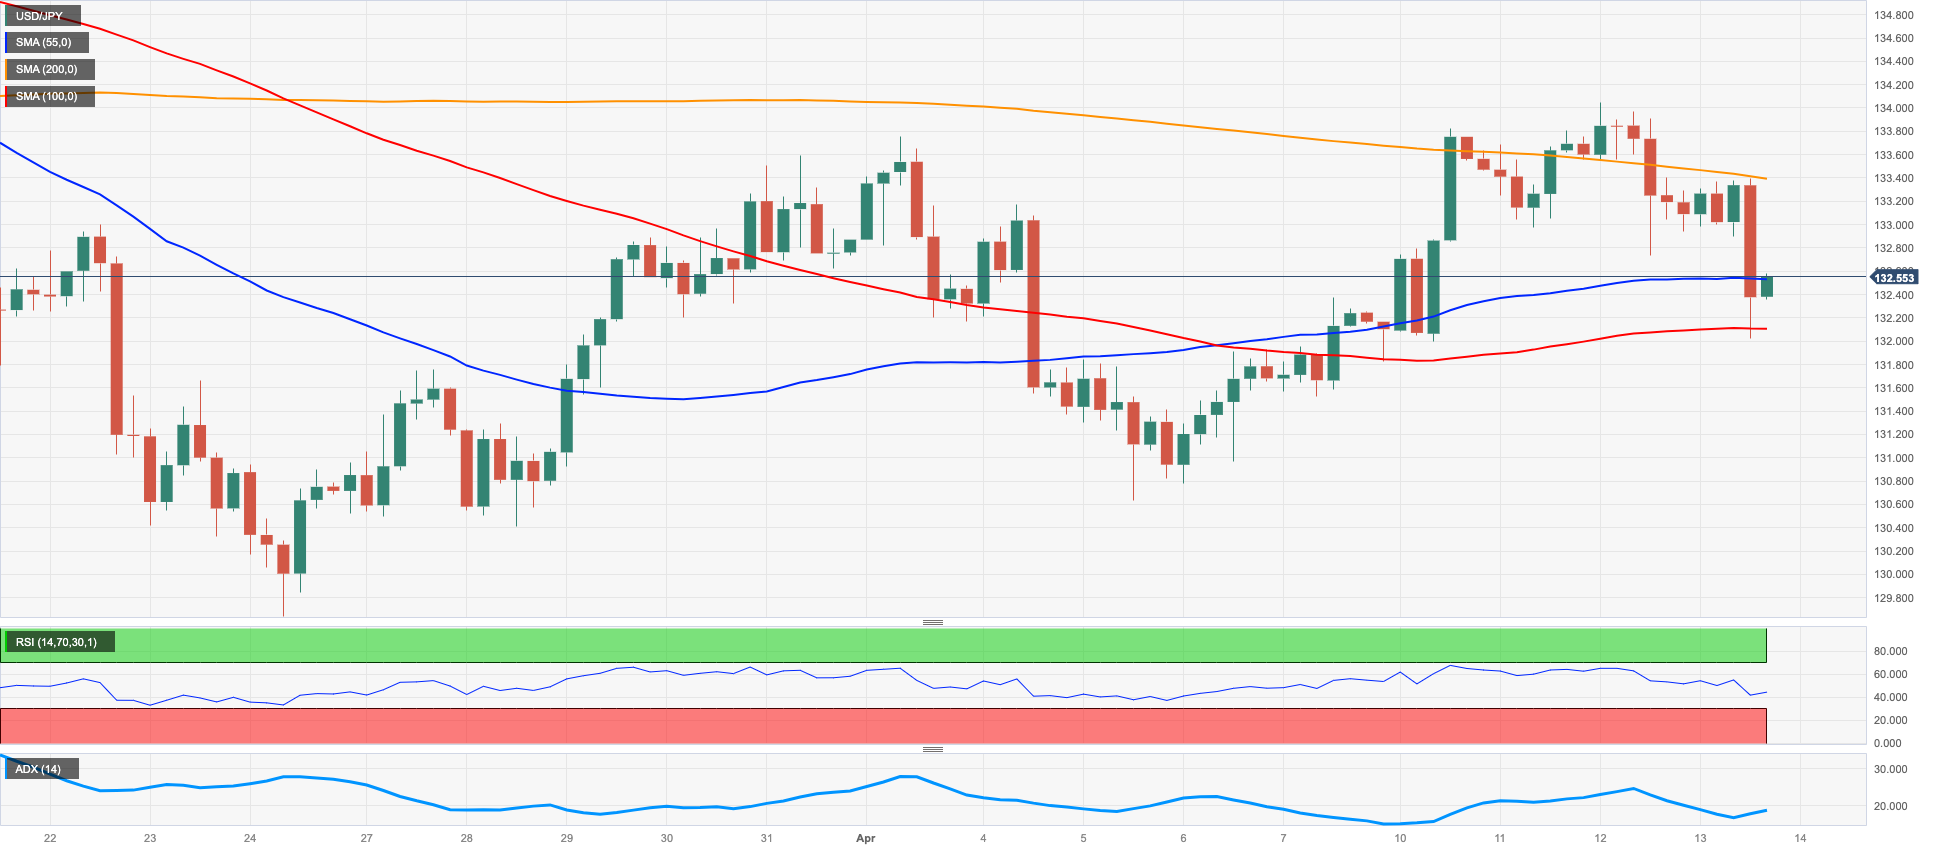
USD/JPY charted a negative session on Thursday and probe lows near the 132.00 neighbourhood amidst a very weak dollar and erratic US yields.
Indeed, the greenback remained well on the defensive and retreated to 2-month lows in the sub-101.00 zone when tracked by the USD Index (DXY) in spite of the higher probability of another 25 bps rate hike by the Fed in May.
Furthermore, expectations that the Fed’s tightening cycle might be ending soon seem to have accentuated the selling feeling around the buck in past sessions.
Back to the bonds market, US yields edged higher in the belly and the long end of the curve and left behind Wednesday’s small pullback, while the JGB 10-year yields remained within the multi-session consolidative range around 0.45%.
From the BoJ, Governor K. Ueda followed his predecessor and reiterated (once again) that the current accommodative monetary stance will remain in place until the economy hits the price target in a consistent and sustainable fashion.
In Japan, Foreign Bond Investment shrank ¥788.8B in the week to April 8.
Immediately to the upside in USD/JPY comes the April high at 134.04 (April 12). The surpass of this level should not meet any hurdle of note before the key 200-day SMA at 137.15 and the 2023 top at 137.91 (March 8). Up from here emerges weekly peaks at 139.89 (November 30 2022) and 142.25 (November 21 2022). Having said that, the April low at 130.62 (April 5) aligns as the next support of note ahead of the March low at 129.63 (March 24). South from here, the pair could challenge the February low at 128.08 (February 2) prior to the 2023 low at 127.21 (January 16). The daily RSI slipped back below the 49 level.
Resistance levels: 133.52 134.04 135.11 (4H chart)
Support levels: 132.01 131.52 130.62 (4H chart)
GBPUSD
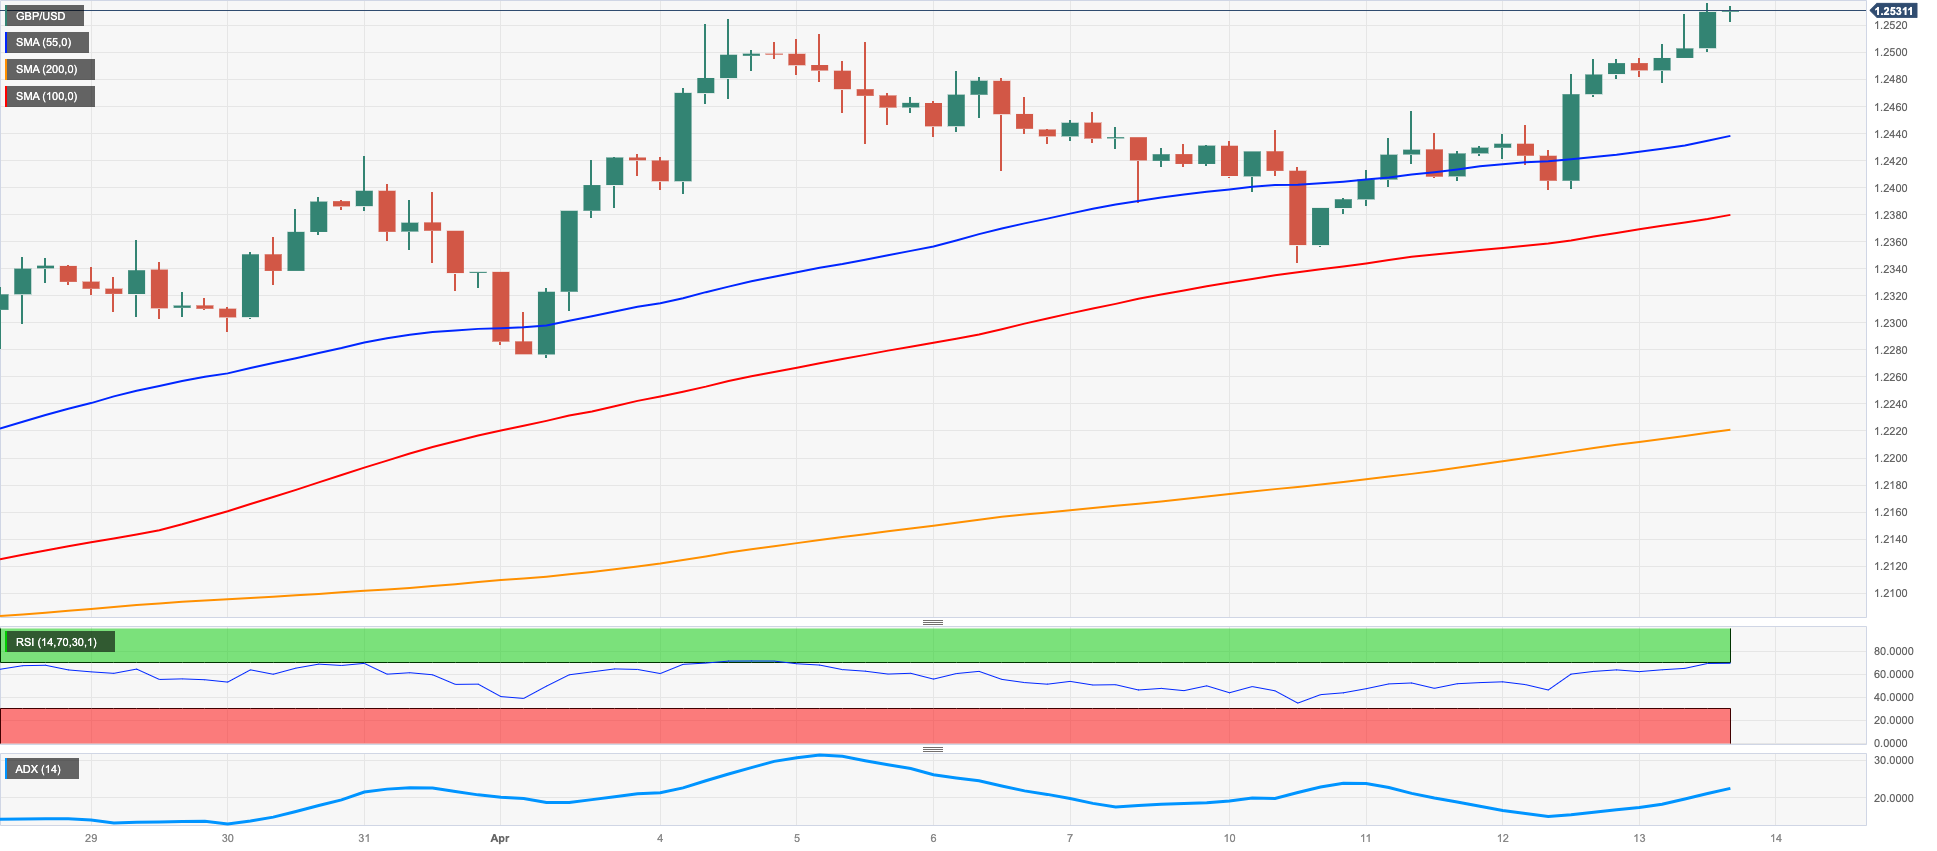
Further weakness in the greenback allowed GBP/USD to once again surpass the 1.2500 hurdle and record a new 2023 high in the 1.2535/40 band on Thursday.
In fact, the USD Index (DXY) debilitated to fresh 2-month lows near 100.80 on the back of further improvement in the risk complex despite investors still continuing to favour another 25 bps rate hike by the Fed at the May 3 event.
Further legs to the British pound came after positive surprises from the domestic docket during February. On this, GDP figures saw the UK economy expand 0.1% in the 3-month Avg and 0.5% over the last twelve months. In addition, Industrial Production and Manufacturing Production contracted less than expected at an annualized 3.1% and 2.4%, respectively, the trade deficit widened to £17.534B and Construction Output expanded 5.7% YoY
The next up barrier for GBP/USD remains at the 2023 top at 1.2525 (April 4) ahead of the May 2022 peak at 1.2666 (May 27). The breakout of this level could open the door to the 200-week SMA at 1.2867 before the psychological 1.3000 mark. On the other hand, the April low at 1.2274 (April 3) appears as the immediate contention level seconded by the provisional 55-day SMA at 1.2179 and the weekly low at 1.2010 (March 15). The loss of the latter could put the key 200-day SMA at 1.1908 to the test prior to the 2023 low at 1.1802 (March 8). The daily RSI edged higher and approached 65.
Resistance levels: 1.2537 1.2599 1.2666 (4H chart)
Support levels: 1.2398 1.2344 1.2274 (4H chart)
AUDUSD
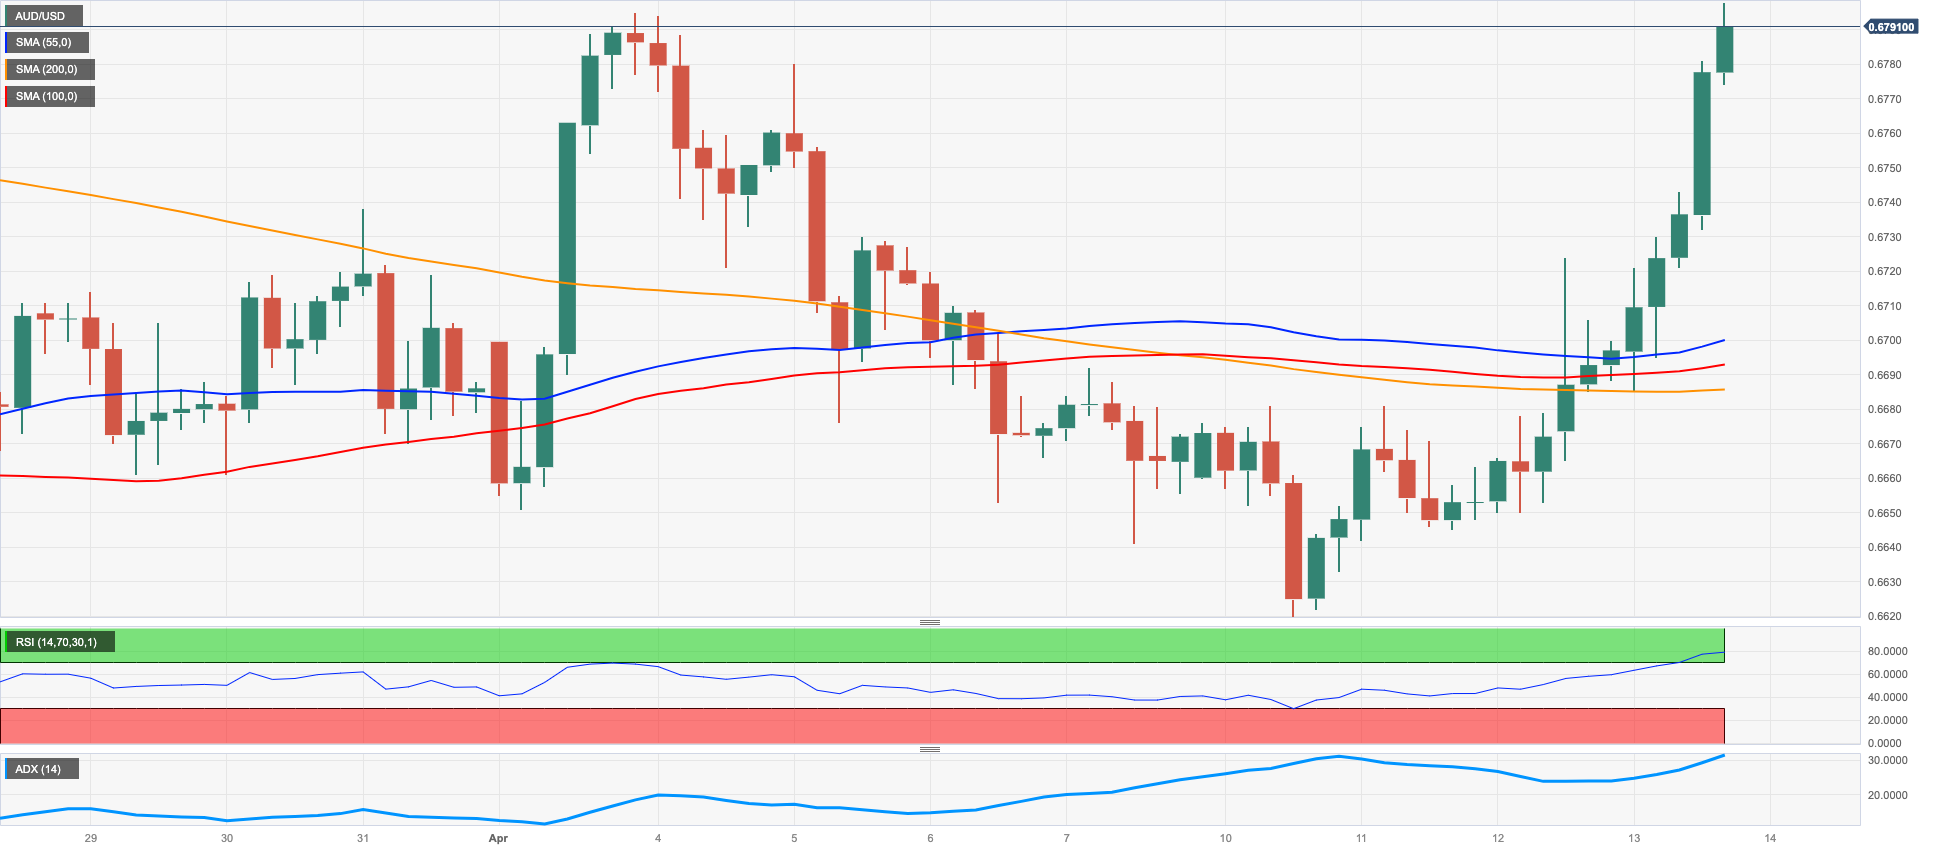
Extra improvement in the risk-linked galaxy and the persevering sell-off in the dollar lent legs to the Aussie dollar and propelled AUD/USD back to the vicinity of the 0.6800 hurdle to clinch 2-month highs and surpass at the same time the key 200-day SMA on Thursday.
Collaborating with the uptick in the pair also emerged the broad-based positive performance of the commodity universe as well as the daily advance in the AGB 10-year yields and better-than-expected trade balance figures in China during March.
Further support for AUD came from the auspicious results from the Australian jobs report, where the Employment Change increased by 53K people and the Unemployment Rate held steady at 3.5%. In addition, Consumer Inflation Expectations eased to 4.6% in April (from 5.0%).
AUD/USD printed a new April peak at 0.6796 (April 13), which still appears reinforced by the vicinity of the 100-day SMA. North from here, there are no hurdles of significance until the key round level at 0.7000 prior to the weekly top at 0.7029 (February 14). In opposition, there is an initial support at the April low at 0.6619 (April 10) ahead of the 2023 low at 0.6563 (March 10). The breach of the latter could prompt a potential test of the weekly low at 0.6386 (November 10 2022) to emerge on the horizon before the November 2022 low at 0.6272 (November 3). The daily RSI jumped past the 58 level.
Resistance levels: 0.6796 0.6920 0.7029 (4H chart)
Support levels: 0.6685 0.6619 0.6589 (4H chart)
GOLD
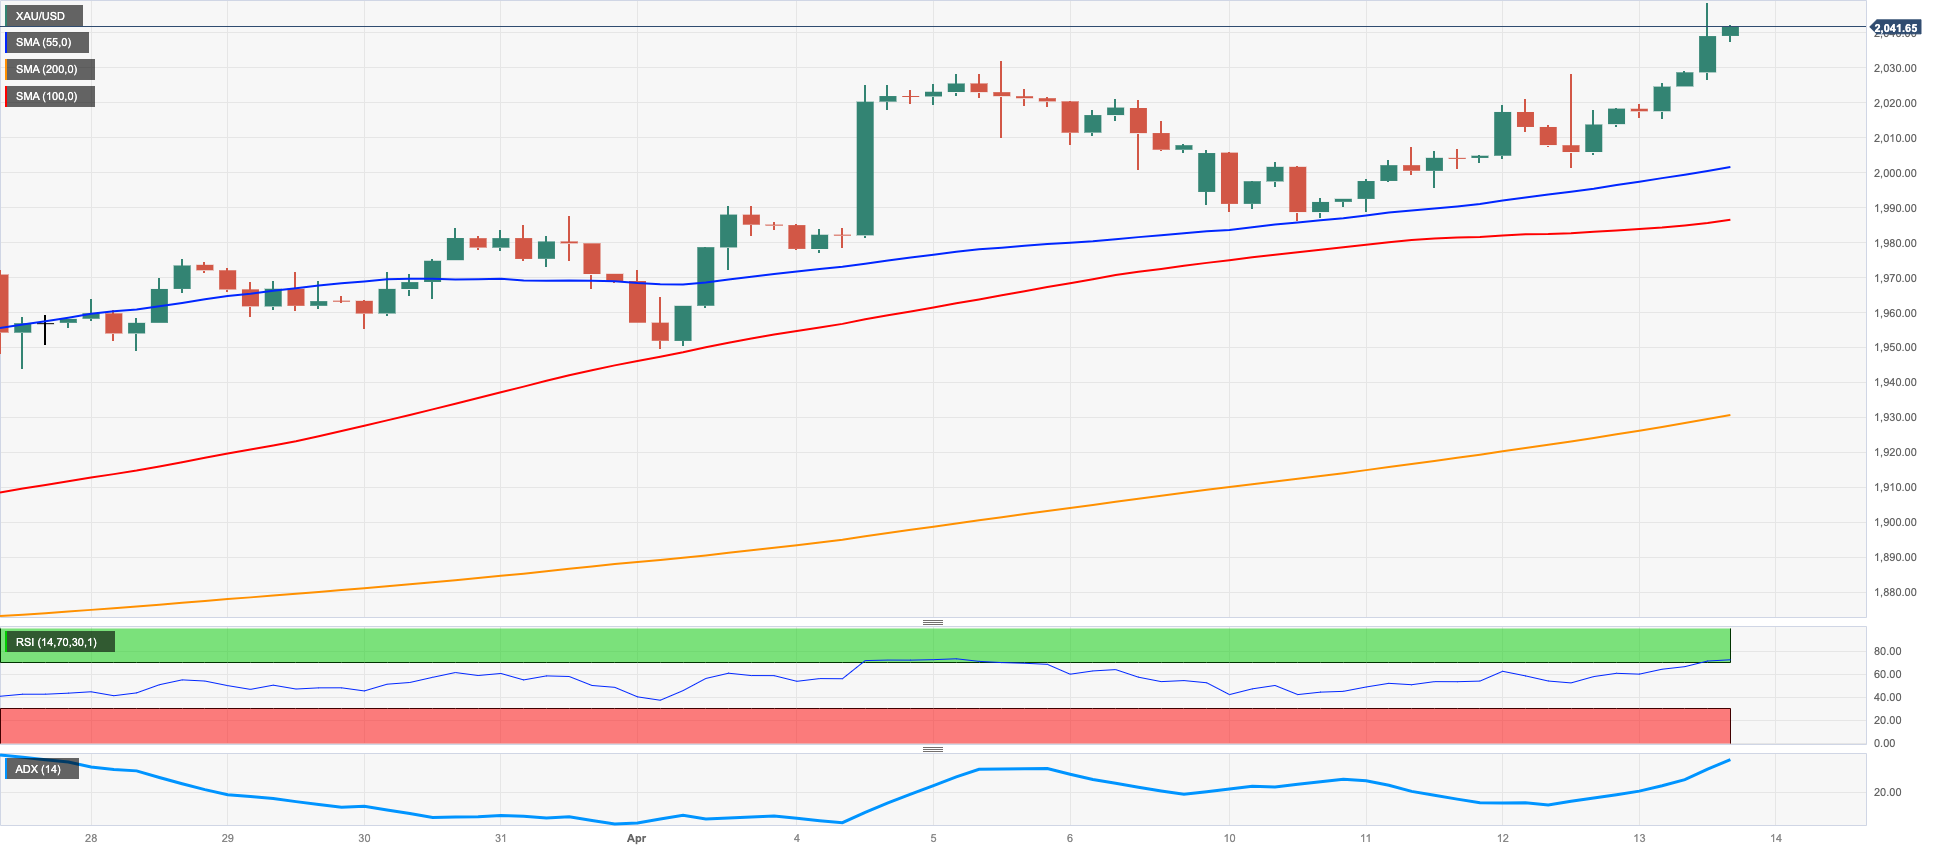
Gold prices advanced for the third straight session and poked with the $2050 region on Thursday, or new 2023 tops.
In fact, the unabated selling bias put the USD Index (DXY) under extra downside pressure and dragged it to new multi-week lows near 100.80 despite US yields recouped some losses in the long end and the belly of the curve.
In the meantime, it seems the proximity of the end of the tightening cycle by the Federal Reserve – and other major central banks – continues to prop up the upward bias in the precious metal and the rest of the USD-associated assets, all in spite of firmer conviction of a 25 bps rate raise in May (the last one?).
Extra gains in gold remain focused on the 2023 peak at $2048 (April 13), while the breakout of this level could trigger further upside to the 2022 high at $2070 (March 8) closely followed by the all-time top at $2075 (August 7 2020). On the flip side, there is a minor support at the April low at $1949 (April 3) before the weekly low at $1934 (March 22) and interim contention at the 55- and 100-day SMAs at $1907 and $1871, respectively. Below the latter, the yellow metal could confront the March low at $1809 (March 8) ahead of the 2023 low at $1804 (February 28) and the key 200-day SMA at $1791.
Resistance levels: $2048 $2070 $2075 (4H chart)
Support levels: $2001 $1981 $1949 (4H chart)
CRUDE WTI
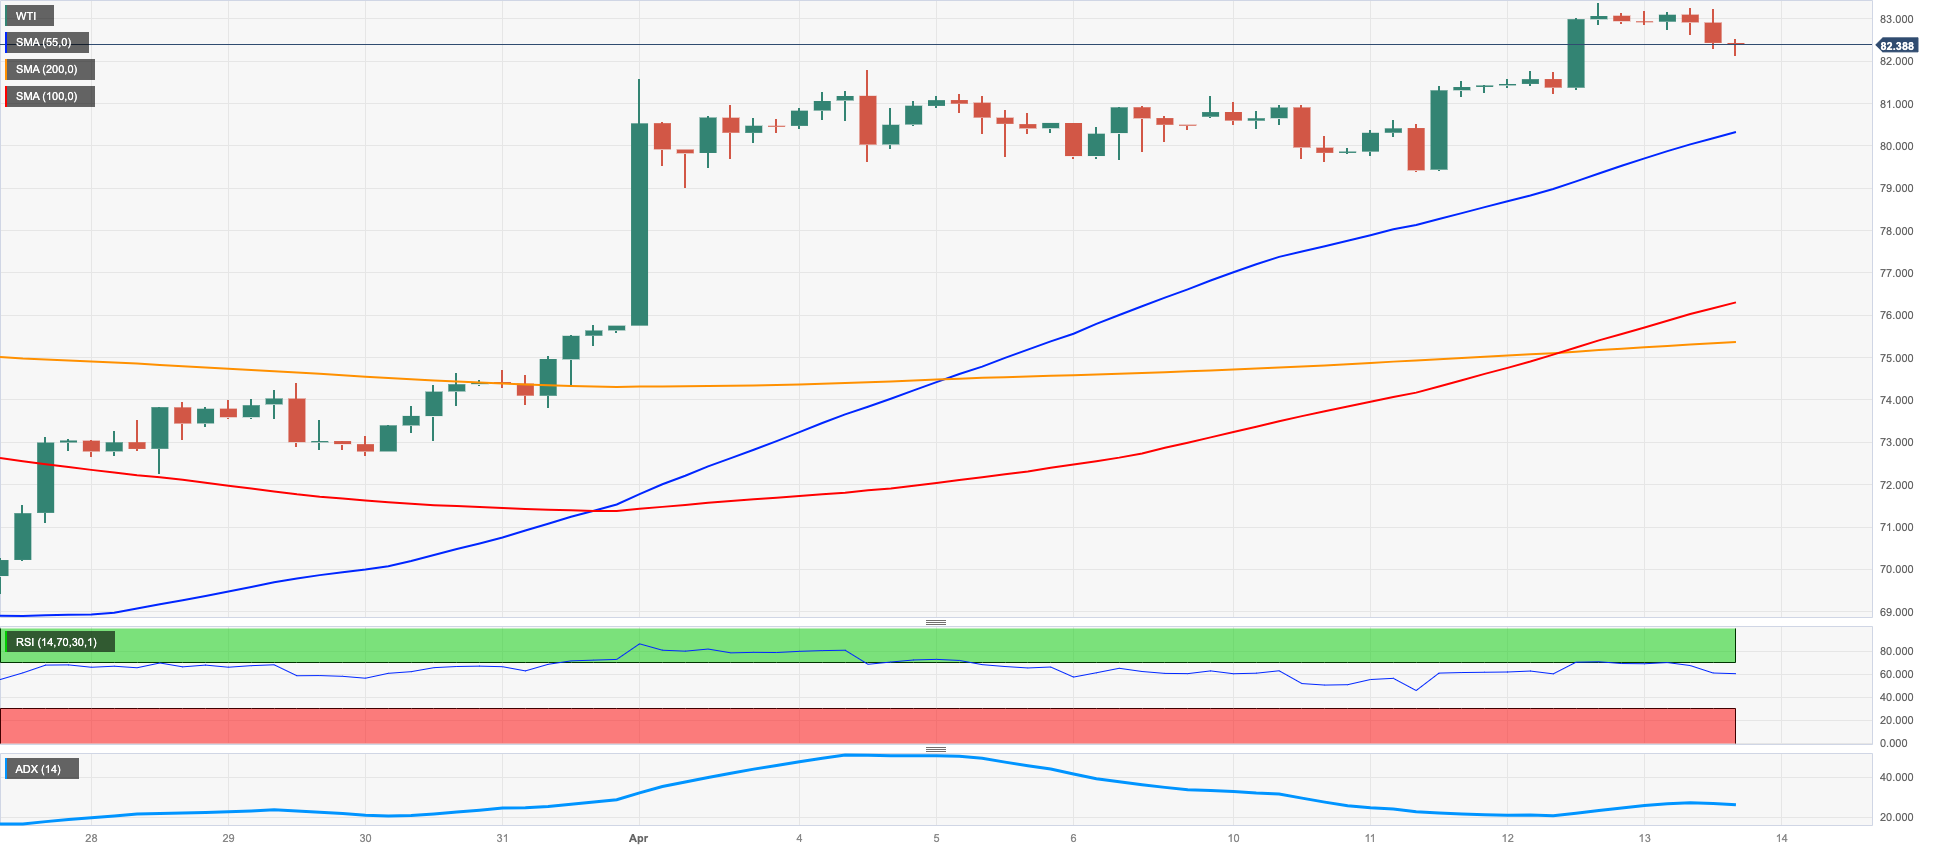
Following a move to levels last seen in mid-November 2022 past the $83.00 mark per barrel on Wednesday, prices of the West Texas Intermediate (WTI) gave away part of those gains on Thursday.
Recession concerns were once again the usual suspects and weighed on traders’ sentiment, particularly after the FOMC Minutes flagged the likelihood that the US economy could lose traction later in the year.
It is worth recalling that the recent acute move higher in prices of the WTI was exclusively in response to the reduction of oil output announced by the OPEC+ at its monthly meeting in early April.
Supporting the upside in the commodity, another sign of US disinflation (as per March US CPI readings) bolstered the speculation that the Fed’s tightening cycle might be near its end, despite a 25 bps rate hike appearing well on the cards for the time being.
The 2023 high at $83.49 (April 12) appears reinforced by the proximity of the 200-day SMA at $83.13. If the WTI surpasses this region, the next hurdle of relevance is not seen before the November 2022 top at $93.73 (November 7). On the contrary, there is an initial support at the April low at $79.05 (April 3) prior to the temporary 100- and 55-day SMAs at $76.75 and $76.14, respectively. Down from here appears the $66.86 level (March 24) seconded by the 2023 low at $64.41 (March 20) and the December 2021 low at $62.46 (December 2).
Resistance levels: $83.49 $88.65 $90.08 (4H chart)
Support levels: $81.25 $79.35 $78.97 (4H chart)
GER40
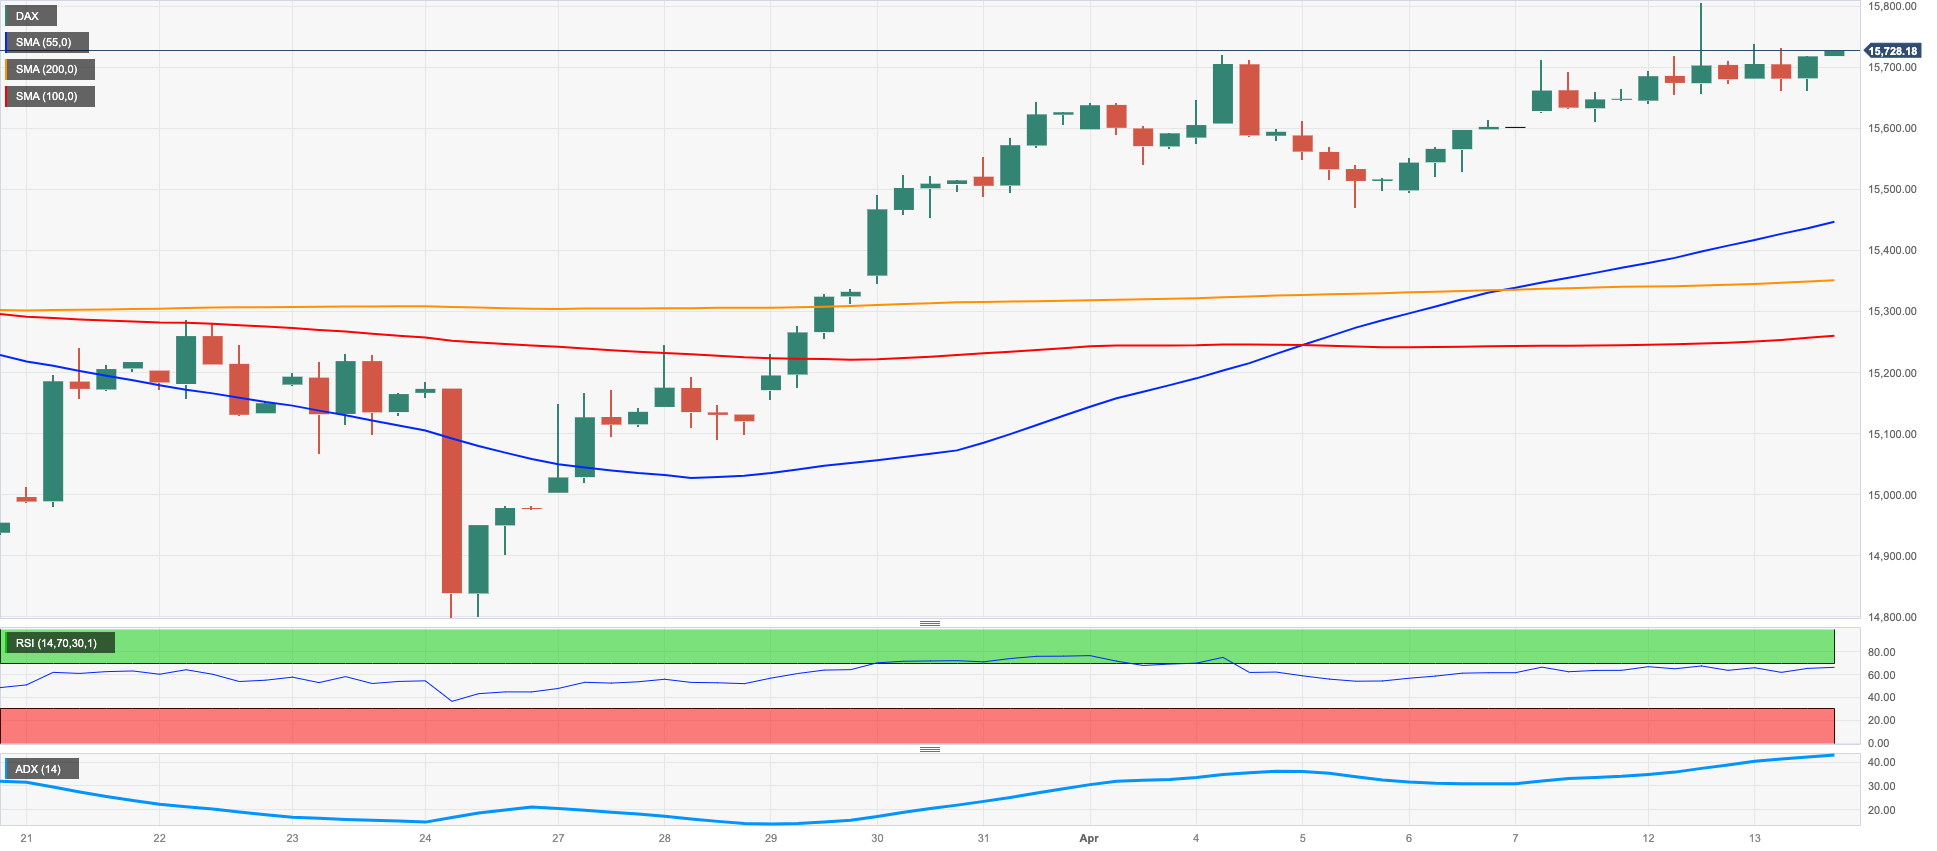
The German reference stock index DAX40 clinched the fourth session in a row with gains on Thursday, managing at the same time to keep the trade above the 15700 level and near Wednesday’s YTD peaks.
In fact, optimism in the European markets remained well and sound on Thursday, as investors digested the lower-than-expected US inflation figures and prospects that the Fed could end its normalization process (via interest rate hikes) in the near term.
Also underpinning the upbeat sentiment, speculation that interest rates in the euro area could be near their peak continued to gather traction.
In line with the uptick in stocks, the 10-year Bund yields advanced modestly, although they seem to have met quite a tough barrier around the 2.40% region so far.
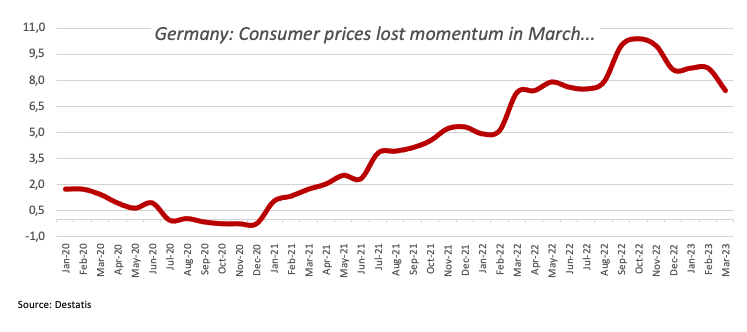
In the domestic calendar, final inflation figures showed the CPI rose 7.4% YoY in March and 0.8% on a monthly basis, matching the preliminary readings. In addition, the Current Account surplus widened to €22.6B in February.
The DAX40 faces the next hurdle at the 2023 top at 15827 (April 12). The continuation of the uptrend could see the round level at 16000 revisited prior to the 2022 top at 16285 (January 5). On the opposite side, bears are expected to meet initial support at the April low at 15482 (April 5) ahead of the interim 55- and 100-day SMAs at 15347 and 14948, respectively. Down from here emerges the minor support at 14809 (March 24) seconded by the March low at 14458 (March 20) and the key 200-day SMA at 14025. The daily RSI edged higher and trespassed 61.
Best Performers: Merck, Zalando SE, Infineon
Worst Performers: Covestro, BASF, Deutsche Bank AG
Resistance levels: 15827 15912 16090 (4H chart)
Support levels: 15482 15273 14809 (4H chart)
NASDAQ
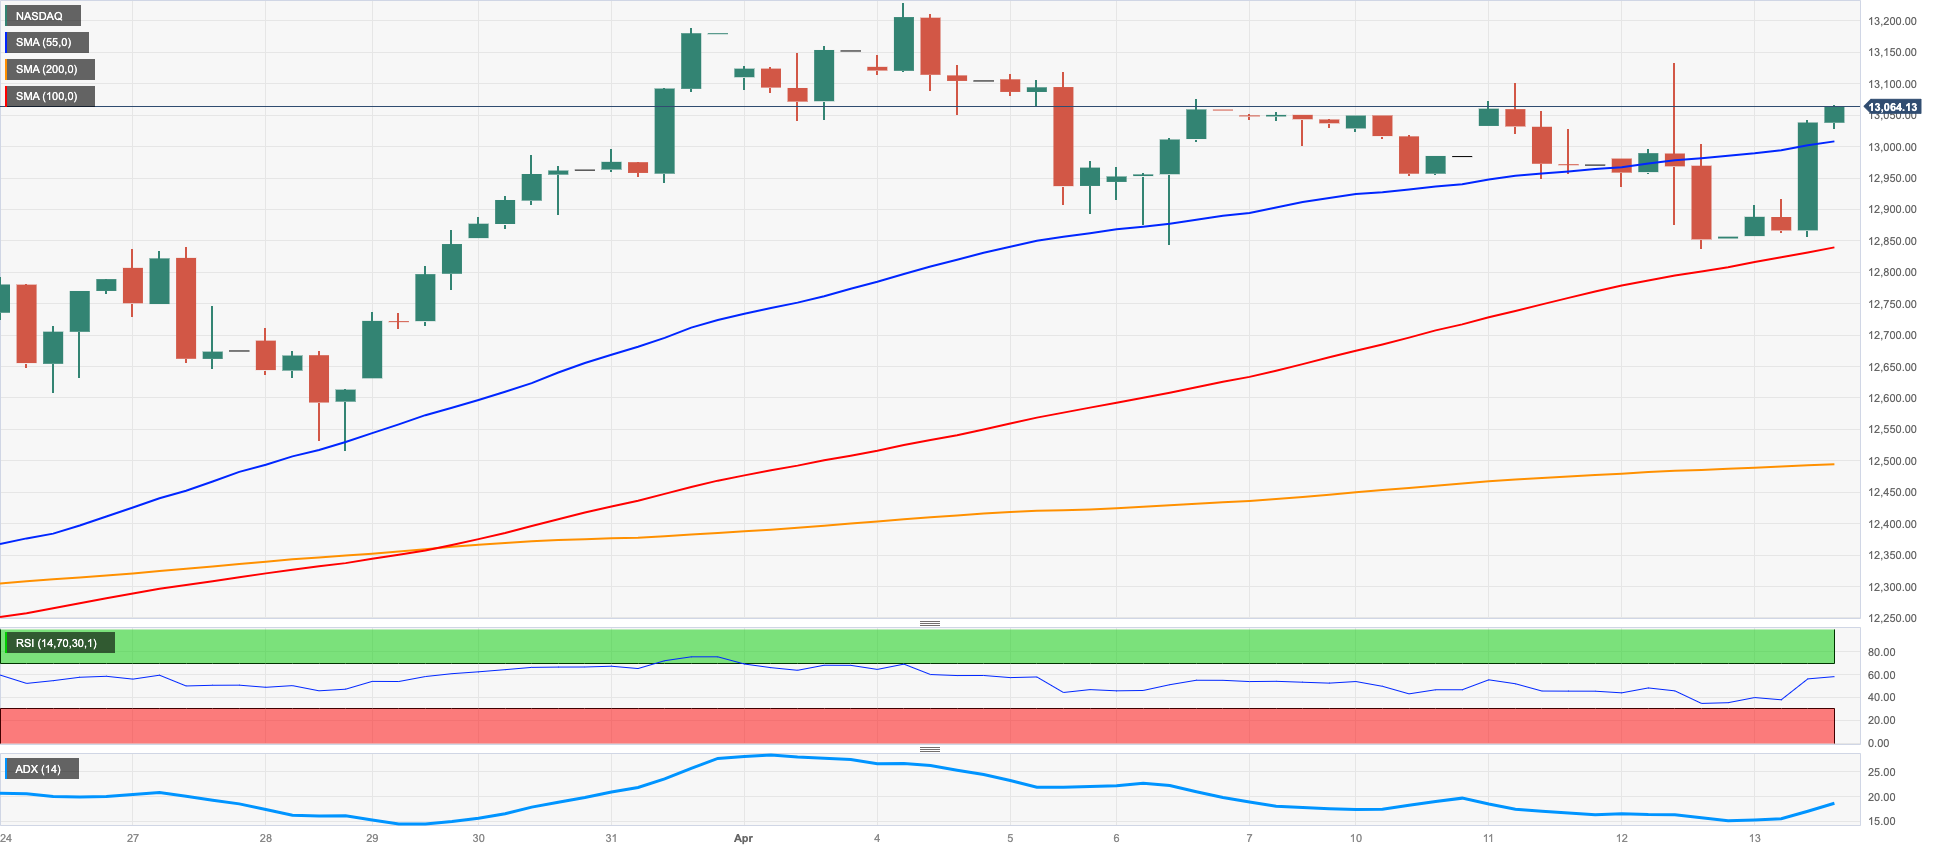
US tech equities measured by the Nasdaq 100 reversed three consecutive sessions with losses and charted decent gains north of the 13000 mark on Thursday.
The intense weakness in the dollar, mixed US yields and investors’ perception that the Fed’s tightening cycle could be approaching its end all boosted the optimism in the risk complex as well as in the tech sector.
The resumption of the uptrend in the Nasdaq 100 needs to clear the 2023 top at 13204 (April 4) to allow for a move to the August 2022 peak at 13720 (August 16) and the round level at 14000. Further gains from here are expected to target the March 2022 peak at 15265 (March 29). By contrast, immediate contention lines up at the April low at 12846 (April 6) seconded by the weekly low at 12517 (March 28) and the temporary 55-day SMA at 12458. Below the latter emerges the key 200-day SMA at 11985 prior to the March low at 11695 (March 13) and weekly lows at 11550 (January 25) and 11251 (January 19), all before the 2023 low at 10696 (January 6). The daily RSI leapt to the boundaries of the 60 area.
Top Gainers: Enphase, Atlassian Corp Plc, Netflix
Top Losers: Fastenal, Old Dominion Freight Line Inc, Exelon
Resistance levels: 13204 13720 14277 (4H chart)
Support levels: 12846 12517 11976 (4H chart)
DOW JONES
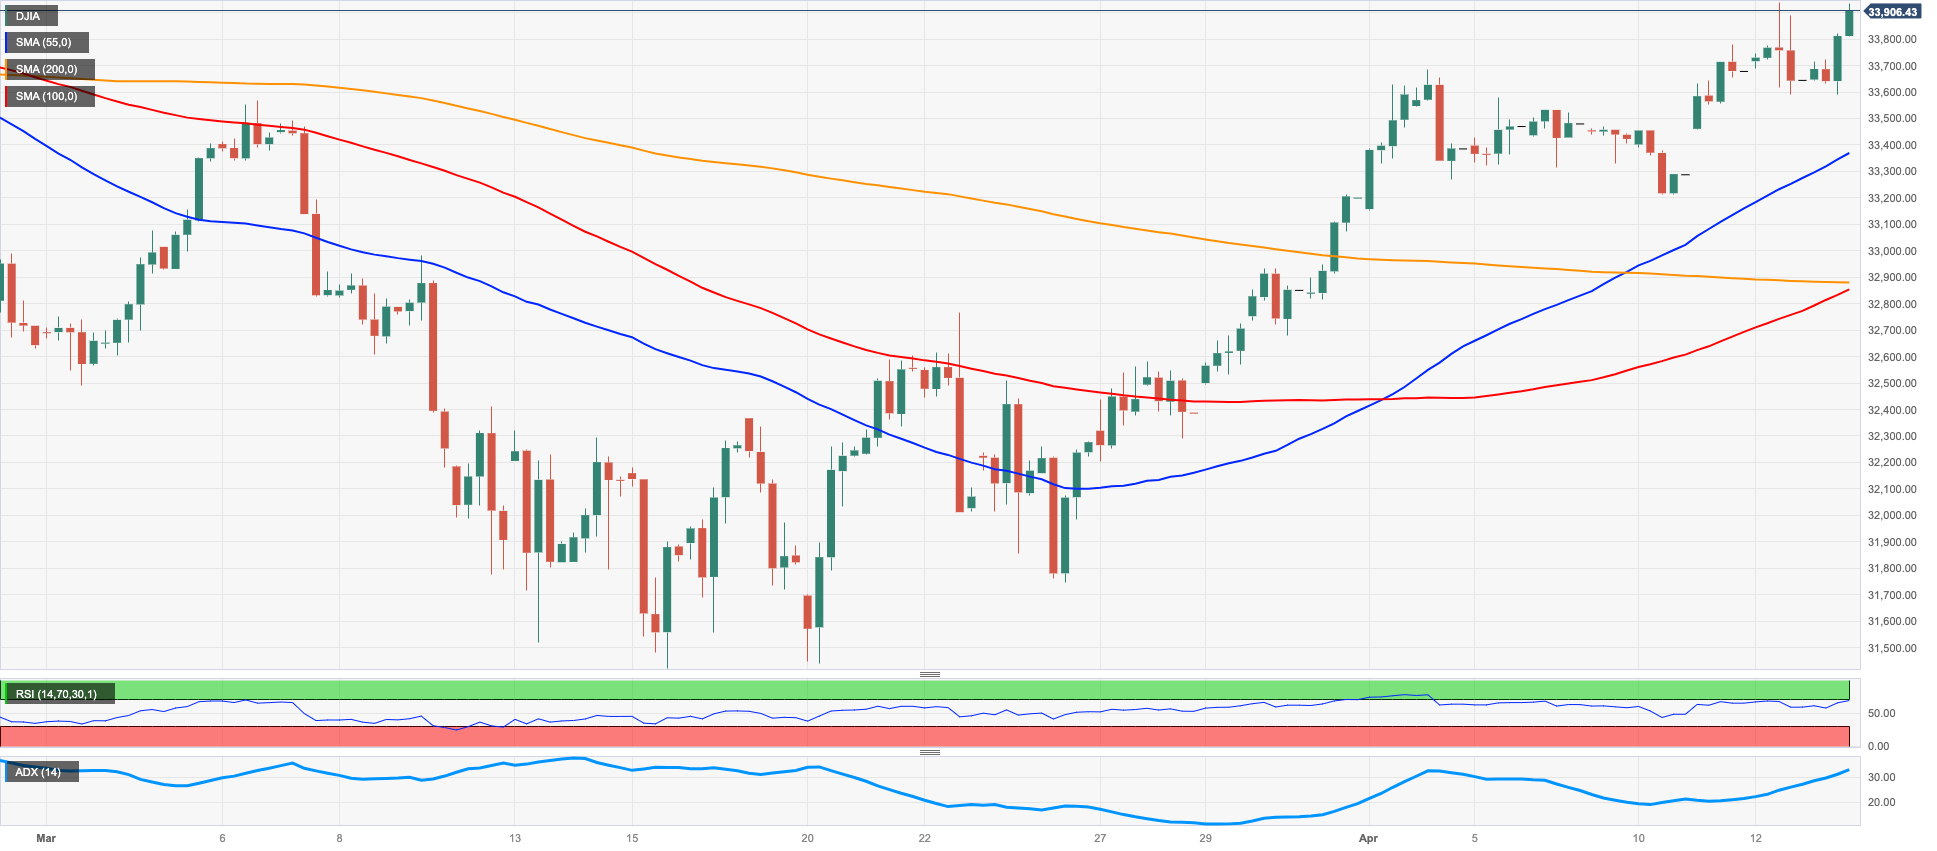
Stocks tracked by the three major US indices traded in an upbeat mood on Thursday, resuming the uptrend in place since mid-March. The Dow, in the meantime, still struggled to retest/surpass the area of recent peaks just below the 34000 mark.
Concerns that the Fed could extend its hiking cycle appeared mitigated after weekly Claims signaled that the labour market could be losing momentum (and tightness could be easing) and Producer Prices unexpectedly came weaker than expected in March (in line with the latest release of US CPI).
On the whole, the Dow Jones rose 0.78% to 33907, the S&P500 advanced 0.99% to 4132 and the tech-heavy Nasdaq Composite gained 1.69% to 12130.
Once the Dow Jones clears the April top at 33895 (April 12) it could embark on a potential visit to the 2023 peak at 34342 (January 13) ahead of the December 2022 high at 34712 (December 13) and the April 2022 top at 35492 (April 21), all ahead of the February 2022 peak at 35824 (February 9). The other way around, there is provisional support at the 55-day SMA at 33175 prior to the 50% Fibo retracement (of the February-March drop) at 32880 seconded by the key 200-day SMA at 32507. The loss of this zone could trigger a deeper drop to the 2023 low at 31429 (March 15) ahead of the 30000 level and the 2022 low at 28660 (October 13). The daily RSI picked up pace and approached the 65 region.
Top Performers: Apple, Walt Disney
Worst Performers: IBM, Travelers, Dow
Resistance levels: 33907 34334 34712 (4H chart)
Support levels: 33354 31805 31429 (4H chart)
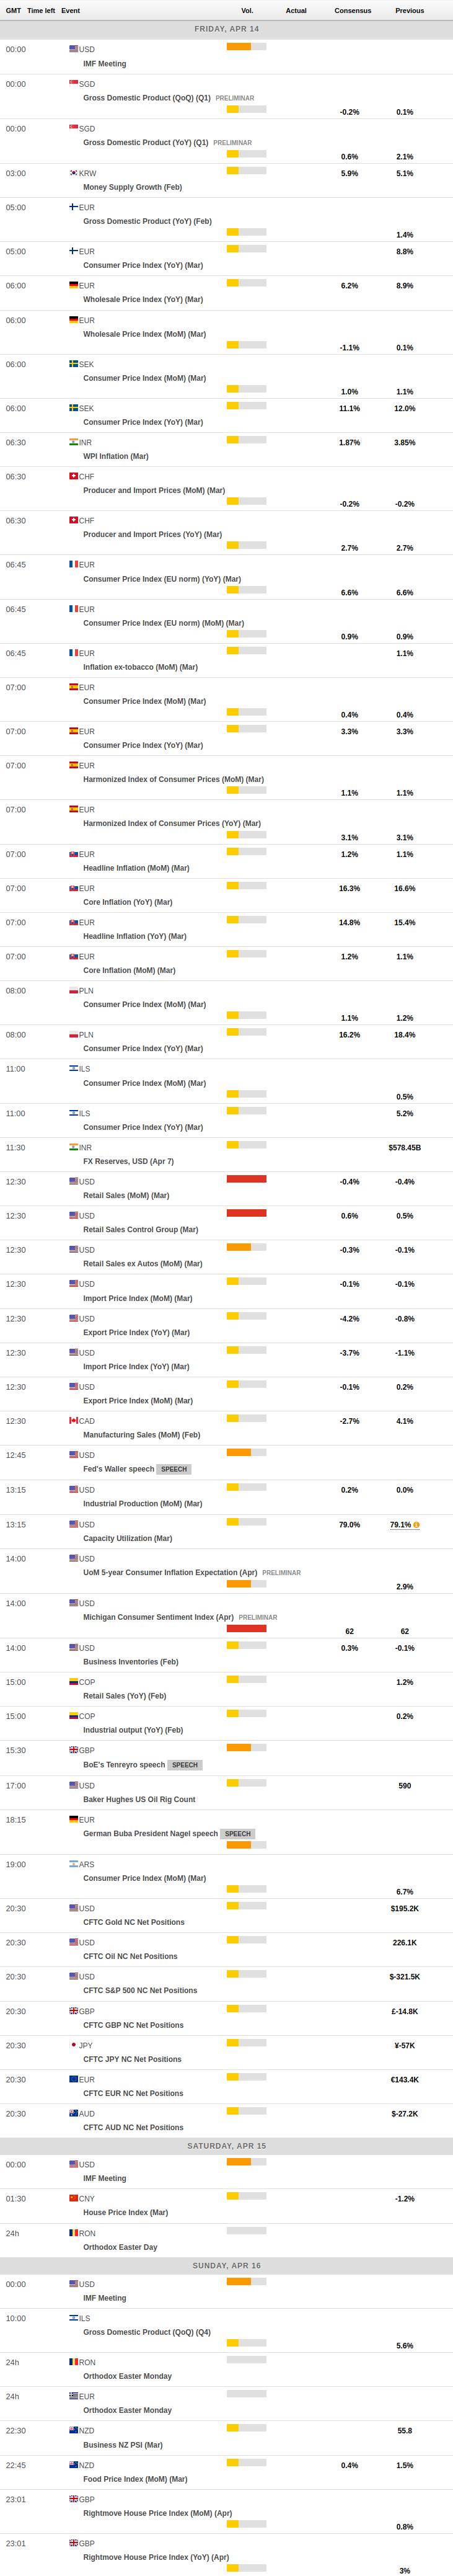
MACROECONOMIC EVENTS
All Information & Updates provided by:

All information relating to the financial markets available on this page has been prepared and issued by FXStreet (Forexstreet SL, Spain, Reg: B62498233) on the basis of publicly available information and all information believed to be reliable and does not conflict with Kuwaiti local laws, and all necessary care has been taken to before the company to ensure that the facts mentioned are correct from the source.
NCM Investment nor any of its directors or employees shall in any way be held responsible for the contents of this news, and the information contained on this page is intended only to provide clients with publicly available information and should not be construed as investment advice, report or analysis and/or constitute an offer or invitation to buy or sell financial instruments of any kind.
RISK WARNING: Forex and CFDs are highly risky leveraged products, as losses can exceed deposits. Please ensure you understand all the risks and take independent advice if necessary. NCM will segregate the clients based on the criteria of the regulator and its bylaws. NCM does not provide any advisory service; the material published does not constitute advice or a recommendation for a transaction in any financial instrument. NCM accepts no responsibility for any use of the content presented and any consequences of that use. Anyone acting on the information provided does so at their own risk.