
- Contact Us:
-

-

-

-


Daily Market Updates
17 Apr 2023
USDJPY
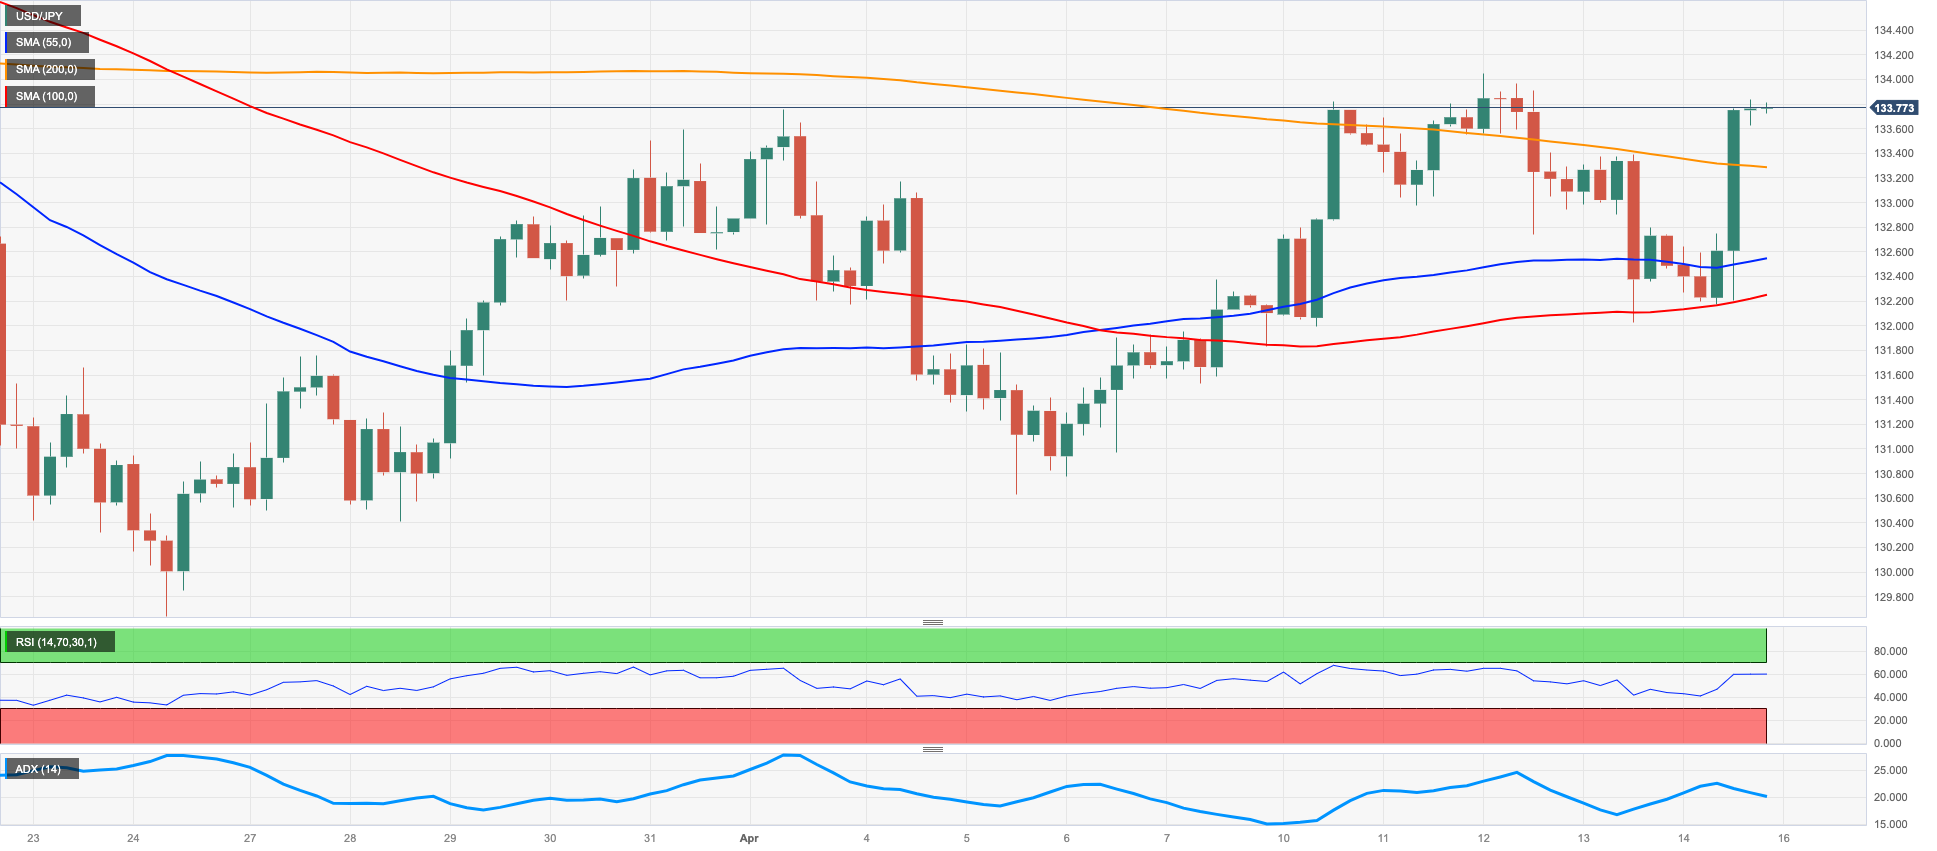
The late and pronounced rebound in the greenback in combination with the equally strong bounce in US yields across the curve encouraged USD/JPY to regain composure and leave behind two consecutive daily drops to close Friday’s session near 133.80.
The sharp reversion of the dollar came in response to results from the US data releases, which at the same time boosted US yields and reaffirmed expectations of a 25 bps rate hike at the Fed’s May gathering.
No news from the domestic money market, where the JGB 10-year yields extended the side-lined fashion around the 0.45% zone.
From the BoJ, Governor K. Ueda suggested that the bank’s base case is not a severe global slowdown, while he added that Japan’s core inflation is likely to fall below 2% in the second half of the current fiscal year.
There were no data releases in the Japanese docket on Friday.
The April top at 134.04 (April 12) remains the next target of note for USD/JPY. Once this level is cleared, spot could edge higher and challenge the key 200-day SMA at 137.14 prior to the 2023 peak at 137.91 (March 8). The surpass of the latter could prompt a probable test of highs at 139.89 (November 30 2022) and 142.25 (November 21 2022) to re-emerge on the horizon. On the other hand, initial contention aligns at the April low at 130.62 (April 5) before the March low at 129.63 (March 24) and the February low at 128.08 (February 2). The breach of this region exposes a potential move to the 2023 low at 127.21 (January 16). The daily RSI leapt to the boundaries of the 55 level.
Resistance levels: 134.04 135.11 136.99 (4H chart)
Support levels: 132.01 131.52 130.62 (4H chart)
GBPUSD
The U-turn in the greenback allowed some breathing space to the USD Index (DXY) and played against the continuation of the rally in the risk-linked galaxy at the end of the week.
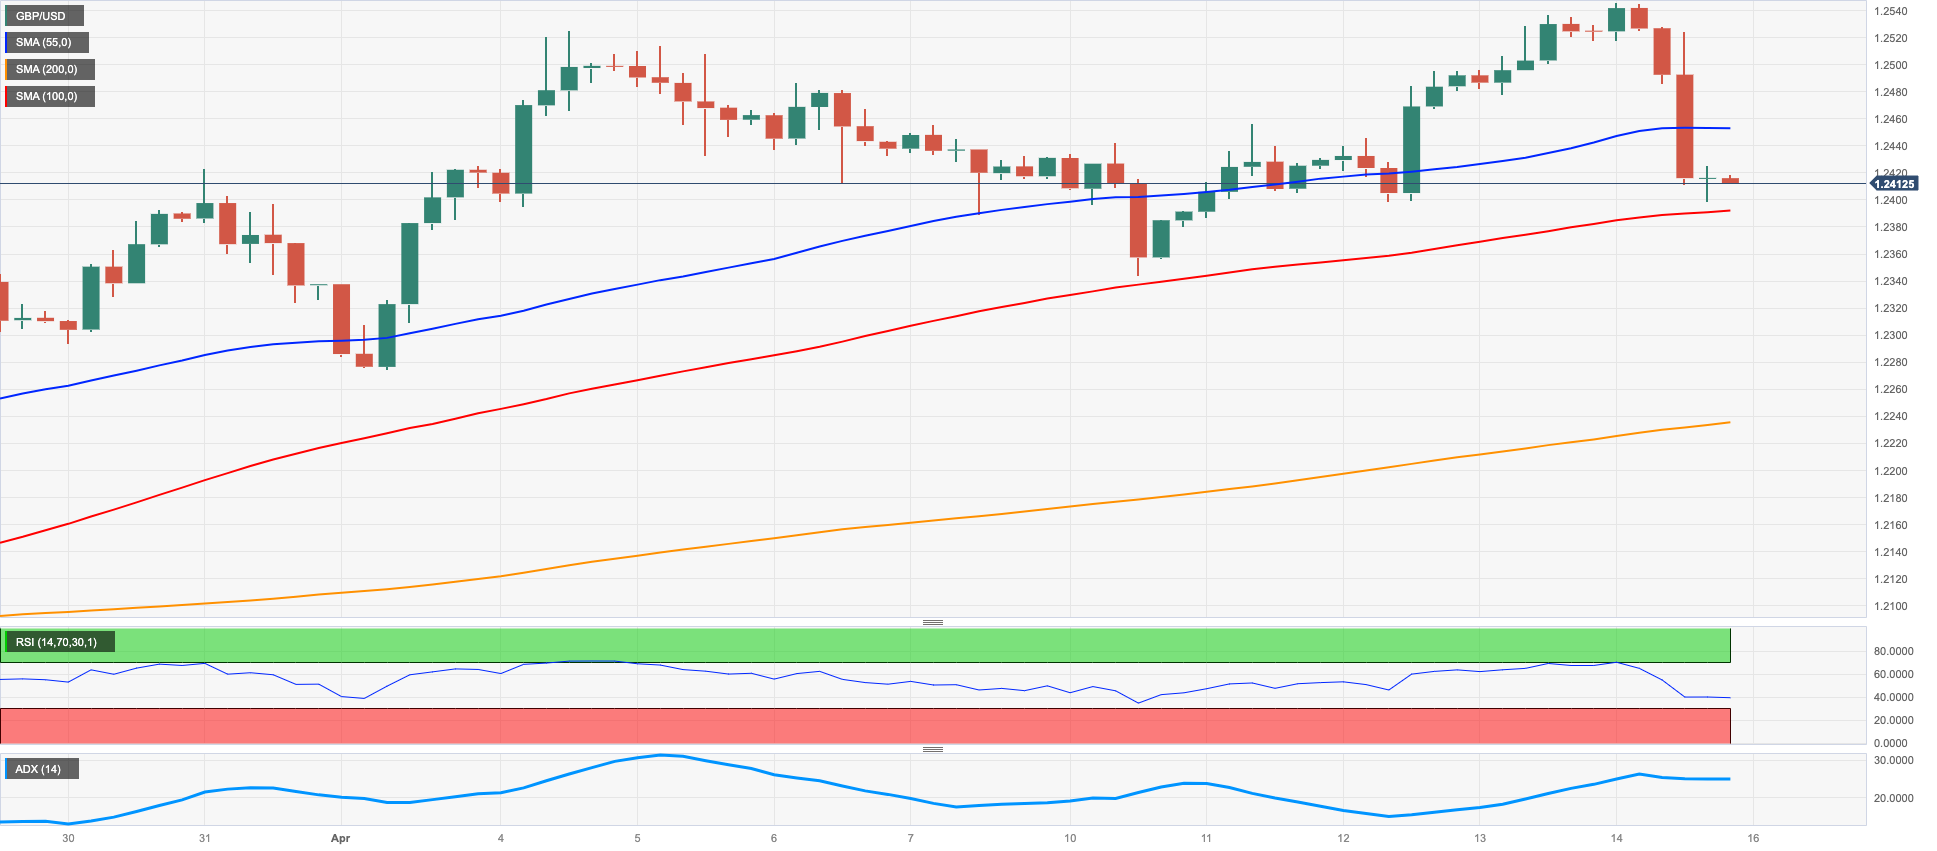
Despite Friday’s acute knee-jerk, GBP/USD managed to close the week with marginal gains and extend the positive streak for the fifth week in a row.
Indeed, the greenback rebounded markedly soon after hitting fresh 2023 lows in the vicinity of 100.80 on Friday, forcing Cable to abandon the area of earlier YTD peaks near 1.2550 and come all the way down to the sub-1.2400 region.
On another front, news from the BoE saw MPC member S. Tenreyro (dove) saying that the full impact of rate raises is yet to be seen and invoked some patience as the bank needs to assess the impact of previous rate hikes on inflation.
GBP/USD faces the immediate resistance level at the 2023 peak at 1.2546 (April 14), while the surpass of this region should lead up to a potential visit to the May 2022 high at 1.2666 (May 27) seconded by the 200-week SMA at 1.2867 and before the psychological 1.3000 yardstick. To the contrary, the immediate contention emerges at the weekly low at 1.2344 (April 10) seconded by the April low at 1.2274 (April 3) and the 1.2180 region, where the interim 55- and 100-day SMAs converge. Further down lines up the key 200-day SMA at 1.1910 ahead of the 2023 low at 1.1802 (March 8). The daily RSI dropped markedly to the proximity of 56.
Resistance levels: 1.2546 1.2599 1.2666 (4H chart)
Support levels: 1.2398 1.2344 1.2274 (4H chart)
AUDUSD
In line with the rest of the risk complex, the Aussie dollar succumbed to the intense and sudden rebound in the dollar on Friday.
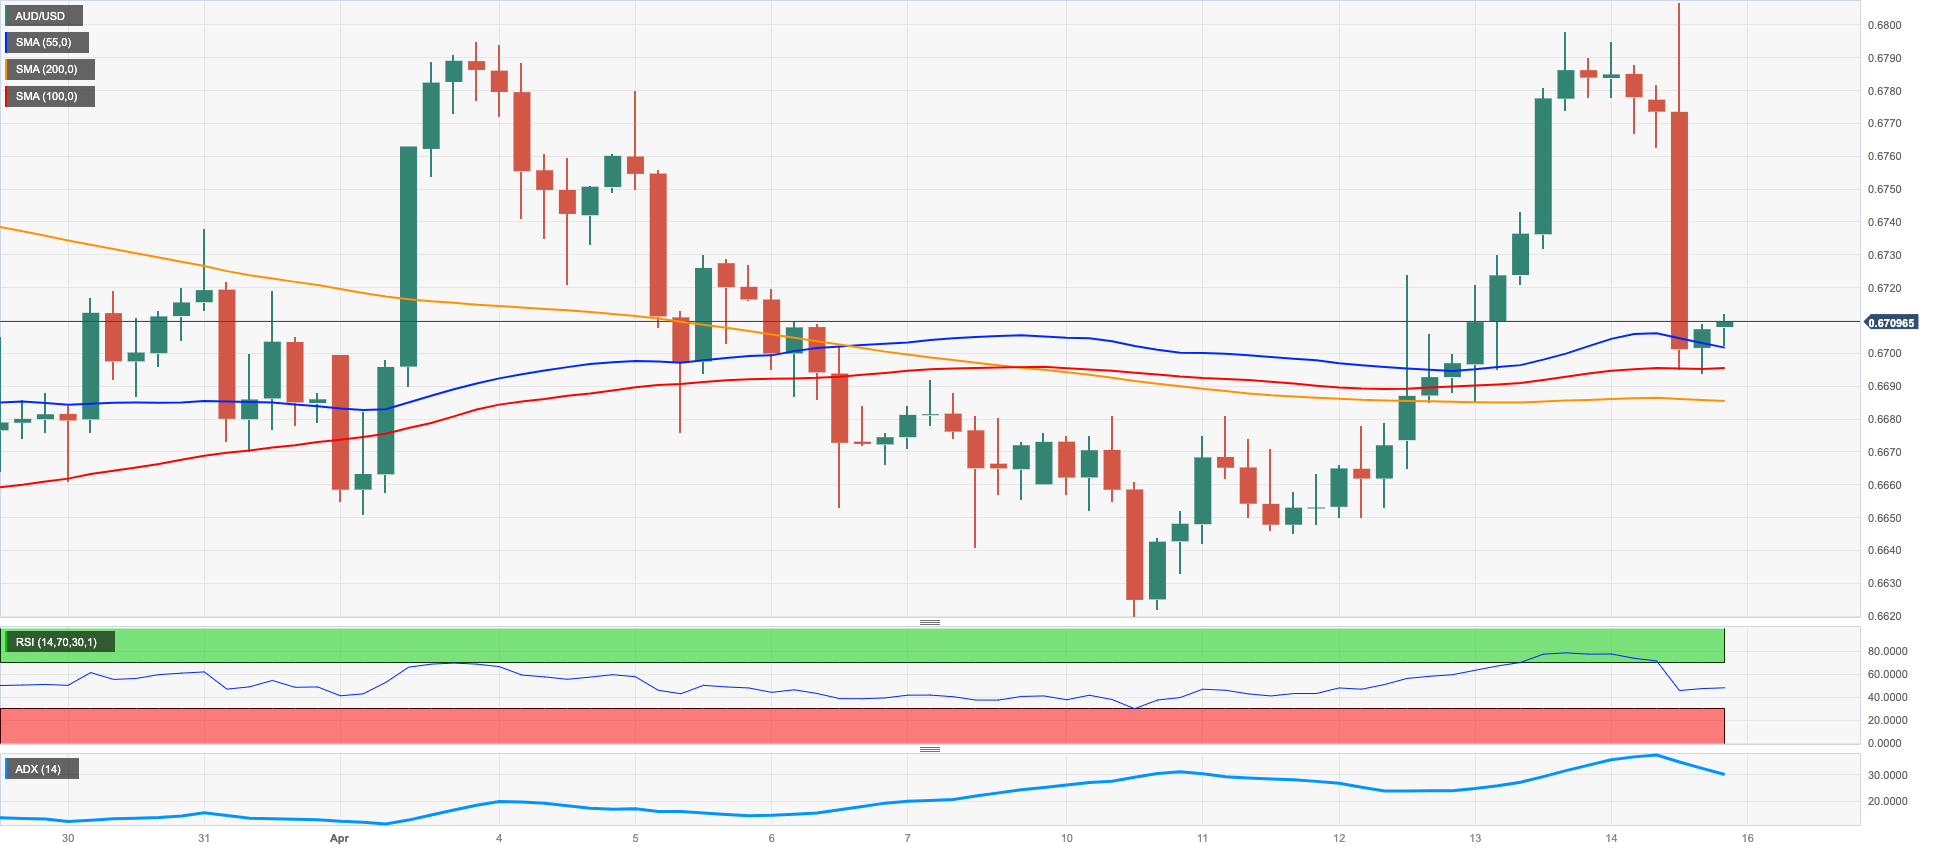
That said, AUD/USD rapidly reversed the advance to monthly peaks just beyond 0.6800 the figure and gave away over a cent to the area just below 0.6700 at the end of the week.
Furthermore, the mixed performance of the commodity complex did not help the AUD either after both copper prices and the iron ore traded slightly on the defensive.
There were no data releases scheduled Down Under on Friday.
If AUD/USD breaks above the April top at 0.6805 (April 14), it could then confront the key round level at 0.7000 ahead of the weekly peak at 0.7029 (February 14) and the 2023 high at 0.7157 (February 2). Instead, the April low at 0.6619 (April 10) is expected to hold the initial test before the 2023 low at 0.6563 (March 10). The breakdown of this level could put the weekly low at 0.6386 (November 10 2022) to the test ahead of the November 2022 low at 0.6272 (November 3). The daily RSI retreated to the 50 region.
Resistance levels: 0.6805 0.6920 0.7029 (4H chart)
Support levels: 0.6686 0.6619 0.6589 (4H chart)
GOLD
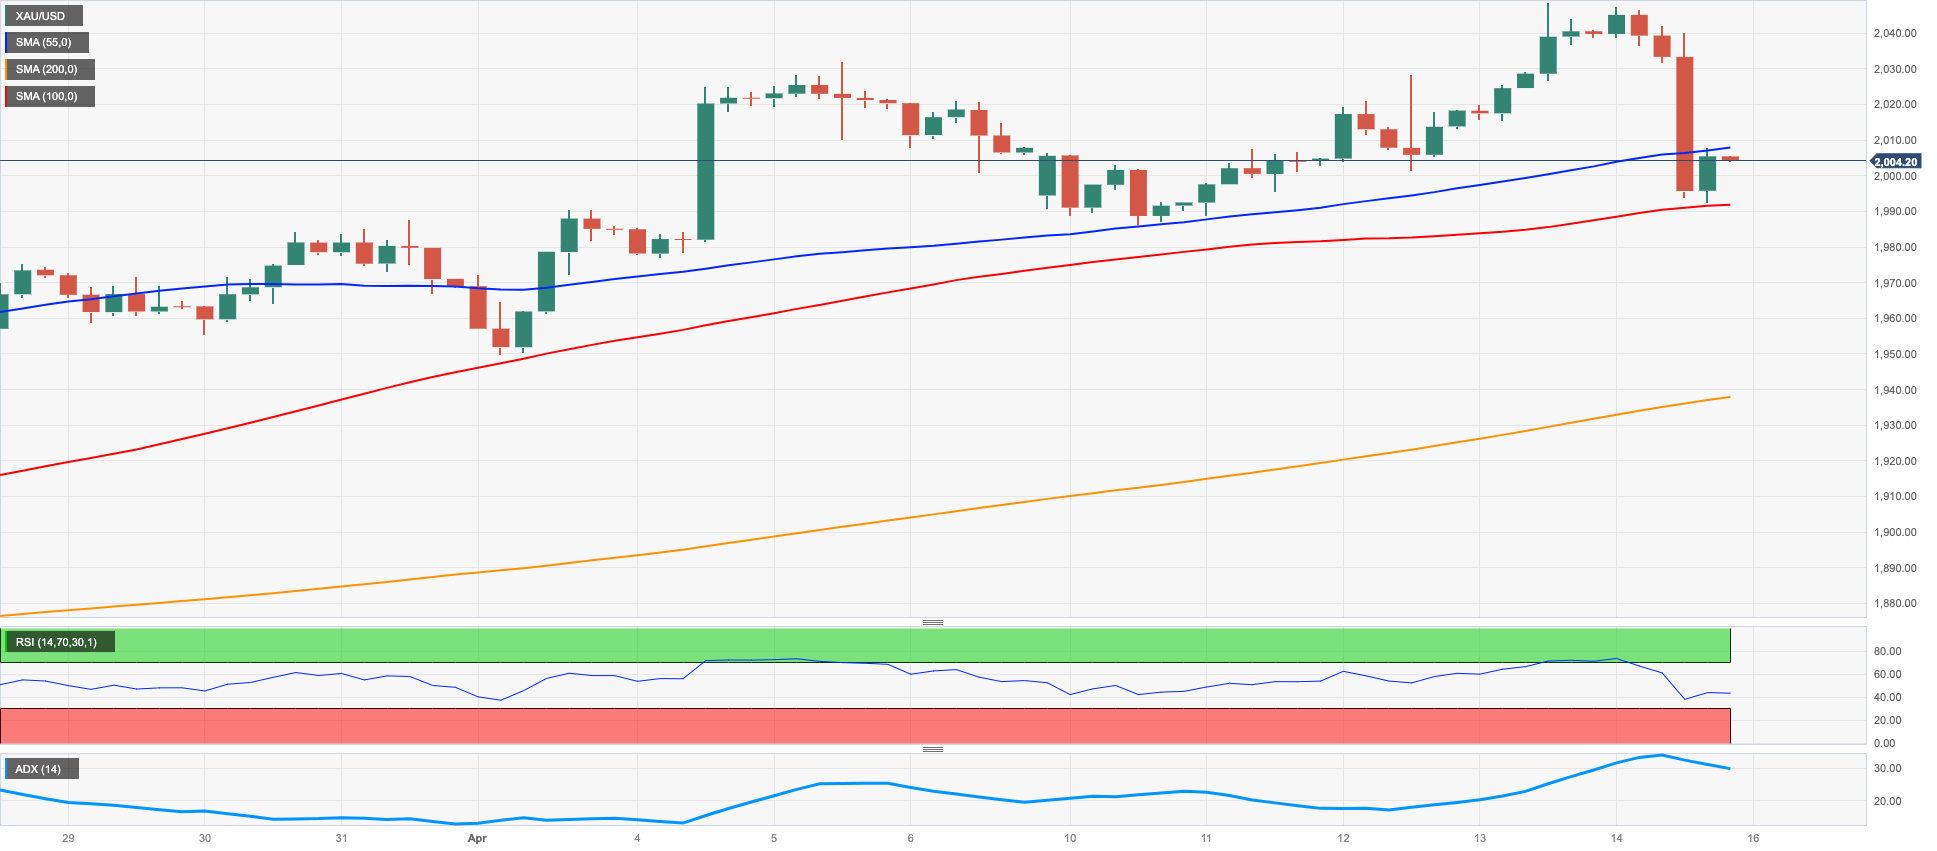
Prices of the ounce troy of the yellow metal dropped to 3-day lows near $1990 before regaining some composure and ending the week just above the key $2000 mark on Friday.
Indeed, bullion reversed three consecutive daily advances and quickly left behind the area of fresh peaks around $2050 in response to the sharp move higher in the greenback, while the strong bounce in US yields across the curve also collaborated with the acute drop in the precious metal at the end of the week.
Despite the corrective decline, the outlook for gold still appears tilted to the upside amidst investors’ increasing conviction that the Fed’s tightening cycle is drawing to an end.
Gold bulls remain focused on the 2023 high at $2048 (April 13). The breakout of this region could pave the way for a potential test of the 2022 top at $2070 (March 8) just before the all-time peak at $2075 (August 7 2020). In opposition, the April low at $1949 (April 3) emerges as a minor support prior to the weekly low at $1934 (March 22). The continuation of the downtrend could revisit provisional support levels at the 55- and 100-day SMAs at $1908 and $1874, respectively, ahead of the March low at $1809 (March 8) and the 2023 low at $1804 (February 28). Down from here, the metal could revisit the key 200-day SMA at $1793.
Resistance levels: $2048 $2070 $2075 (4H chart)
Support levels: $1992 $1981 $1949 (4H chart)
CRUDE WTI
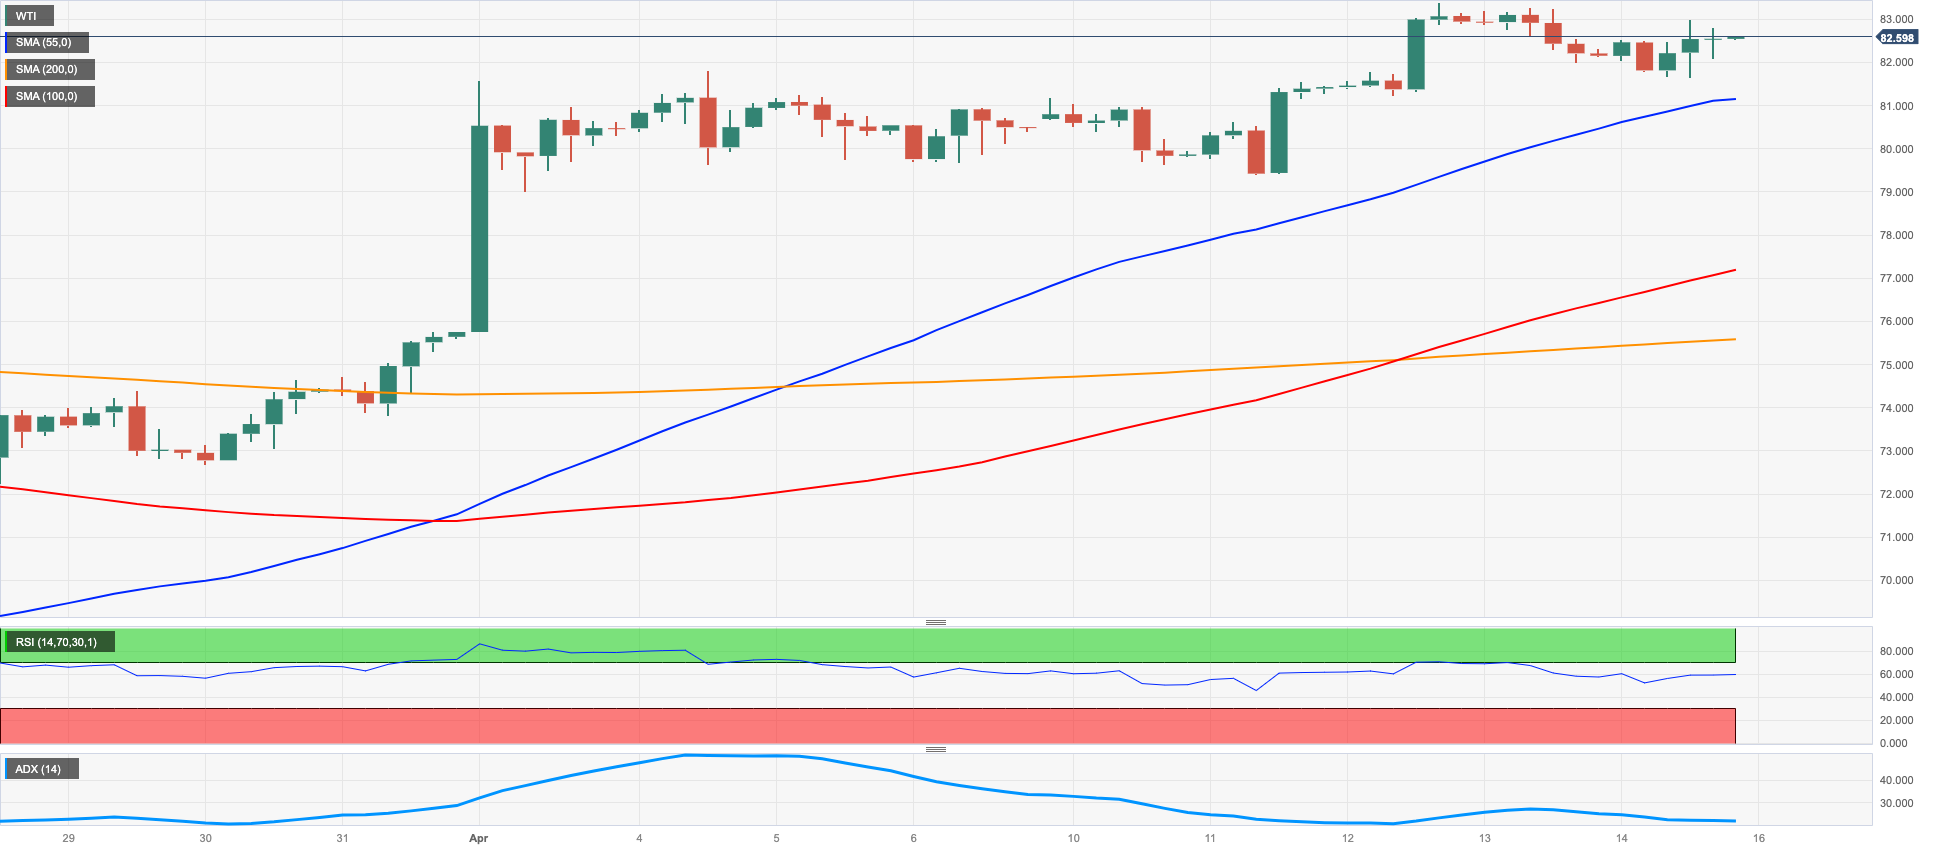
Prices of the barrel of the WTI charted decent gains at the end of the week and settled around the 200-day SMA near the $83.00 zone. The commodity, in the meantime, managed well to extend the rebound for the fourth consecutive week.
In fact, crude oil prices rose on Friday on the back of auspicious projections from the monthly report of the Paris-based IEA. According to this, recent OPEC+ cuts will tighten the global oil supply by around 400 kbpd by year end and could lift prices of both crude and oil products. The agency also expects the oil output to increase 1.2 mbpd this year and global demand to expand by 2 mbpd mainly in response to the Chinese recovery.
Also collaborating with the upbeat tone in the WTI, driller Baker Hughes said the total US active oil rigs went down by 2 to 588 in the week to April 14, the lowest level since June 2022.
The 2023 top at $83.49 (April 12) appears so far reinforced by the key 200-day SMA at $83.04. Against that, further upside in the WTI needs to clear this zone to allow for the continuation of the uptrend to test the November 2022 peak at $93.73 (November 7). Just the opposite, the April low at $79.05 (April 3) still emerges as the initial support ahead of the provisional 100- and 55-day SMAs at $76.76 and $76.16, respectively. Further south emerges the $66.86 level (March 24) prior to the 2023 low at $64.41 (March 20) and the December 2021 low at $62.46 (December 2).
Resistance levels: $83.49 $88.65 $90.08 (4H chart)
Support levels: $81.72 $79.35 $78.97 (4H chart)
GER40
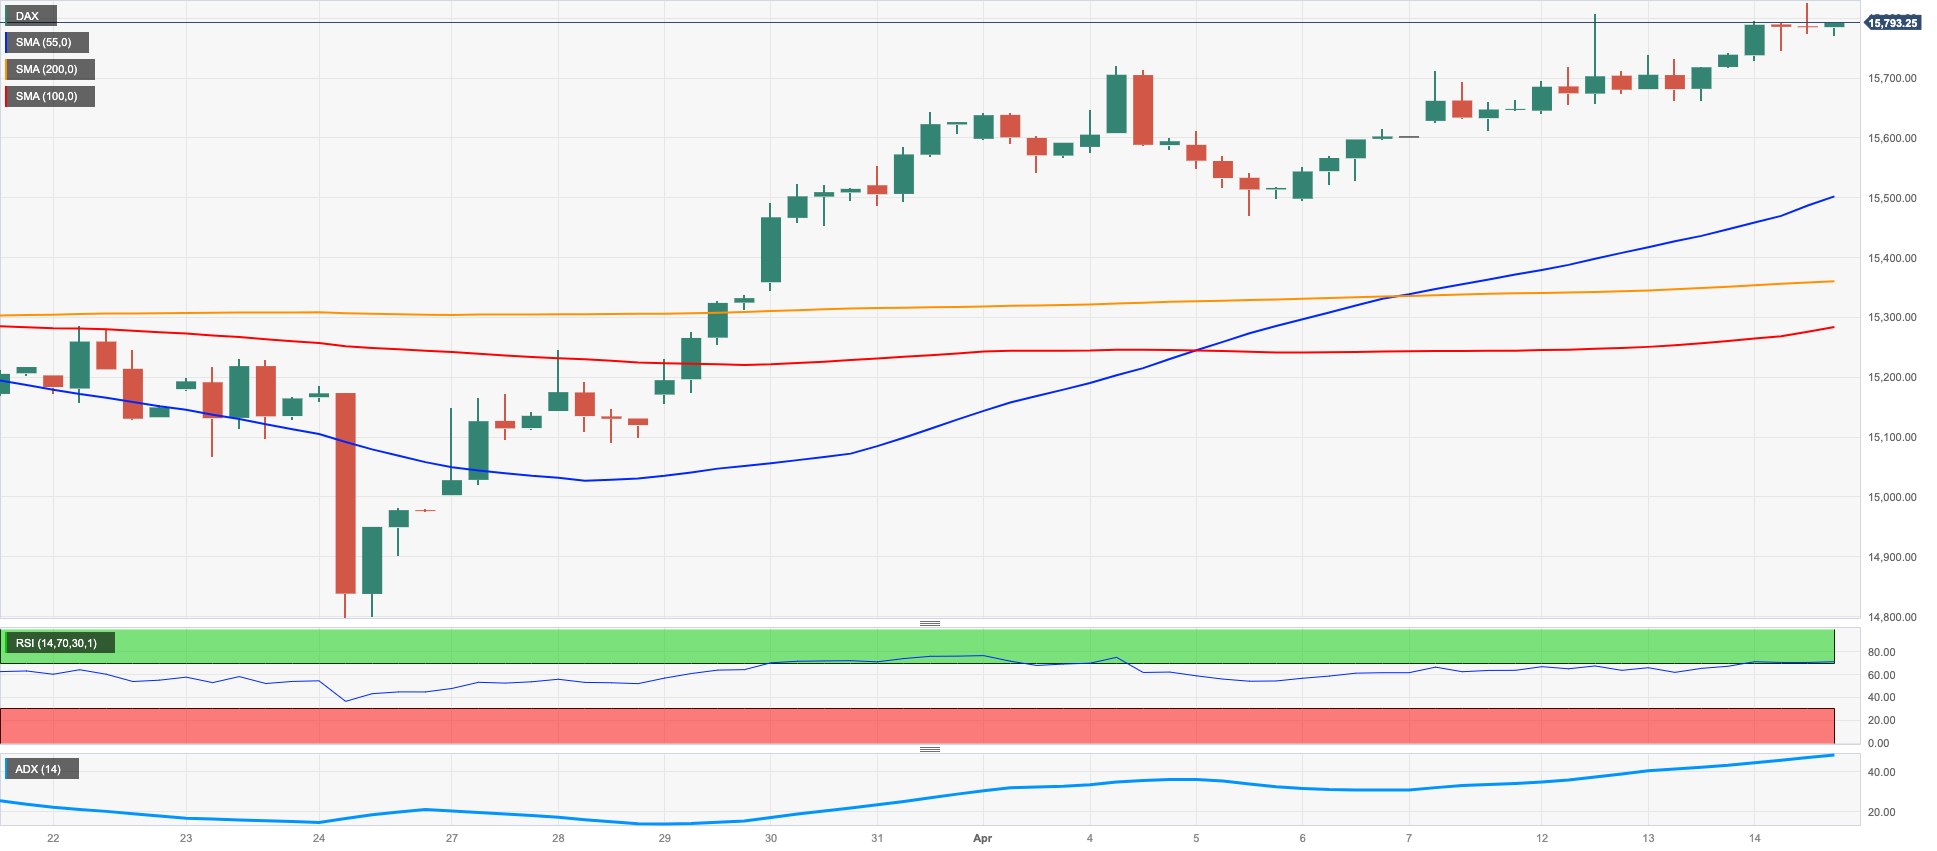
German stocks tracked by the DAX40 gradually approached the key 16000 barrier on Friday. Indeed, the German benchmark rose in every session of the week boosted by the broad-based improvement in the appetite for the risk complex.
The banking sector led the way up for the rest of assets on Friday and this trend was supported further later in the session following better-than-expected results from US big lenders.
While expectations for further tightening by the ECB and the Federal Reserve in May continued to reaffirm, yields on both sides of the Atlantic extended the march north to new multi-session peaks.
In the German docket, Wholesale Prices rose 0.2% MoM in March and 2.0% over the last twelve months.
The DAX40 clinched a new 2023 top at 15841 (April 14). Further up from here comes the round level at 16000 ahead of the 2022 high at 16285 (January 5). The other way around, there is a minor support at the April low at 15482 (April 5) prior to the provisional 55- and 100-day SMAs at 15361 and 14962, respectively. The loss of this regions exposes the minor support at 14809 (March 24) before the March low at 14458 (March 20) and the key 200-day SMA at 14042. The daily RSI advanced past the 63 level.
Best Performers: Commerzbank, Deutsche Bank AG, Continental AG
Worst Performers: Deutsche Boerse, MTU Aero, Siemens Healthineers
Resistance levels: 15841 15912 16090 (4H chart)
Support levels: 15482 15305 14809 (4H chart)
NASDAQ
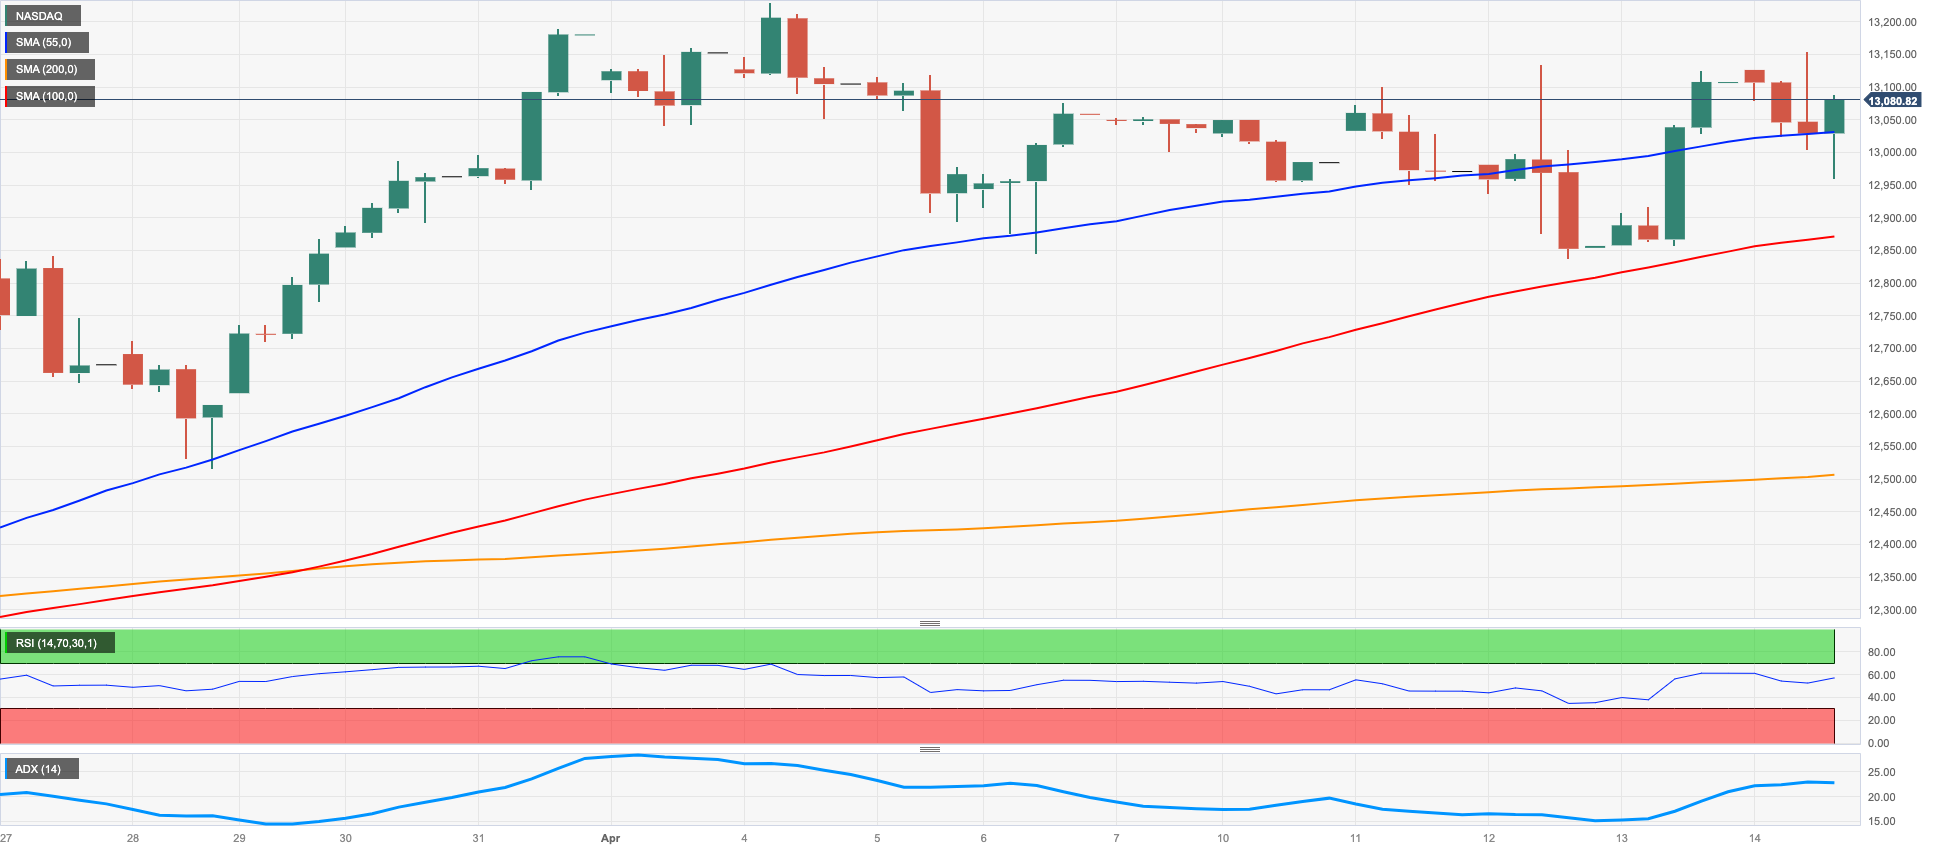
In line with the rest of their US peers, tech equities drifted lower at the end of the week, although the reference index Nasdaq 100 managed well to keep business above the 13000 mark.
Thursday’s strong performance on the Nasdaq 100, in the meantime, was enough to reverse the previous weekly decline and allow the tech sector to end this week in the positive territory.
The sharp U-turn in the dollar and higher US yields across the curve, all amidst rising jitters of further hiking by the Fed, weighed on the sentiment and triggered the knee-jerk in stocks, which was also underpinned by some profit taking (following the above-mentioned strong gains in the previous session).
In case bulls regain the upper hand, the Nasdaq 100 continues to initially target the 2023 peak at 13204 (April 4) followed by the August 2022 high at 13720 (August 16) and the round level at 14000. North from here, the index could dispute the March 2022 high at 15265 (March 29). On the opposite side, the April low at 12846 (April 6) emerges as the initial contention prior to the weekly low at 12517 (March 28) and the interim 55-day SMA at 12482. The breach of this region could spark a deeper drop to the key 200-day SMA at 11993 before the March low at 11695 (March 13) and weekly lows at 11550 (January 25) and 11251 (January 19), all ahead of the 2023 low at 10696 (January 6). The daily RSI lost composure and flirted with the 60 area.
Top Gainers: Fastenal, Old Dominion Freight Line Inc, PACCAR
Top Losers: Rivian Automotive, Lucid Group, Sirius XM
Resistance levels: 13204 13720 14277 (4H chart)
Support levels: 12833 12517 11996 (4H chart)
DOW JONES
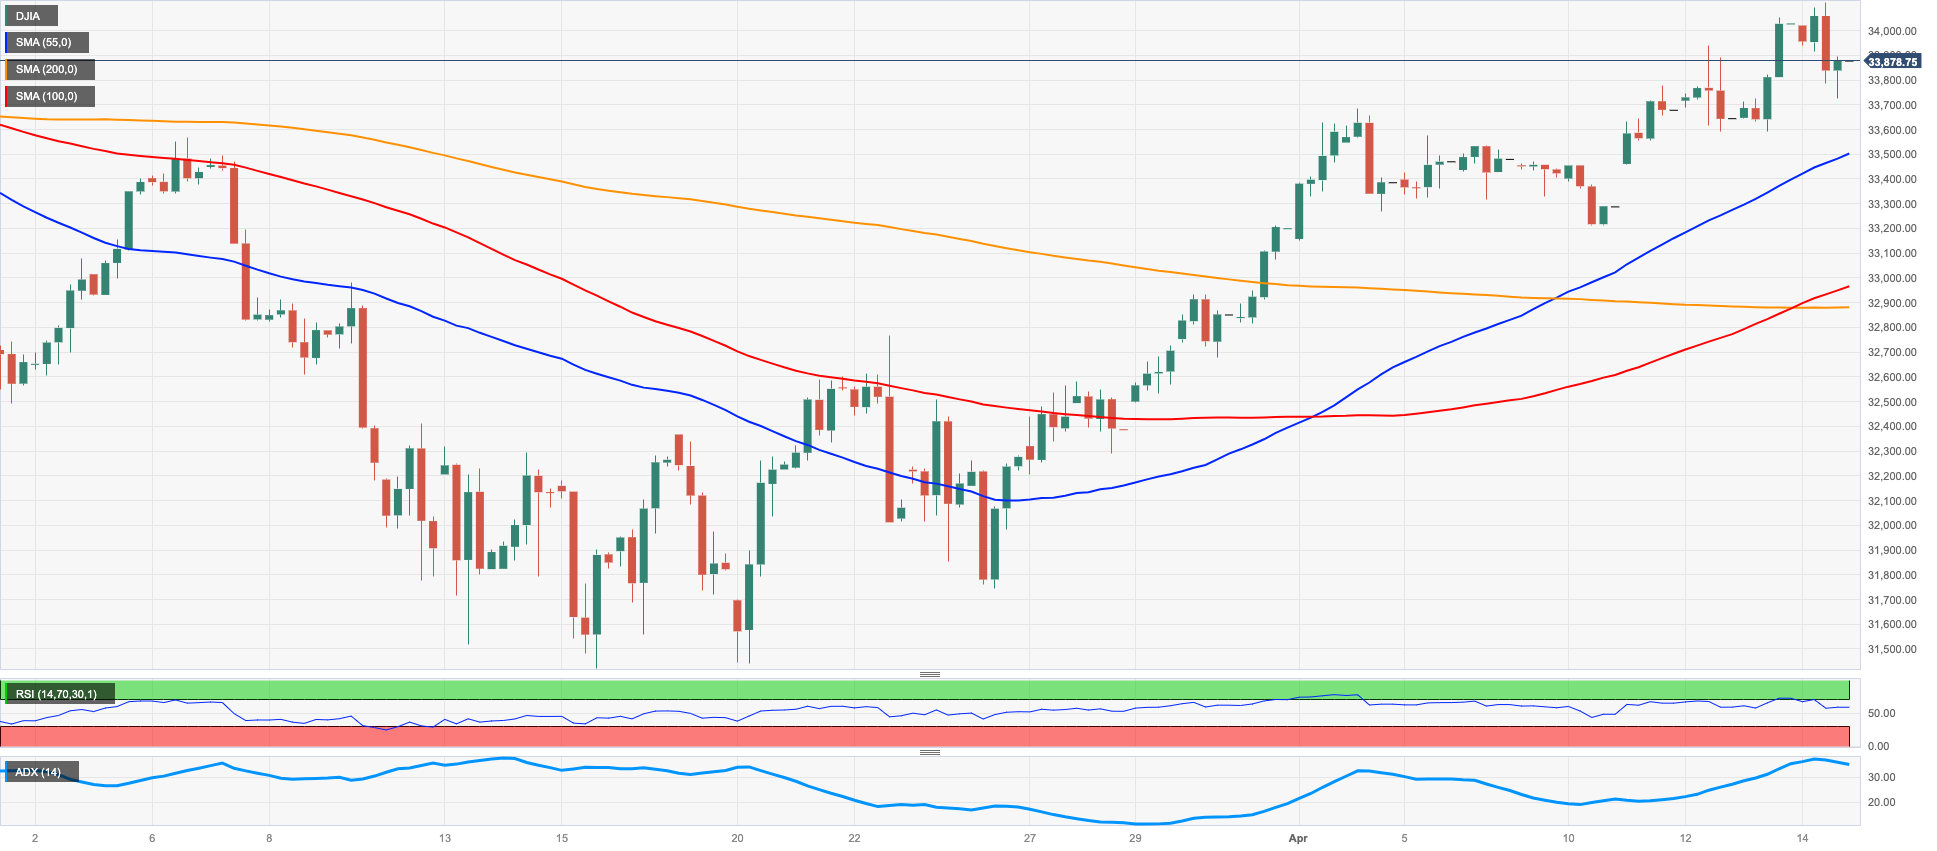
Equities tracked by the three major US stock indices traded on the defensive on Friday, although they kept the weekly positive mood in place. Furthermore, both the Dow Jones and the S&P500 extended the weekly gains for the fifth week in a row at the same time.
Indeed, stocks slipped back to the negative territory on Friday following renewed jitters around further tightening by the Federal Reserve, which were once again underpinned by hawkish comments from Fed’s policy makers.
Rate concerns, in addition, eclipsed the initial optimism in response to auspicious earnings reports by big US banks, while the rebound in the dollar and higher yields also weighed on traders’ sentiment later in the NA session.
On this, FedWatch Tool measured by CME Group sees the probability of a 25% rate raise in May hovering around 80%.
All in all, the Dow Jones dropped 0.42% to 33886, the S&P500 deflated 0.21% to 4137 and the tech-benchmark Nasdaq Composite retreated 0.35% to 12123.
Next on the upside for the Dow Jones appears the April peak at 34082 (April 14). Beyond this level, the index is expected to confront the 2023 high at 34342 (January 13) before the December 2022 top at 34712 (December 13). Further gains could then see the April 2022 peak at 35492 (April 21) revisited prior to the February 2022 high at 35824 (February 9). On the contrary, the 100- and 55-day SMAs at 33378 and 33181 are seen offering provisional contention ahead of the 50% Fibo retracement (of the February-March drop) at 32880 and the key 200-day SMA at 32523. A drop below this region could pave the way for a test of the 2023 low at 31429 (March 15) before the 30000 level and the 2022 low at 28660 (October 13). The daily RSI ticked lower and approached 63.
Top Performers: JPMorgan, Goldman Sachs, Caterpillar
Worst Performers: Boeing, Travelers, UnitedHealth
Resistance levels: 34082 34334 34712 (4H chart)
Support levels: 33359 31805 31429 (4H chart)
MACROECONOMIC EVENTS

All Information & Updates provided by:

All information relating to the financial markets available on this page has been prepared and issued by FXStreet (Forexstreet SL, Spain, Reg: B62498233) on the basis of publicly available information and all information believed to be reliable and does not conflict with Kuwaiti local laws, and all necessary care has been taken to before the company to ensure that the facts mentioned are correct from the source.
NCM Investment nor any of its directors or employees shall in any way be held responsible for the contents of this news, and the information contained on this page is intended only to provide clients with publicly available information and should not be construed as investment advice, report or analysis and/or constitute an offer or invitation to buy or sell financial instruments of any kind.
RISK WARNING: Forex and CFDs are highly risky leveraged products, as losses can exceed deposits. Please ensure you understand all the risks and take independent advice if necessary. NCM will segregate the clients based on the criteria of the regulator and its bylaws. NCM does not provide any advisory service; the material published does not constitute advice or a recommendation for a transaction in any financial instrument. NCM accepts no responsibility for any use of the content presented and any consequences of that use. Anyone acting on the information provided does so at their own risk.