
- Contact Us:
-

-

-

-


Daily Market Updates
18 Apr 2023
USDJPY
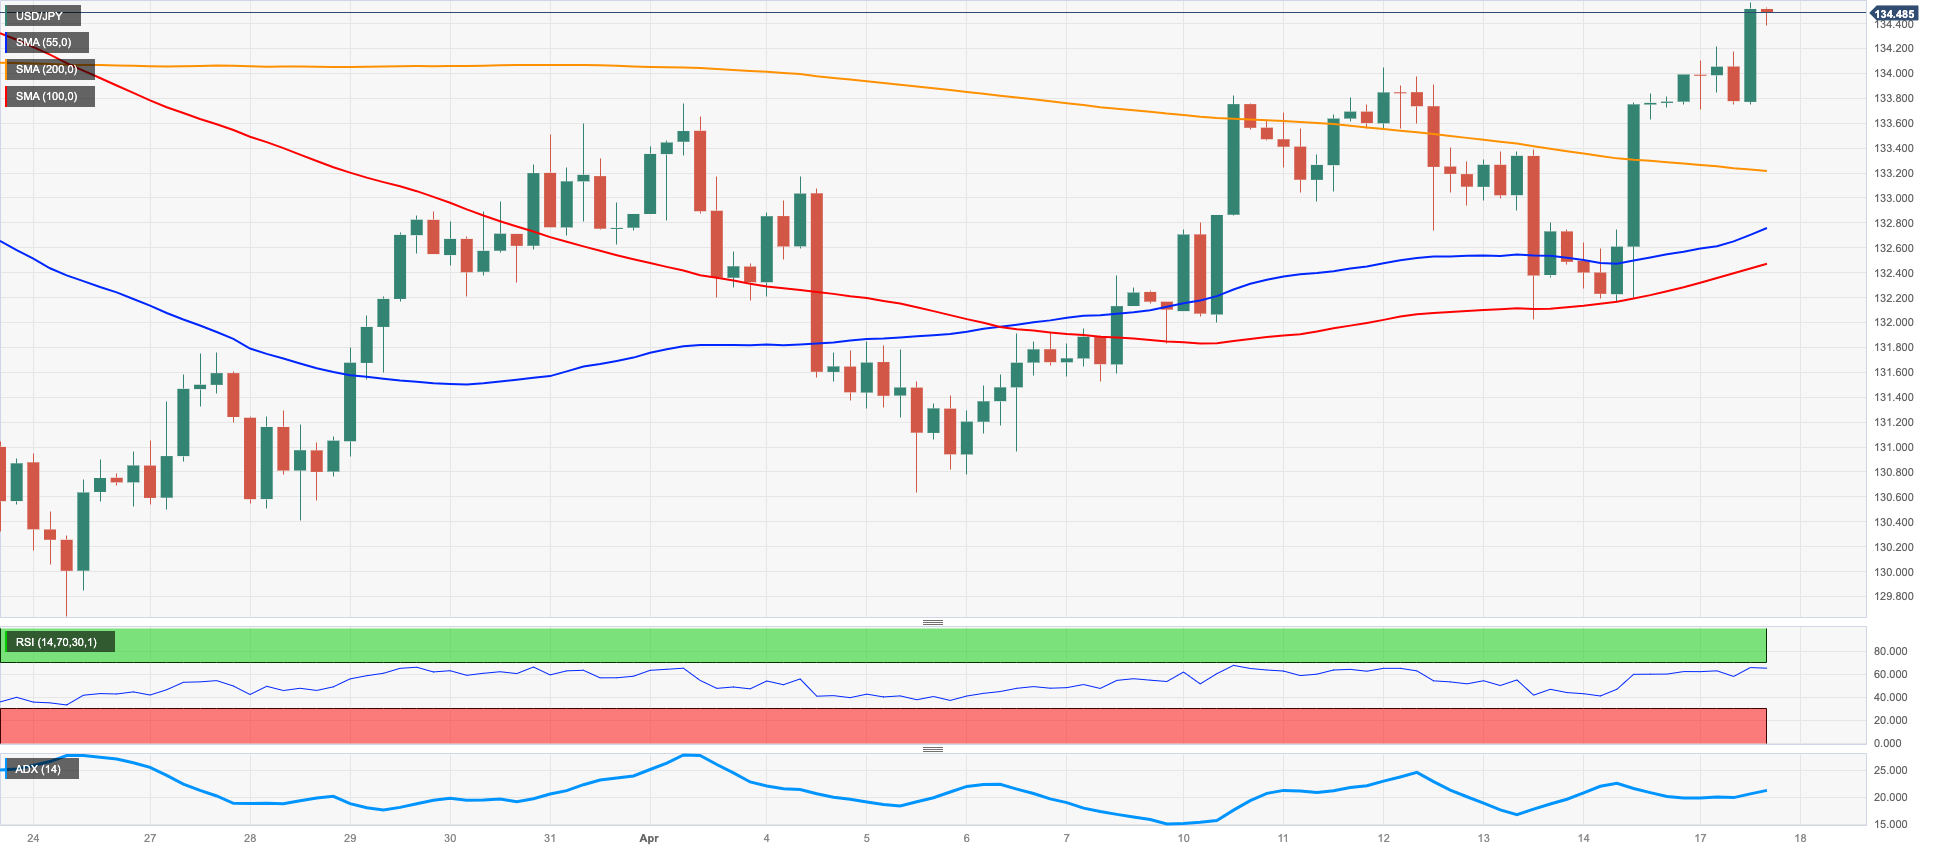
The strong upside bias in the greenback in combination with the equally solid bounce in US yields across the curve sponsored the move higher in USD/JPY to new 5-week tops near 134.60 on Monday.
Indeed, the pair’s promising start of the new trading week was accompanied by multi-day peaks in the USD Index (DXY), while US yields rose to an area last traded around mid-March.
In the same line, the JGB 10-year yields flirted with the key 0.50% region, also in multi-week highs.
The next data releases in the Japanese docket will be the Reuters Tankan Index and Industrial Production figures, all due on April 19.
Next on the upside for USD/JPY emerges the April peak at 134.57 (April 17). The breakout of this level could pave the way for a potential visit to the key 200-day SMA at 137.12 ahead of the 2023 high at 137.91 (March 8) seconded by weekly tops at 139.89 (November 30 2022) and 142.25 (November 21 2022). To the contrary, there is an immediate support at the April low at 130.62 (April 5) ahead of the March low at 129.63 (March 24) and the February low at 128.08 (February 2). Once the latter is breached, spot could head towards the 2023 low at 127.21 (January 16). The daily RSI climbed past the 58 hurdle.
Resistance levels: 134.57 135.11 136.99 (4H chart)
Support levels: 133.33 132.01 131.52 (4H chart)
GBPUSD
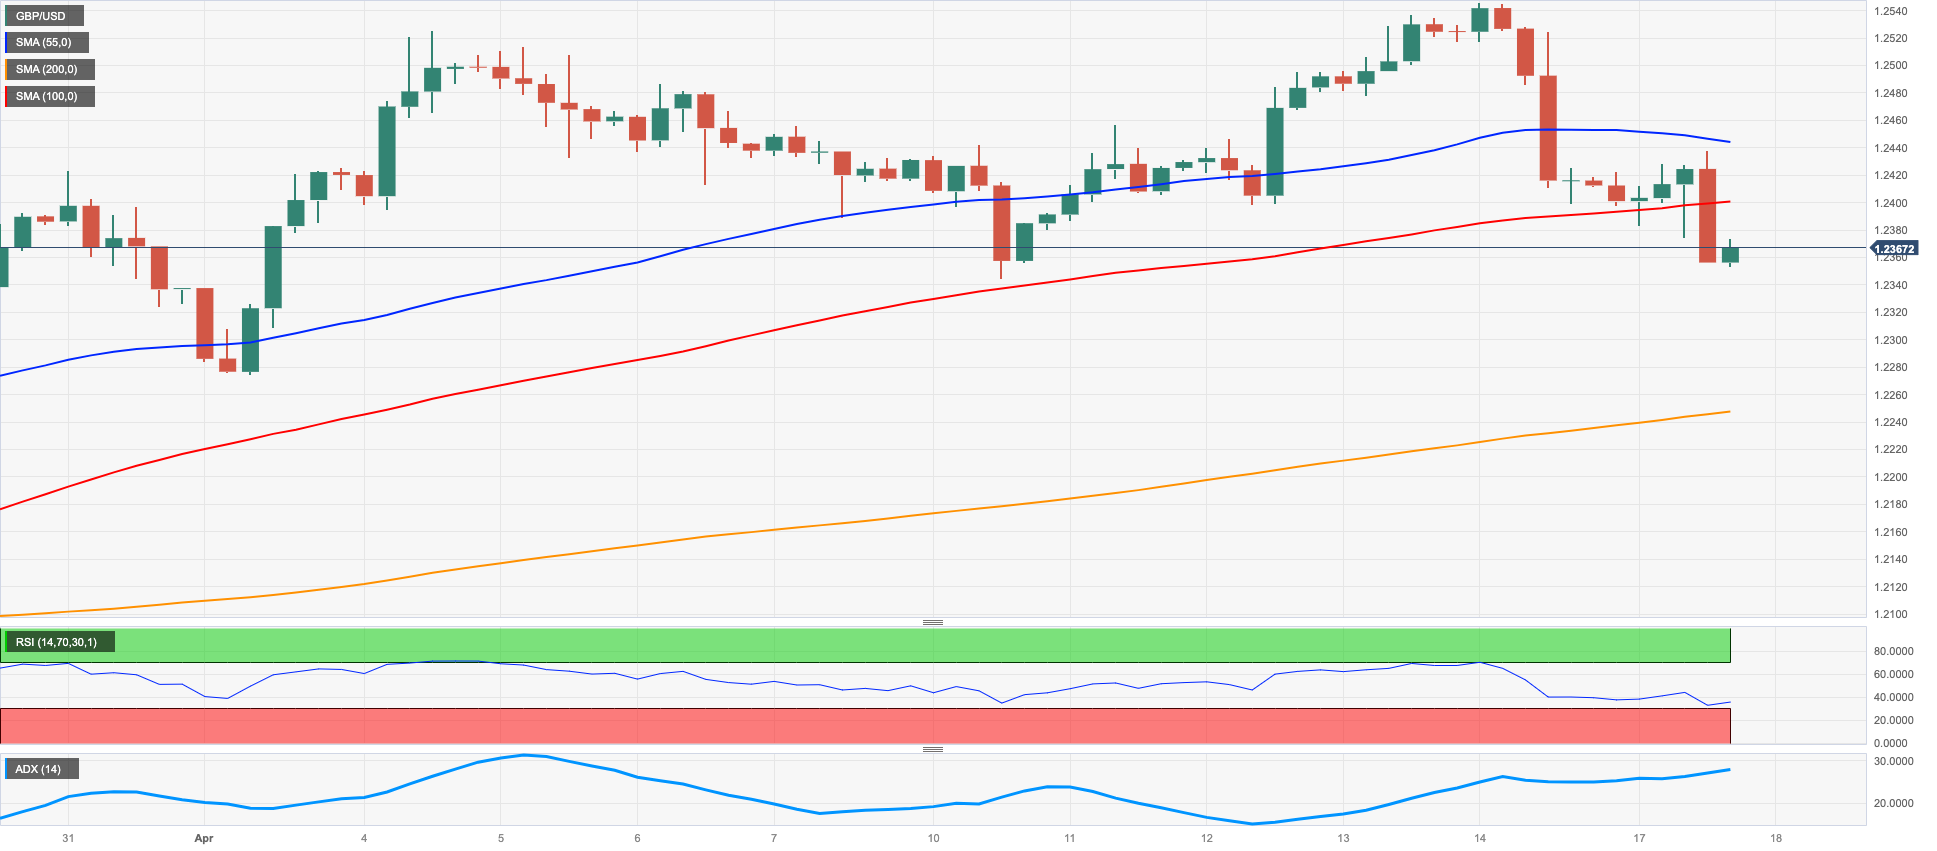
In line with the broad-based bearishness in the risk-linked galaxy, GBP/USD added to Friday’s retracement and probed the area of multi-day lows in the 1.2355/50 band at the beginning of a new trading week.
Indeed, the persistent bid bias in the greenback prompted sellers to remain in control of the British pound on Monday, depressing Cable well south of the 1.2400 support despite the advance to multi-week peaks in the UK 10-year Gilt yields.
Absent releases in the UK calendar on Monday left all the attention to the publication of the always relevant jobs report on Tuesday.
Immediately to the downside for GBP/USD now comes the weekly low at 1.2344 (April 10) prior to the April low at 1.2274 (April 3) and the 1.2180 zone, home of the temporary 55- and 100-day SMAs. The breach of this region could put the pair en route to a probable visit to the key 200-day SMA at 1.1913 followed by the 2023 low at 1.1802 (March 8). By contrast, the next barrier aligns at the 2023 high at 1.2546 (April 14) seconded by the May 2022 top at 1.2666 (May 27). Up from here emerges the 200-week SMA at 1.2865 ahead of the psychological 1.3000 mark. The daily RSI extended the drop to the sub-53 area.
Resistance levels: 1.2438 1.2546 1.2599 (4H chart)
Support levels: 1.2353 1.2344 1.2274 (4H chart)
AUDUSD
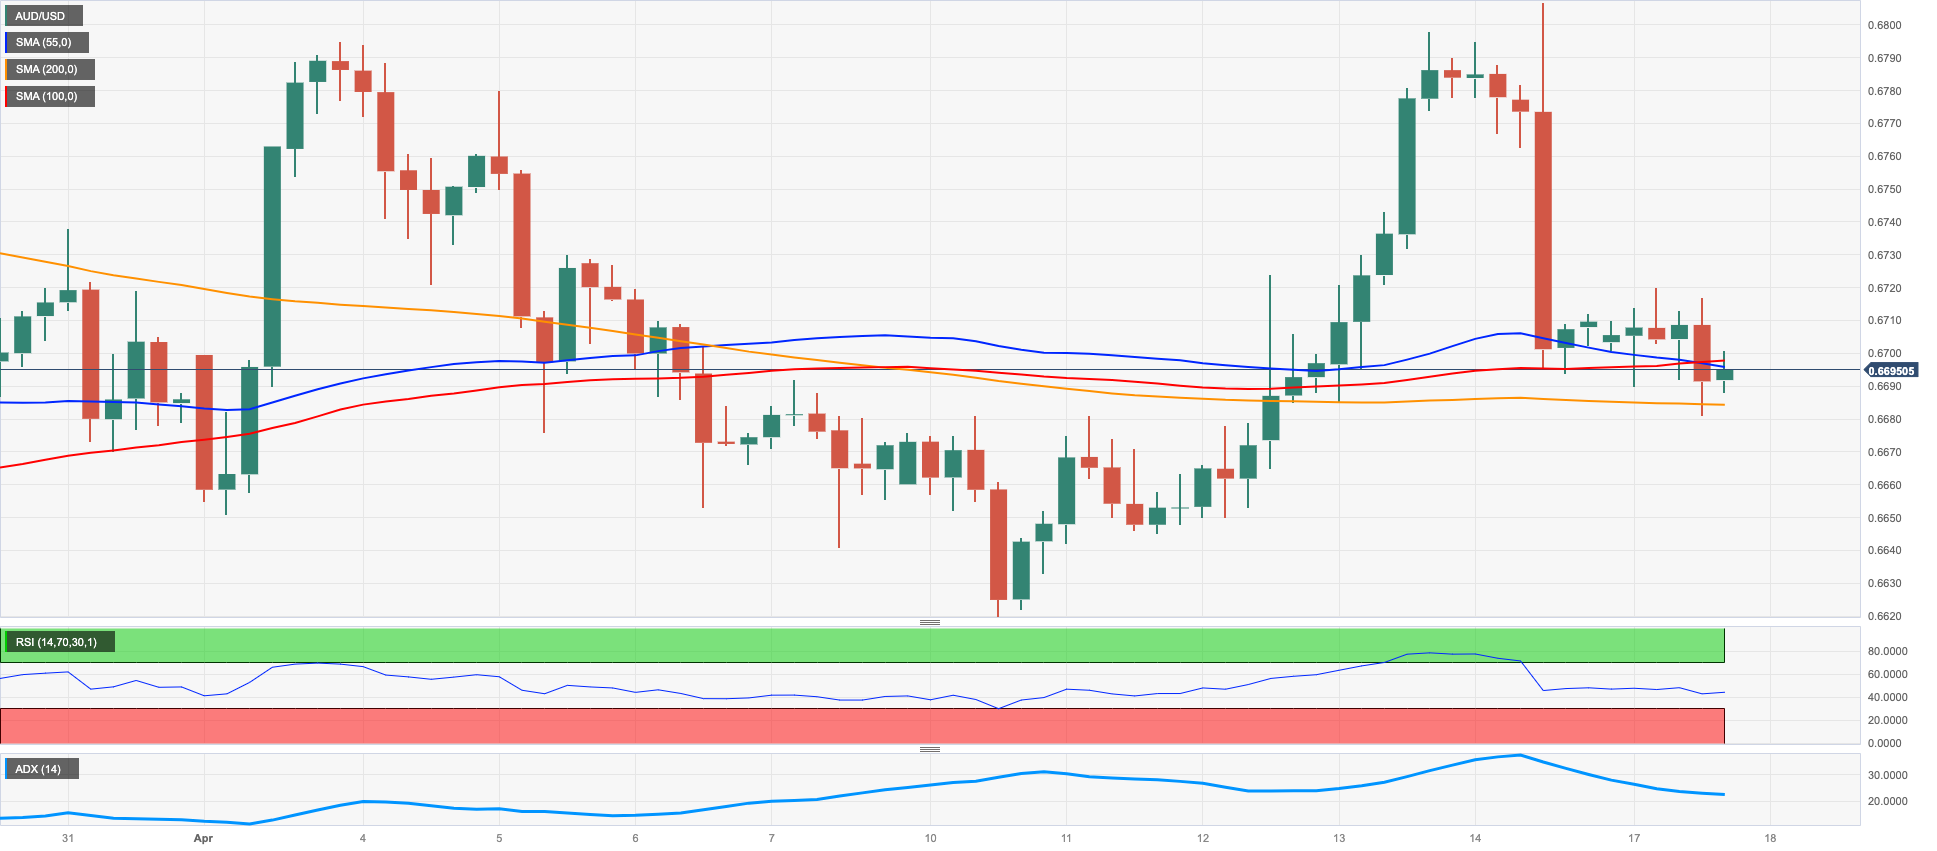
AUD/USD added to Friday’s retracement and extended further the corrective decline from monthly highs just past 0.6800 the figure recorded on April 14.
Indeed, the strong upside momentum in the greenback dominated the sentiment across the board at the beginning of the week and exposed the risk-associated universe to extra weakness.
Also weighing on the Aussie dollar emerged the steady stance from the PBoC after it left unchanged the 1-year MLF at 2.75% as well as the poor performance of the commodity complex, where both copper prices and the iron ore grinded lower.
Next of note in the Australian calendar will be the publication of the RBA Minutes of the April meeting.
Further selling pressure could prompt AUD/USD to challenge the April low at 0.6619 (April 10). The breach of these levels could open the door to a deeper pullback to the 2023 low at 0.6563 (March 10) prior to the weekly low at 0.6386 (November 10 2022) followed by the November 2022 low at 0.6272 (November 3). On the other hand, a break above the April peak at 0.6805 (April 14) could prompt the key round level at 0.7000 to emerge on the before the weekly high at 0.7029 (February 14) and the 2023 top at 0.7157 (February 2). The daily RSI slipped back below the 49 area.
Resistance levels: 0.6805 0.6920 0.7029 (4H chart)
Support levels: 0.6681 0.6619 0.6589 (4H chart)
GOLD
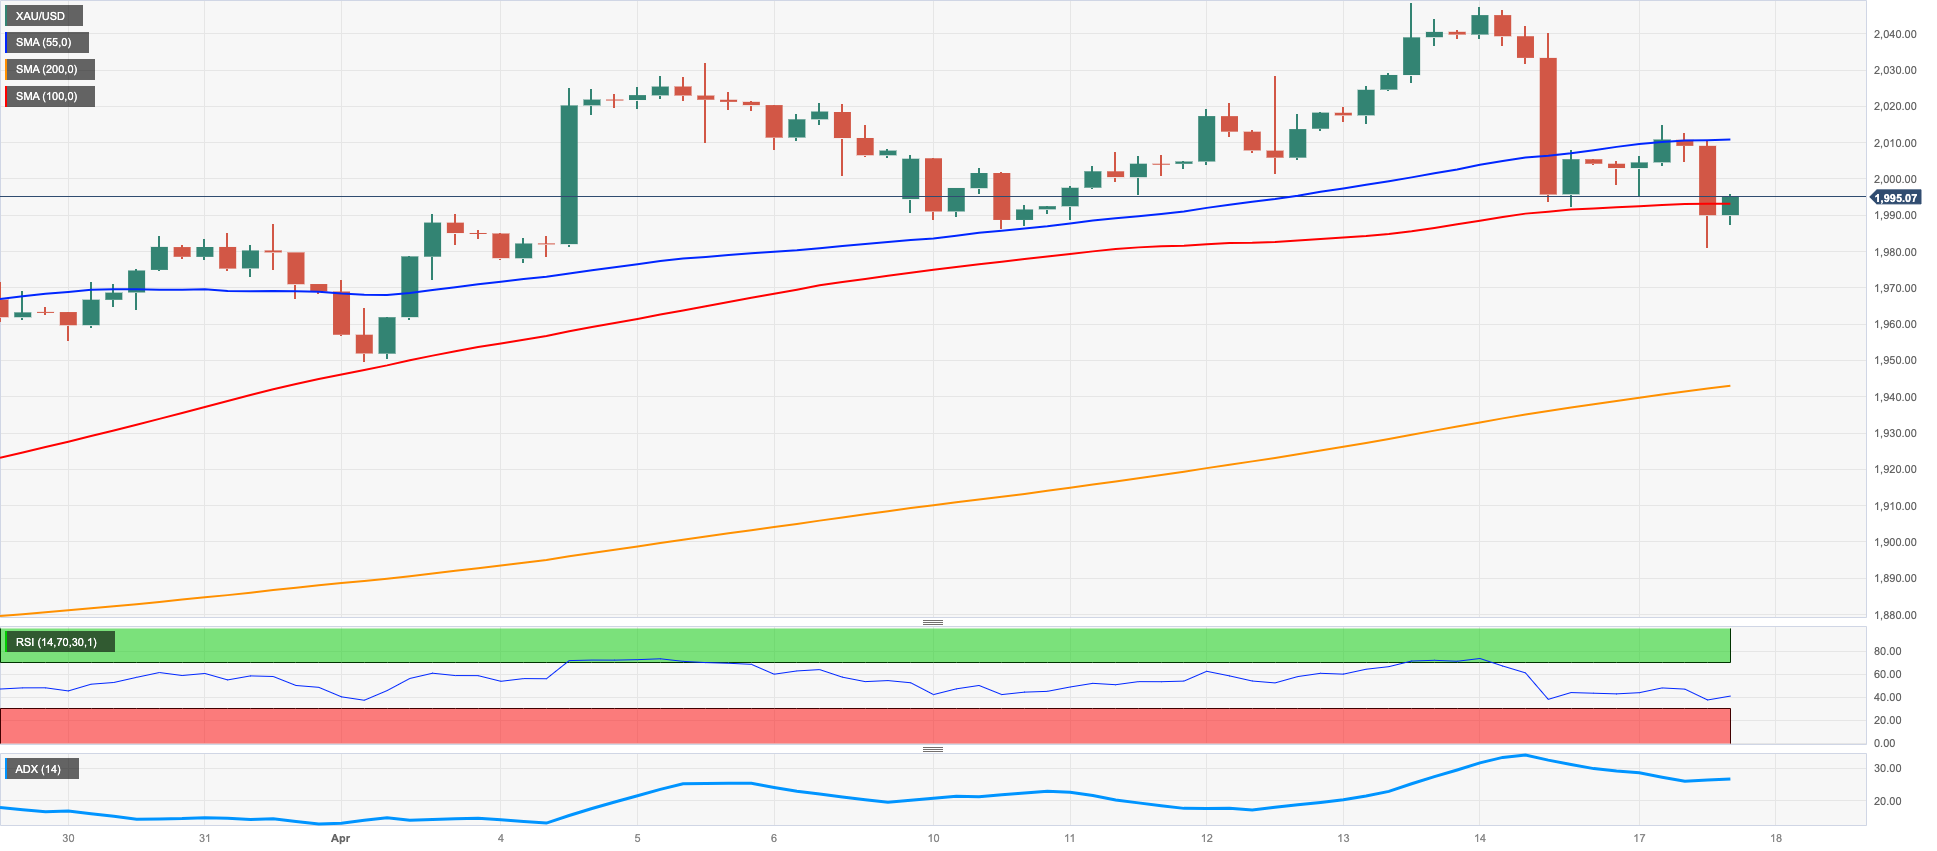
Gold prices probed the area of multi-session lows near $1980 before staging a mild bounce to the proximity of the key $2000 mark per ounce troy.
Once again, the pronounced rebound in the greenback put the USD-labeled assets under pressure and sponsored the second consecutive daily drop in the yellow metal.
In addition, further strength in US yields across the curve kept bullion buyers at bay amidst firmer expectations of a 25 bps interest rate hike by the Federal Reserve at the May event.
The bullish outlook for gold now appears somewhat dented. Against that, the continuation of the downtrend could spark a move to the April low at $1949 (April 3) ahead of the weekly low at $1934 (March 22) and temporary contention levels at the 55- and 100-day SMAs at $1910 and $1876, respectively. The breakdown of this region leaves the yellow metal vulnerable to a probable drop to the March low at $1809 (March 8) seconded by the 2023 low at $1804 (February 28) and the key 200-day SMA at $1794. Instead, the 2023 top at $2048 (April 13) is expected to come first prior to the 2022 peak at $2070 (March 8) and just ahead of the all-time high at $2075 (August 7 2020).
Resistance levels: $2015 $2048 $2070 (4H chart)
Support levels: $1981 $1949 $1938 (4H chart)
CRUDE WTI
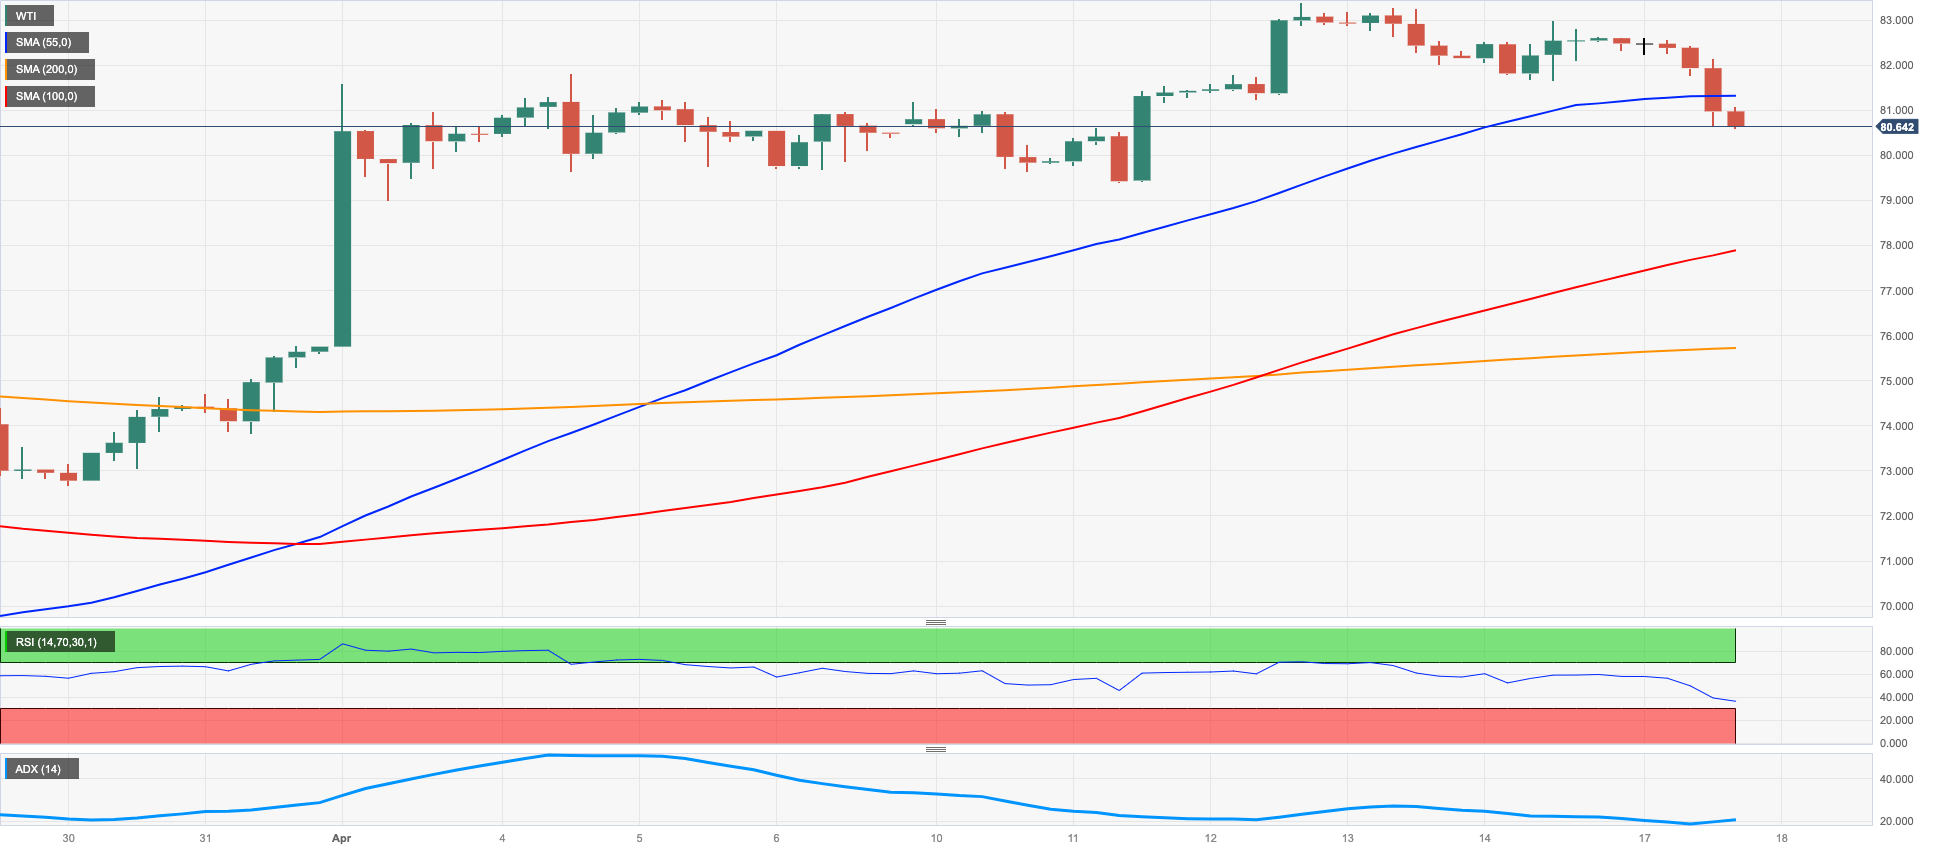
Prices of the WTI dropped to multi-day lows in the vicinity of the key $80.00 mark per barrel on Monday.
Indeed, oil traders were under pressure at the beginning of the week in response to recession concerns, at the same time bolstered by firmer speculation of another 25 bps rate hike by the Federal Reserve at the May gathering.
In addition, the stronger greenback fuelled the upside to 4-day highs in the USD Index (DXY), which in turn morphed into extra pressure for the commodity at the beginning of the week.
Extra gains in the WTI need to leave behind the 2023 peak at $83.49 (April 12), which appears so far underpinned by the proximity of the key 200-day SMA. Once this region is cleared, the commodity could challenge the November 2022 high at $93.73 (November 7). On the flip side, there is an initial support at the April low at $79.05 (April 3) prior to the temporary 100- and 55-day SMAs at $76.89 and $76.29, respectively, and the $66.86 level (March 24). The breakdown of the latter could put the 2023 low at $64.41 (March 20) back on the traders’ radar ahead of the December 2021 low at $62.46 (December 2).
Resistance levels: $83.49 $88.65 $90.08 (4H chart)
Support levels: $80.57 $78.97 $75.72 4H chart)
GER40
European stocks started the week mostly on the defensive except for the UK benchmark FTSE100 and the Spanish reference IBEX35.
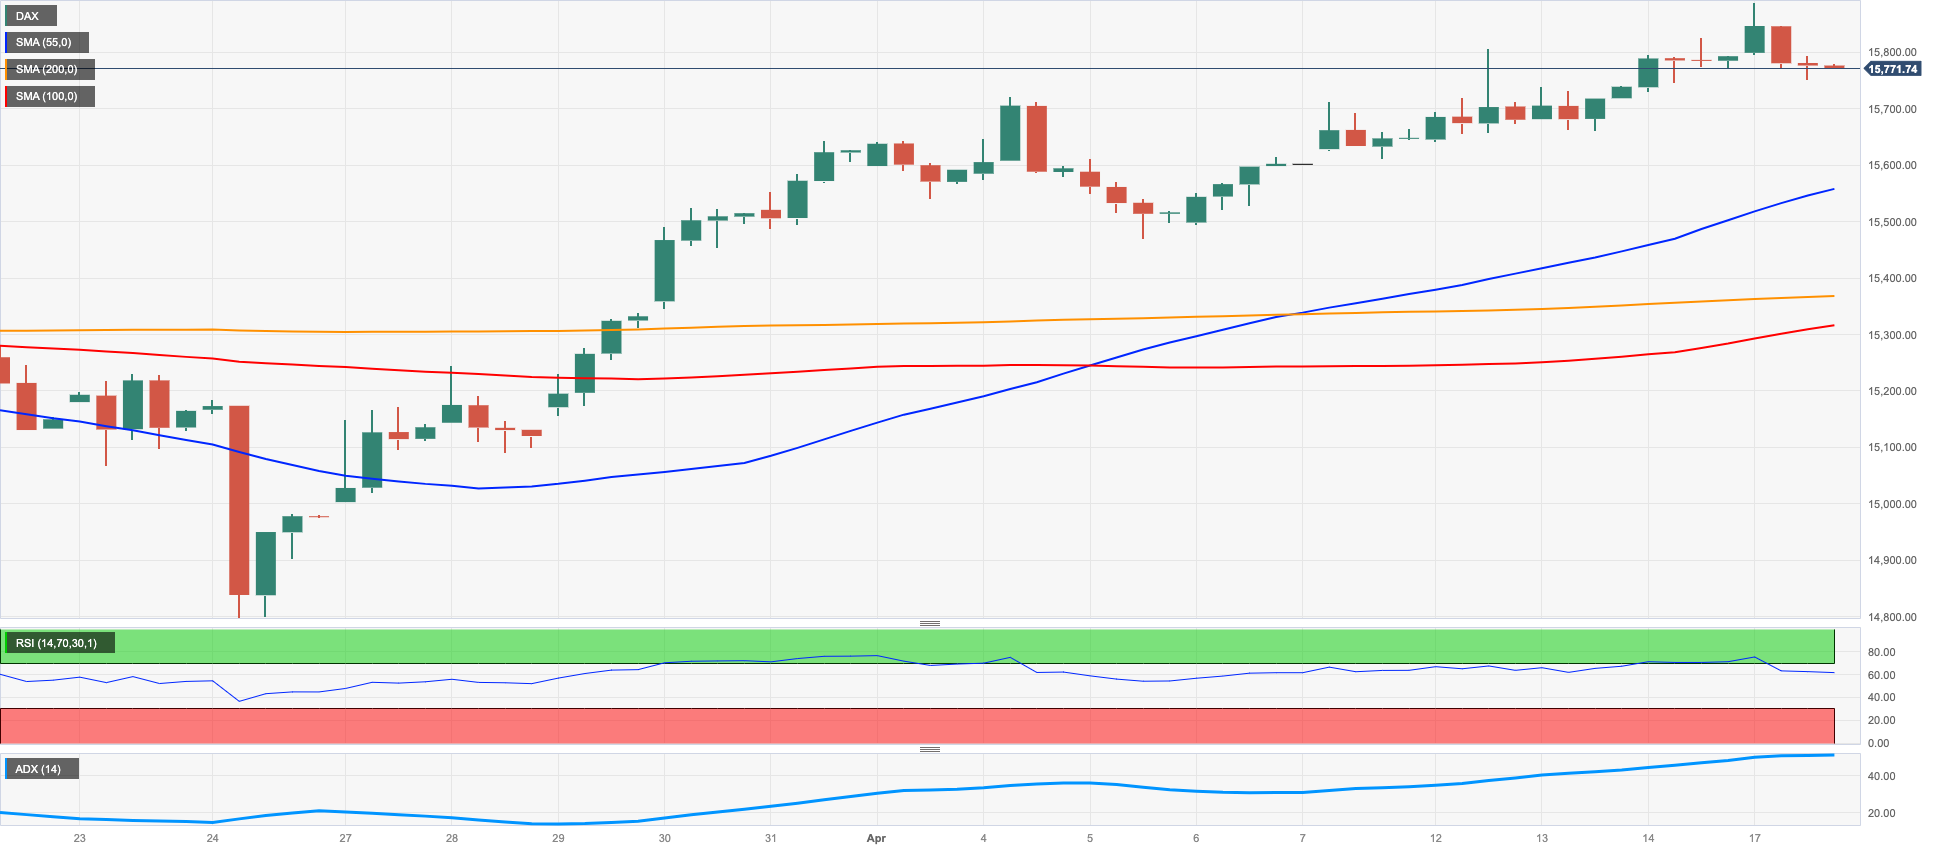
The German DAX40 snapped five sessions in a row with gains and receded to the 15700 region on Monday. Despite the knee-jerk, the index remained close to the key barrier at the 16000 mark.
The daily decline in the DAX40 came in response to rising cautiousness ahead of release of further quarterly earnings reports in the US economy later in the week, while expectations of another rate hike by the Fed in May (25 bps) also prompted the return of some recession jitters.
The German docket was empty on Monday, while the bond market showed the 10-year Bund yields creeping higher to the 2.50% region, or multi-week highs.
The resumption of the bullish mood should motivate the DAX40 to revisit the 2023 peak at 15841 (April 14) ahead of the round level at 16000 and the 2022 top at 16285 (January 5). On the contrary, the April low at 15482 (April 5) is expected to hold the initial downside test prior to the interim 55- and 100-day SMAs at 15373 and 14975, respectively. Once the index breaches this region, it could then trigger a deeper pullback to the minor support at 14809 (March 24) ahead of the March low at 14458 (March 20) and the key 200-day SMA at 14058. The daily RSI eased a tad to the vicinity of 62.
Best Performers: MTU Aero, Airbus Group, Daimler Truck Holdings
Worst Performers: Commerzbank, Munich Re Group, Hannover Rueck SE
Resistance levels: 15903 16090 16285 (4H chart)
Support levels: 15482 15319 14809 (4H chart)
NASDAQ
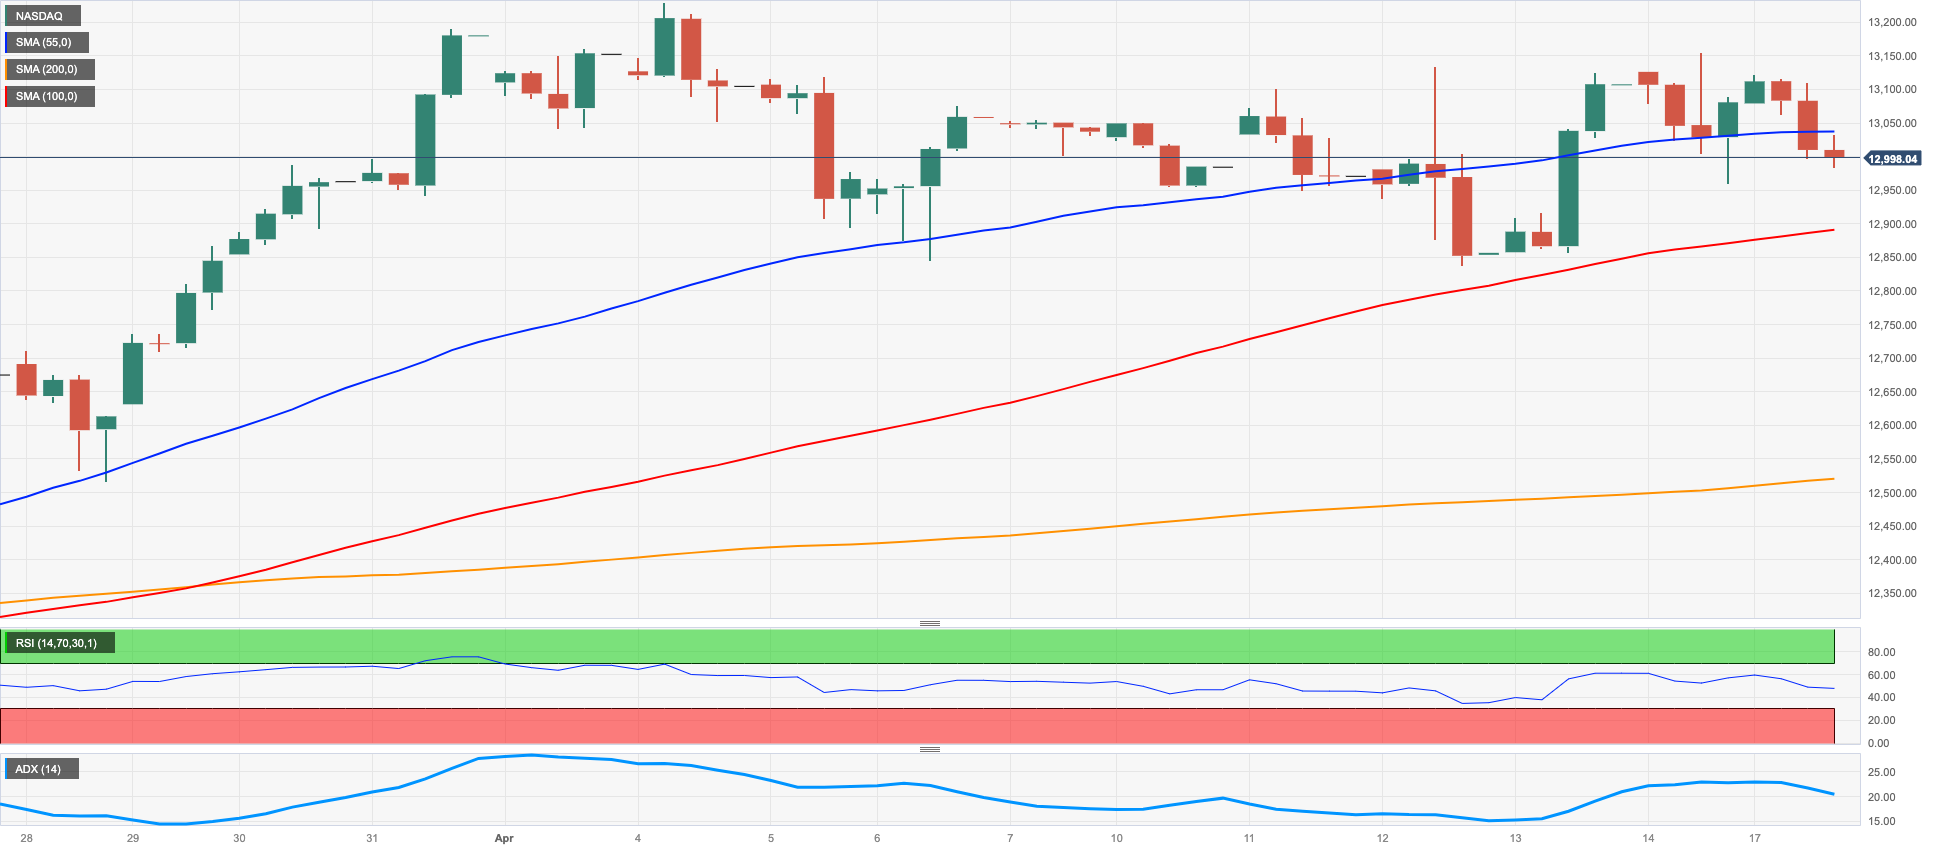
A not-so-auspicious start of the week for US tech equities.
Indeed, the stronger dollar as well as the march higher in US yields across the curve kept the price action in the Nasdaq 100 depressed at the beginning of the week, while the cautious stance among investors in light of upcoming earnings reports by megacaps also kept the sentiment subdued.
The Nasdaq 100 appears somewhat within a multi-session consolidative phase. The breakout of this range bound theme should retest the 2023 high at 13204 (April 4) ahead of the August 2022 top at 13720 (August 16) and the round level at 14000. Further up aligns the March 2022 top at 15265 (March 29). The other way around, the immediate support emerges at the April low at 12846 (April 6) before the weekly low at 12517 (March 28), while the 55-day SMA at 12499 is expected to offer provisional contention. Once the index clears the latter, it could prompt a probable visit to the key 200-day SMA at 12000 to resurface on the horizon prior to the March low at 11695 (March 13) and weekly lows at 11550 (January 25) and 11251 (January 19), all followed by the 2023 low at 10696 (January 6). The daily RSI weakened to the 58 zone.
Top Gainers: Enphase, Warner Bros Discovery Inc, JD.com Inc Adr
Top Losers: Moderna, ASML ADR, Lam Research
Resistance levels: 13204 13720 14277 (4H chart)
Support levels: 12833 12517 12010 (4H chart)
DOW JONES
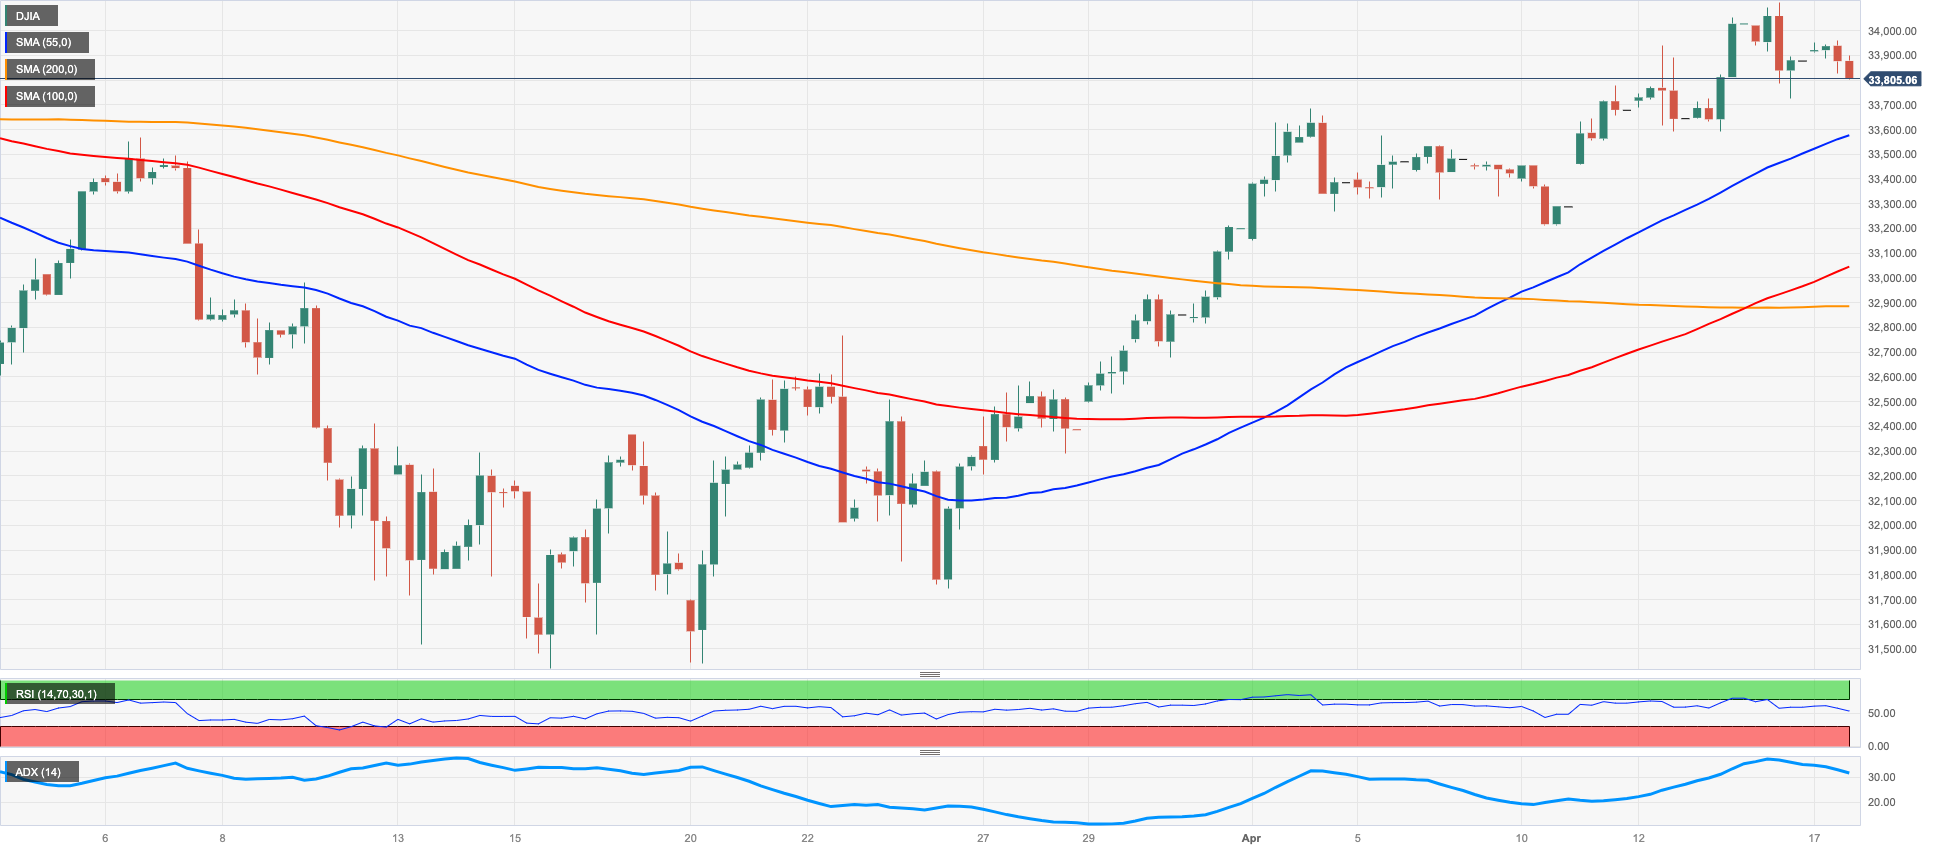
Stocks gauged by the Dow Jones and the rest of its US peers started the week on the back foot in response to rising jitters over the likelihood that the Fed might raise rates by 25 bps at the next monetary policy meeting in May.
Also adding to the cautious note, investors showed increasing prudence ahead of the publication of key earnings reports throughout the week.
On the whole, the Dow Jones retreated 0.26% to 33798, the S&P500 dropped 0.31% to 4124 and the tech-heavy Nasdaq Composite deflated 0.35% to 12080.
No changes to the topside should see the Dow Jones facing the next resistance level at the April high at 34082 (April 14) followed by the 2023 top at 34342 (January 13) and ahead of the December 2022 peak at 34712 (December 13). North from here turns up the April 2022 high at 35492 (April 21) before the February 2022 top at 35824 (February 9). Just the opposite, there are provisional support levels at the 100- and 55-day SMAs at 33379 and 33179, respectively, seconded by the key 200-day SMA at 33537 and the 2023 low at 31429 (March 15). The breach of the latter could put the 30000 level back on the radar ahead of the 2022 low at 28660 (October 13). The daily RSI drifted lower to the proximity of 63.
Top Performers: Salesforce Inc, Boeing, Walgreen Boots
Worst Performers: UnitedHealth, Chevron, Visa A
Resistance levels: 34082 34334 34712 (4H chart)
Support levels: 33362 31805 31429 (4H chart)
MACROECONOMIC EVENTS

All Information & Updates provided by:

All information relating to the financial markets available on this page has been prepared and issued by FXStreet (Forexstreet SL, Spain, Reg: B62498233) on the basis of publicly available information and all information believed to be reliable and does not conflict with Kuwaiti local laws, and all necessary care has been taken to before the company to ensure that the facts mentioned are correct from the source.
NCM Investment nor any of its directors or employees shall in any way be held responsible for the contents of this news, and the information contained on this page is intended only to provide clients with publicly available information and should not be construed as investment advice, report or analysis and/or constitute an offer or invitation to buy or sell financial instruments of any kind.
RISK WARNING: Forex and CFDs are highly risky leveraged products, as losses can exceed deposits. Please ensure you understand all the risks and take independent advice if necessary. NCM will segregate the clients based on the criteria of the regulator and its bylaws. NCM does not provide any advisory service; the material published does not constitute advice or a recommendation for a transaction in any financial instrument. NCM accepts no responsibility for any use of the content presented and any consequences of that use. Anyone acting on the information provided does so at their own risk.