
- Contact Us:
-

-

-

-


Daily Market Updates
19 Apr 2023
USDJPY
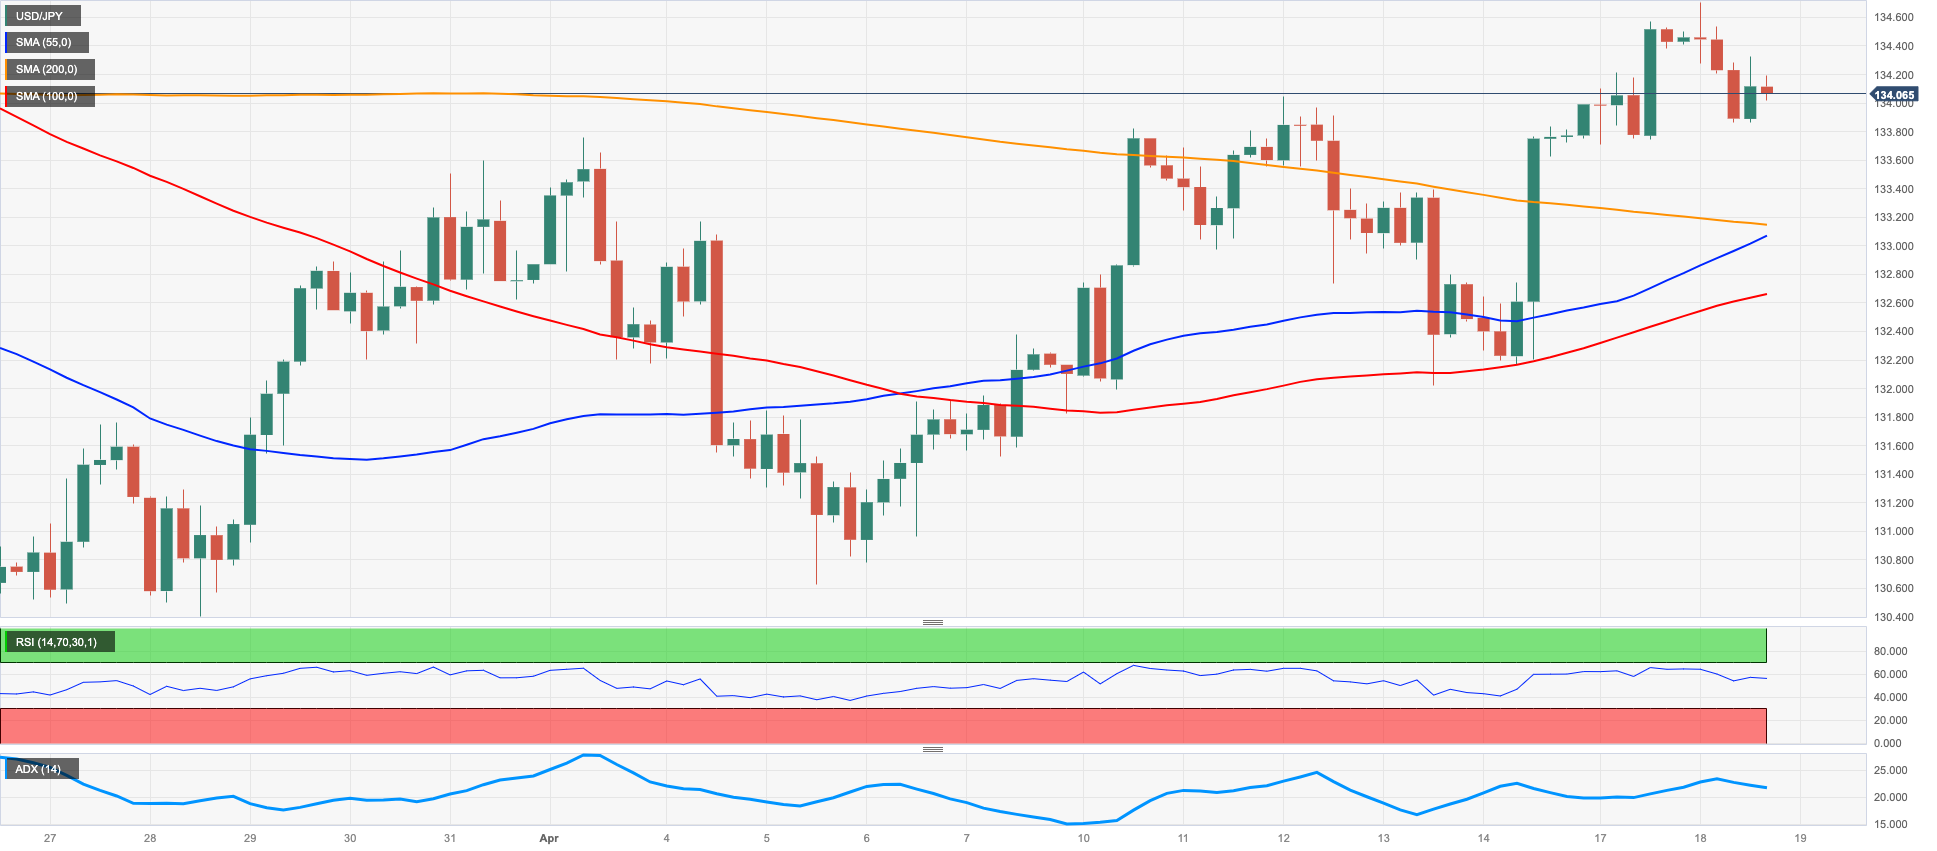
USD/JPY met some downside pressure soon after hitting fresh tops around 134.70 on Tuesday, revisiting the 133.80 region before staging a rebound.
The knee-jerk in the pair came on the back of the marked corrective retracement in the dollar, while the mixed note in US yields across the curve also added to the daily decline.
On the latter, the short end of the US curve climbed to multi-week peaks past 4.20%, while the belly and the long end retreated modestly.
No news from the Japanese money mark, where the JGB 10-year yields remained side-lined just below the 0.50% region.
From the BoJ, Deputy Governor Uchida stressed that financial constraints will not endanger the ability of the central bank to implement monetary policy. In addition, Governor Ueda suggested that there is no need to reassess the 2013 joint statement with the government and emphasized that the bank will achieve the inflation target sooner or later.
There were no data releases in Japan on Tuesday.
The surpass of the April high at 134.70 (April 18) should put USD/JPY en route to a probable test of the key 200-day SMA at 137.11 prior to the 2023 top at 137.91 (March 8). North from here emerges weekly peaks at 139.89 (November 30 2022) and 142.25 (November 21 2022). By contrast, the 55-day SMA at 133.27 is expected to offer temporary contention before the April low at 130.62 (April 5) and the March low at 129.63 (March 24). The loss of the latter exposes the February low at 128.08 (February 2) seconded by 2023 low at 127.21 (January 16). The daily RSI lost momentum and retreated to the vicinity of the 56 region.
Resistance levels: 134.70 135.11 136.99 (4H chart)
Support levels: 133.27 132.01 130.62 (4H chart)
GBPUSD
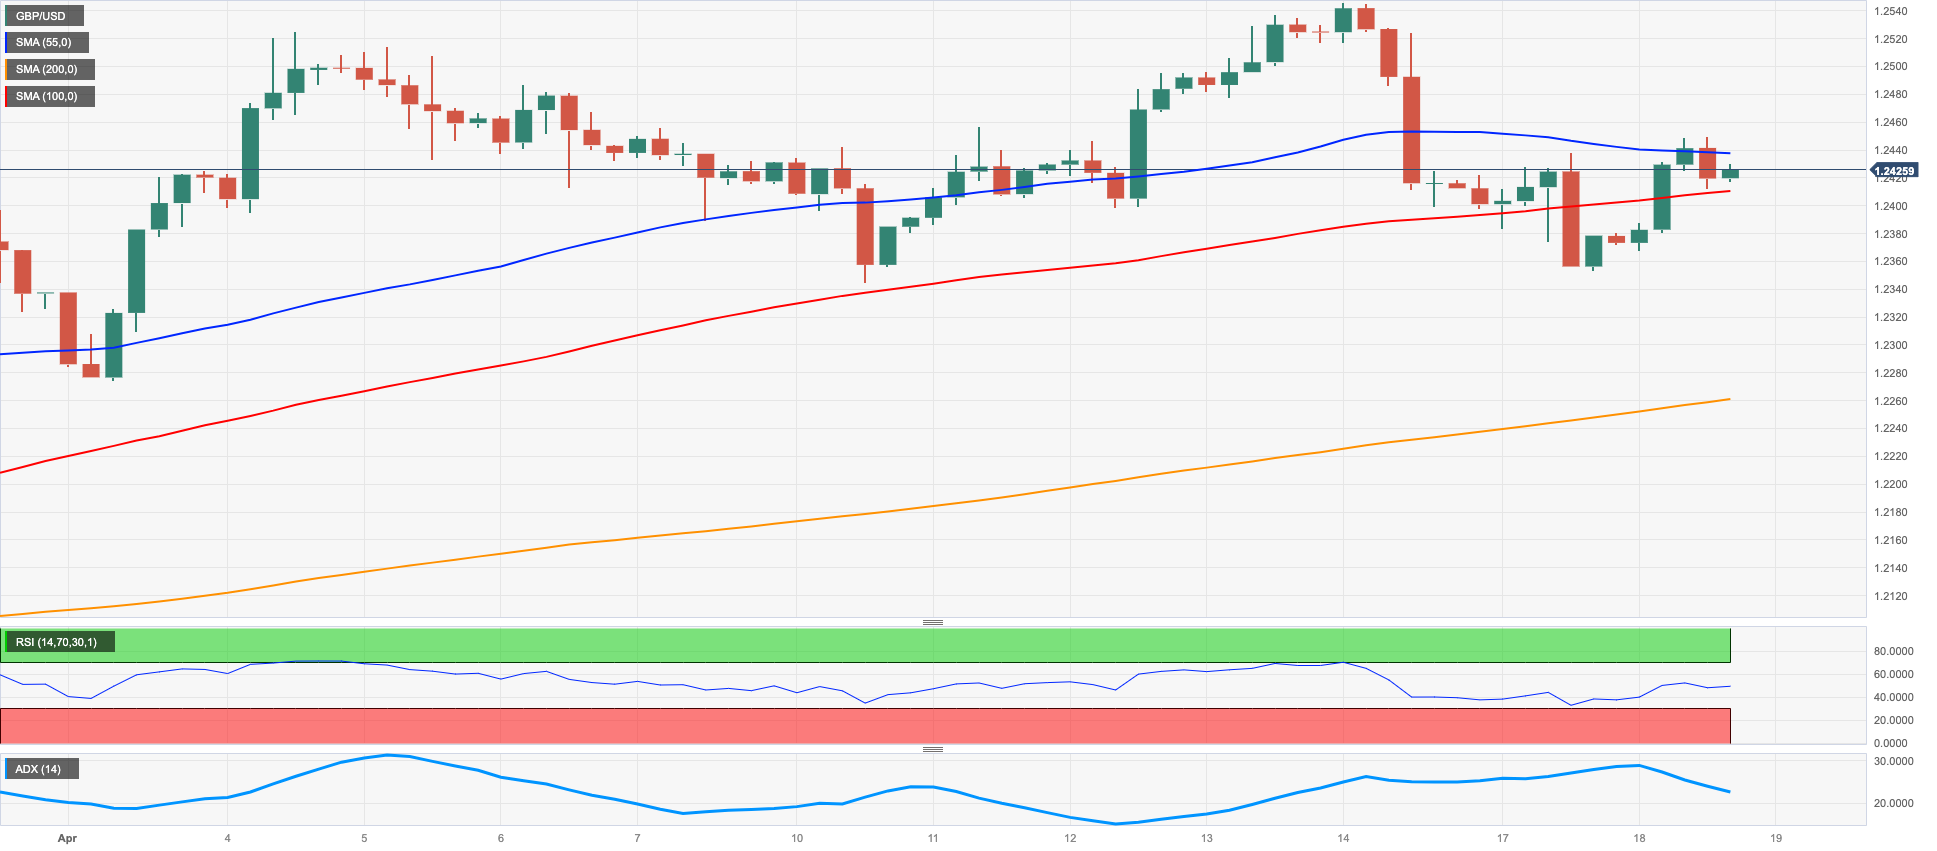
GBP/USD regained upside traction and reclaimed the area above 1.2400 the figure on Tuesday.
Indeed, the renewed selling bias in the dollar lent wings to the Sterling and the rest of its risk-linked peers, propelling Cable to new 2-day highs near 1.2450.
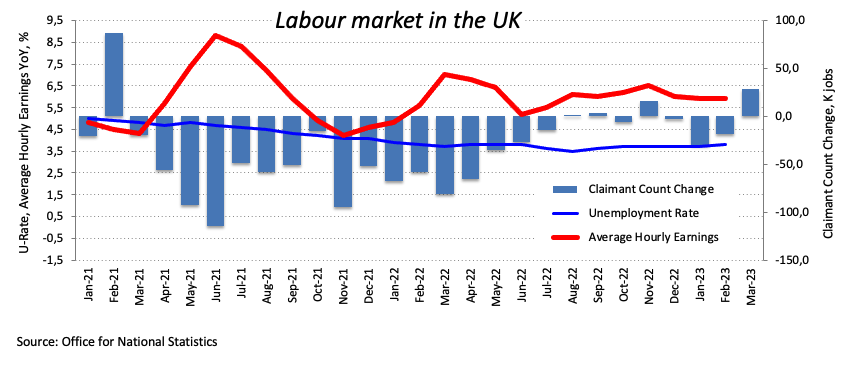
Extra support for the quid came in response to mixed results from the UK jobs report, where the Employment Change increased sharply by 169K persons despite the Unemployment Rate ticked a tad higher to 3.8%. Additionally, Average Earnings inc. Bonus expanded 5.9% YoY in the three months to February and Claimant Count Change rose by 28.2K people.
The resumption of the uptrend should encourage GBP/USD to challenge the 2023 top at 1.2546 (April 14) ahead of the May 2022 peak at 1.2666 (May 27). The surpass of this level could put the 200-week SMA at 1.2865 back on the investors’ radar prior to the psychological 1.3000 mark. On the opposite side, the weekly low at 1.2344 (April 10) emerges as the next support ahead of the April low at 1.2274 (April 3) and the provisional 55-day SMA at 1.2182. South from here, there are no support levels of note until the key 200-day SMA at 1.1915 seconded by the 2023 low at 1.1802 (March 8). The daily RSI rebounded past the 56 level.
Resistance levels: 1.2449 1.2546 1.2599 (4H chart)
Support levels: 1.2353 1.2344 1.2274 (4H chart)
AUDUSD
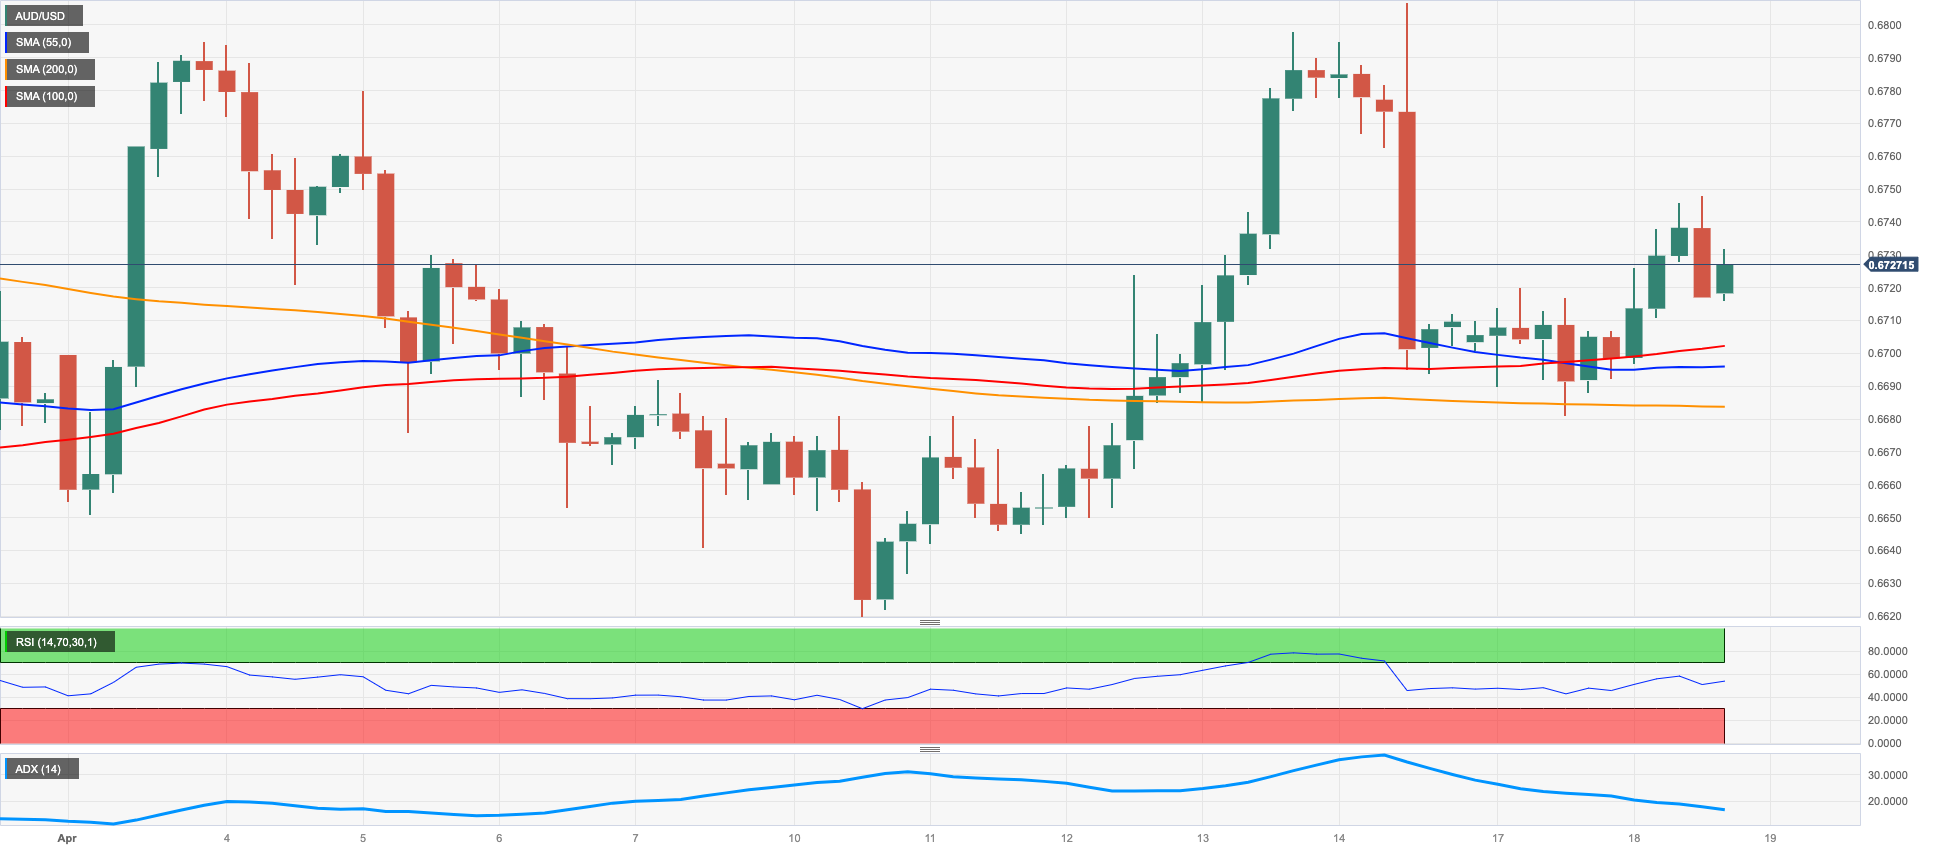
The bearish note in the greenback in combination with auspicious results from the Chinese docket lent renewed oxygen to the Aussie dollar and prompted AUD/USD to trim part of the recent weakness.
Indeed, the pick-up in the sentiment around the risk complex came in response to the better-than-expected Chinese Q1 GDP figures, all helping the pair revisit the 0.6750 region, an area also coincident with the key 200-day SMA.
Additionally, the AUD derived extra strength from the firm performance in the commodity space, where both copper prices and the iron ore regained some ground lost in past sessions.
The only release of note in Oz was the RBA Minutes of the April meeting. Following the Minutes, and while there was a discussion regarding the case for further rate increases, members agreed that there was the need for a pause in the hiking cycle to reassess the need of extra tightening in future meetings. Participants also noted that inflation remains excessively elevated and while the labour market conditions eased a tad as of late, it remains extremely tight.
AUD/USD needs to clear the 200-day SMA at 0.6742 in a convincing fashion to allow for a rapid test of the April high at 0.6805 (April 14). Once this level is cleared, spot could dispute the key round level at 0.7000 prior to the weekly top at 0.7029 (February 14) and the 2023 peak at 0.7157 (February 2). To the contrary, immediate contention emerges at the April low at 0.6619 (April 10) seconded by the 2023 low at 0.6563 (March 10) and the weekly low at 0.6386 (November 10 2022). Down from here comes the November 2022 low at 0.6272 (November 3). The daily RSI bounced slightly beyond the 51 mark.
Resistance levels: 0.6747 0.6805 0.6920 (4H chart)
Support levels: 0.6684 0.6619 0.6589 (4H chart)
GOLD
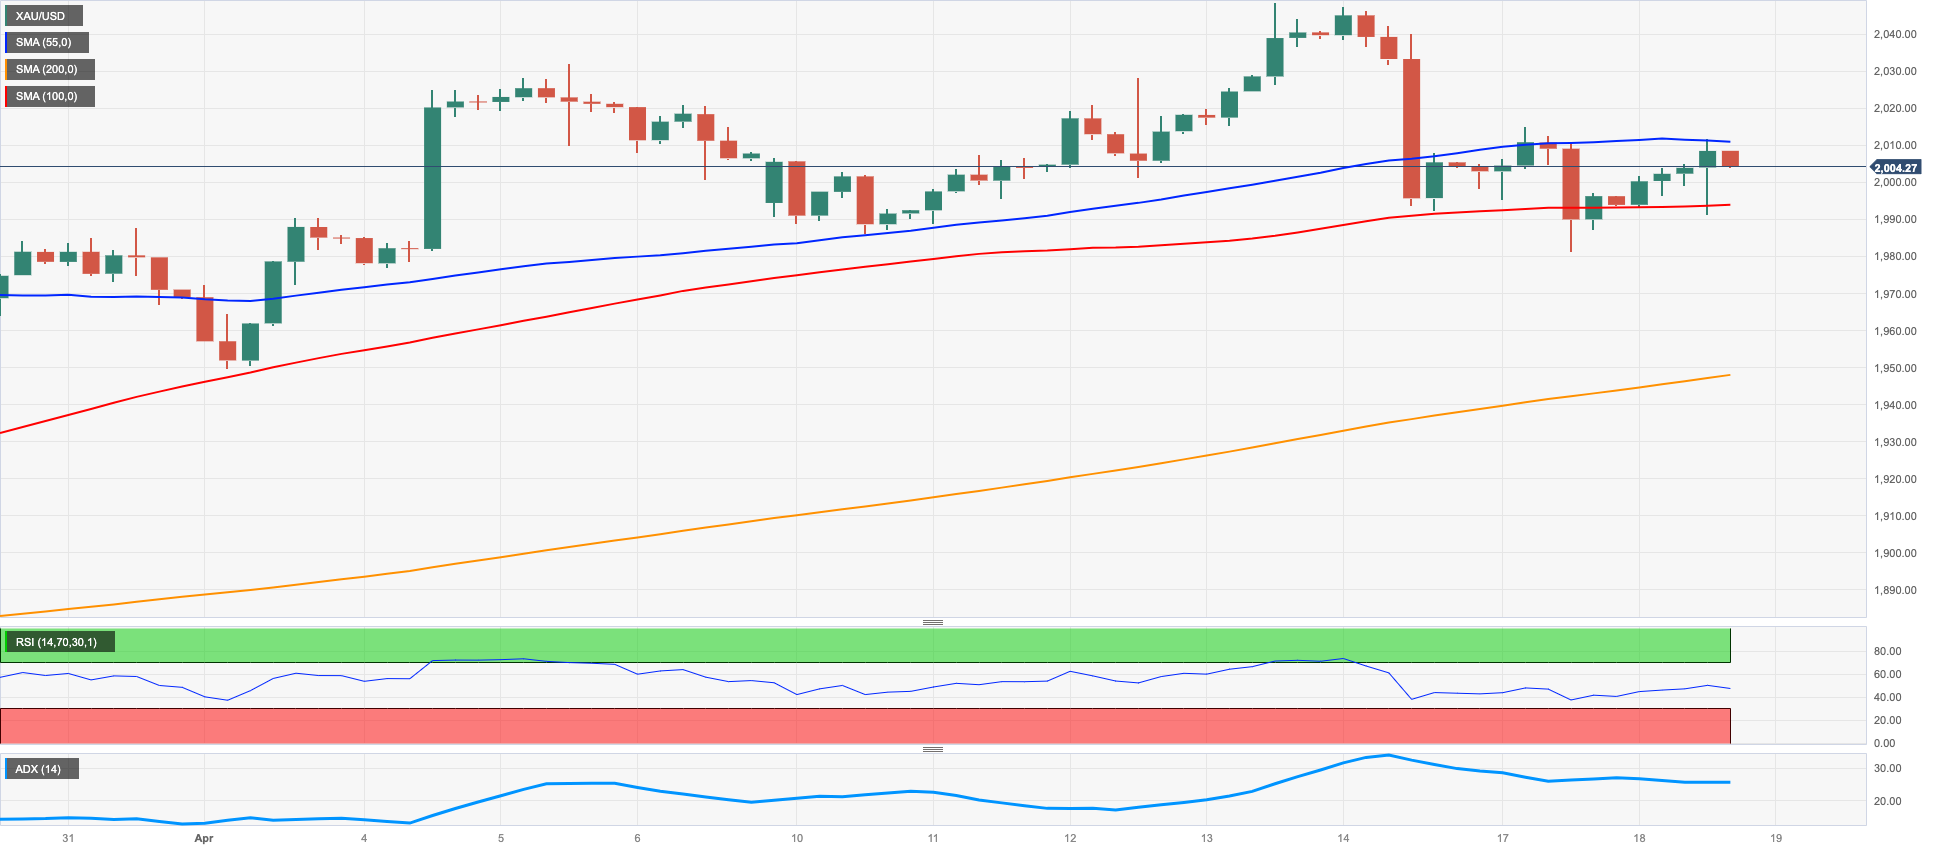
Prices of the ounce troy of the yellow metal partially set aside losses seen in the last couple of sessions and advanced beyond the key $2000 mark on Tuesday.
Indeed, the resumption of the selling bias in the greenback favoured the recovery in the precious metal, while the mixed activity in the US money market also added to the daily gains.
So far, bets of a potential pause of the Fed’s tightening cycle after the May event appear to support the non-yielder metal so far, a view that was reinforced by comments from Atlanta Fed R.Bostic earlier in the session.
It seems gold has embarked on a potential recovery. That said, the initial magnet for bulls remains at the 2023 peak at $2048 (April 13) seconded by the 2022 high at $2070 (March 8) and closely followed by the all-time top at $2075 (August 7 2020). On the other hand, the next support of note appears at the April low at $1949 (April 3) prior to the weekly low at $1934 (March 22) and provisional contention levels at the 55- and 100-day SMAs at $1911 and $1879, respectively. The loss of the latter could prompt the March low at $1809 (March 8) to emerge on the horizon before the 2023 low at $1804 (February 28) and the key 200-day SMA at $1795.
Resistance levels: $2015 $2048 $2070 (4H chart)
Support levels: $1981 $1949 $1938 (4H chart)
CRUDE WTI
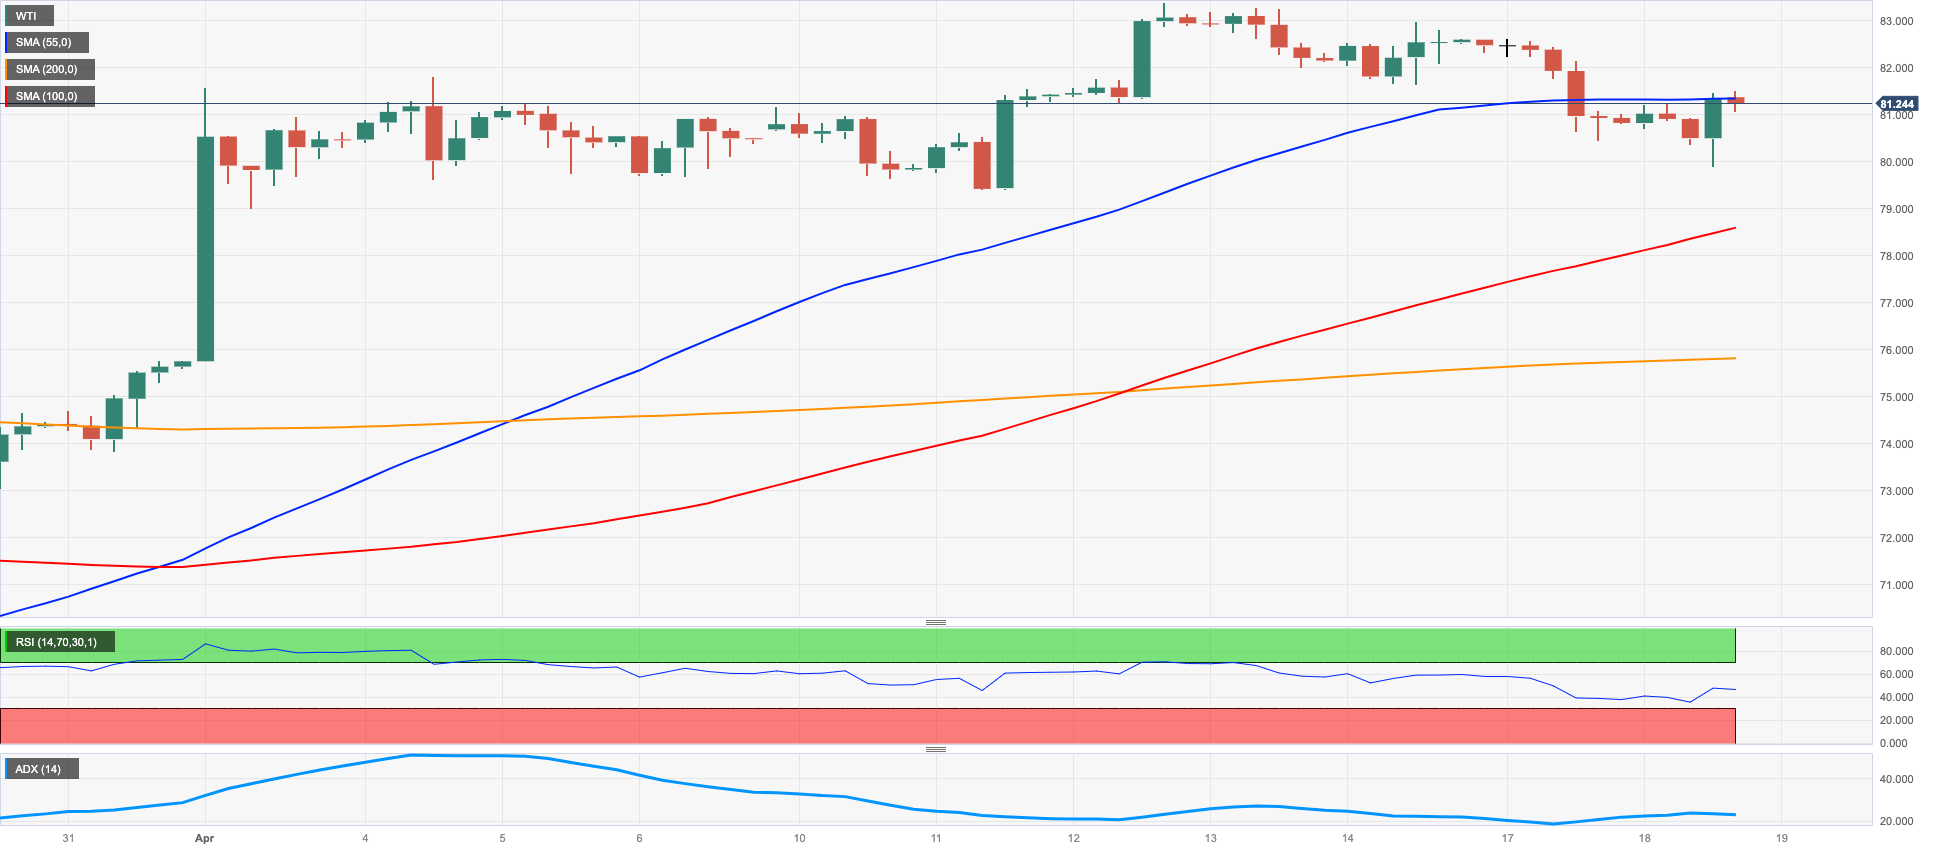
After a brief drop to the sub-$80.00 region, the barrel of the WTI regained buying interest and reclaimed the area beyond $81.00 on Tuesday amidst the generalized downside pressure around the dollar.
Furthermore, the commodity shrugged off concerns over the potential impact of persistent Fed’s tightening on the economy and its negative effects on prices of the crude oil, refocusing instead on the promising GDP figures in China – the second crude oil consumer - during the January-March period.
Limiting the upside in crude oil, however, emerged news that the Turkish port of Ceyhan could resume its normal activity any time soon.
Later in the session, the API will report on the weekly US crude oil inventories in the week to April 14.
Next on the upside for the WTI comes the key 200-day SMA at $82.56. A sustained breakout of this region could motivate the WTI to rapidly challenge the 2023 high at $83.49 (April 12) prior to the November 2022 top at $93.73 (November 7). In opposition, the April low at $79.05 (April 3) emerges as the immediate support ahead of the provisional 100- and 55-day SMAs at $76.92 and $76.35, respectively. South from here comes the $66.86 level (March 24) seconded by the 2023 low at $64.41 (March 20) and the December 2021 low at $62.46 (December 2).
Resistance levels: $83.49 $88.65 $90.08 (4H chart)
Support levels: $79.88 $78.97 $75.83 (4H chart)
GER40
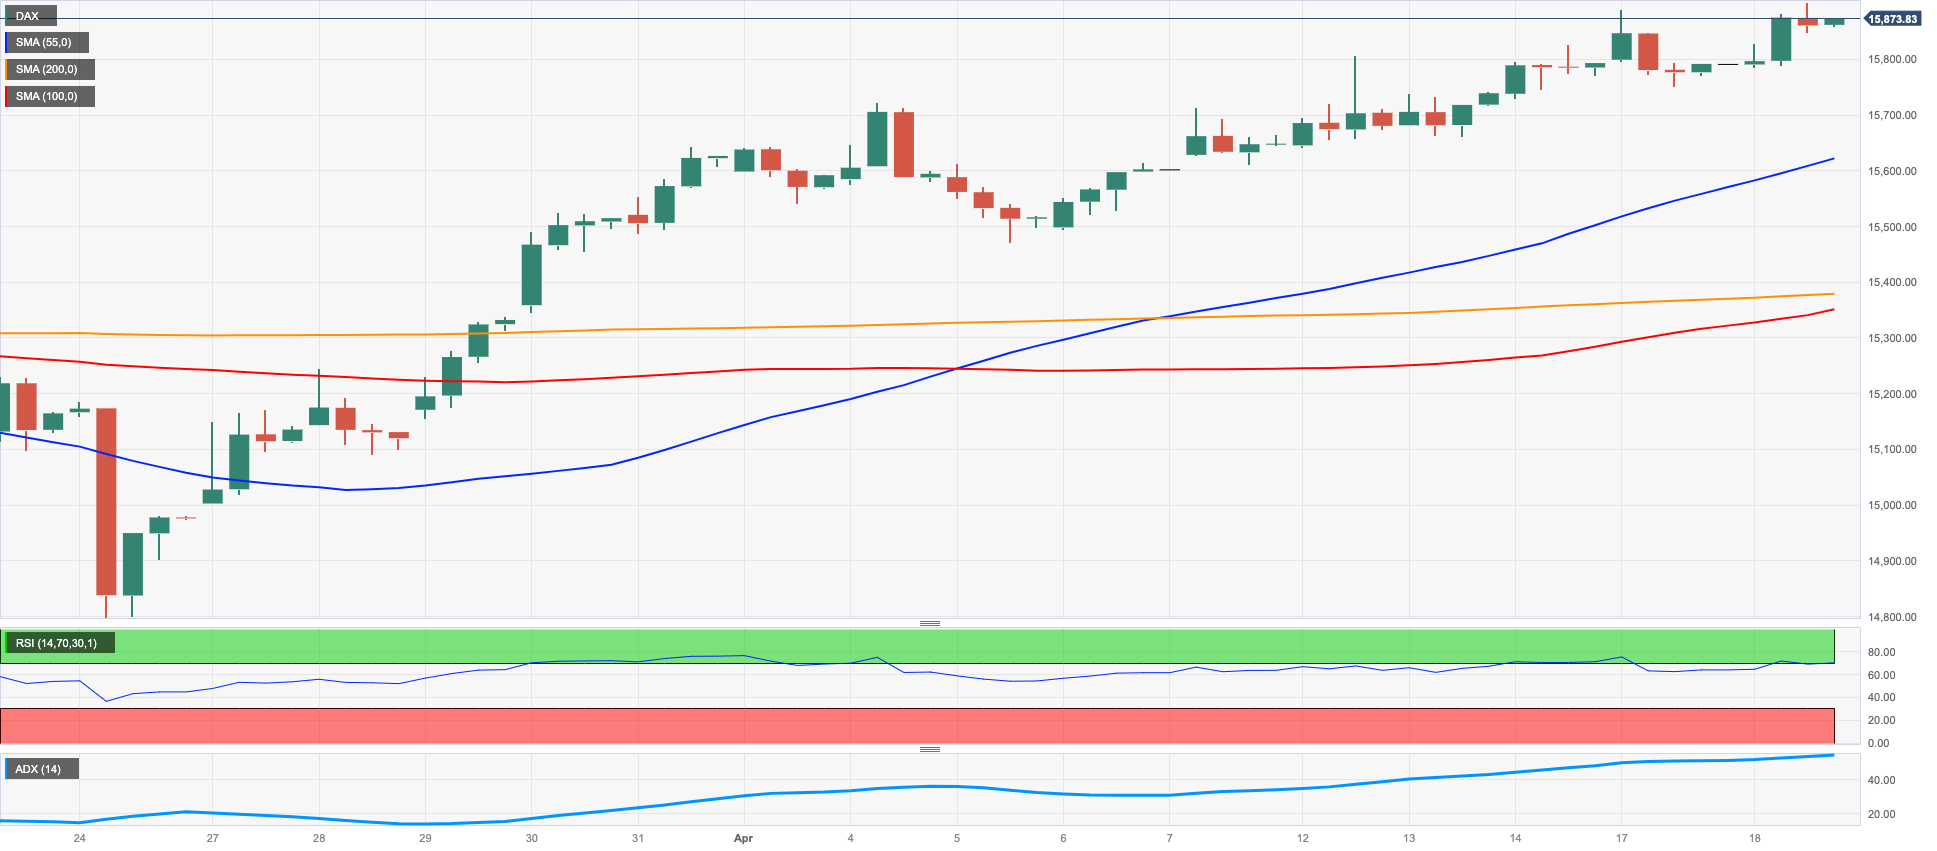
German equities gauged by the benchmark DAX40 reached fresh 2023 highs in levels just shy of the key 16000 yardstick on Tuesday.
In fact, the risk-on tone prevailed in the old continent following auspicious results from the Chinese GDP figures for the first quarter, while investors also perceived as positive the UK jobs report, which eventually collaborated with the upbeat mood.
The uptick in the index was also underpinned by another session with gains in the 10-year Bund yields, this time surpassing the key 2.50% region.
In Germany, the Economic Sentiment measured by the ZEW institute unexpectedly retreated to 4.1 in April (from 13).
The DAX40 clinched a new 2023 high at 15916 (April 18). Next on the upside now comes the round level at 16000 prior to the 2022 peak at 16285 (January 5). Just the opposite, the initial support emerges at the April low at 15482 (April 5) ahead of temporary contention at the 55- and 100-day SMAs at 15386 and 14989, respectively. The breakdown of the latter could open the door to the minor support at 14809 (March 24) before the March low at 14458 (March 20) and the key 200-day SMA at 14073. The daily RSI advanced to the proximity of 65.
Best Performers: MTU Aero, Commerzbank, Brenntag AG
Worst Performers: Siemens Energy AG, Merck, Qiagen
Resistance levels: 15916 16090 16285 (4H chart)
Support levels: 15482 15333 14809 (4H chart)
NASDAQ
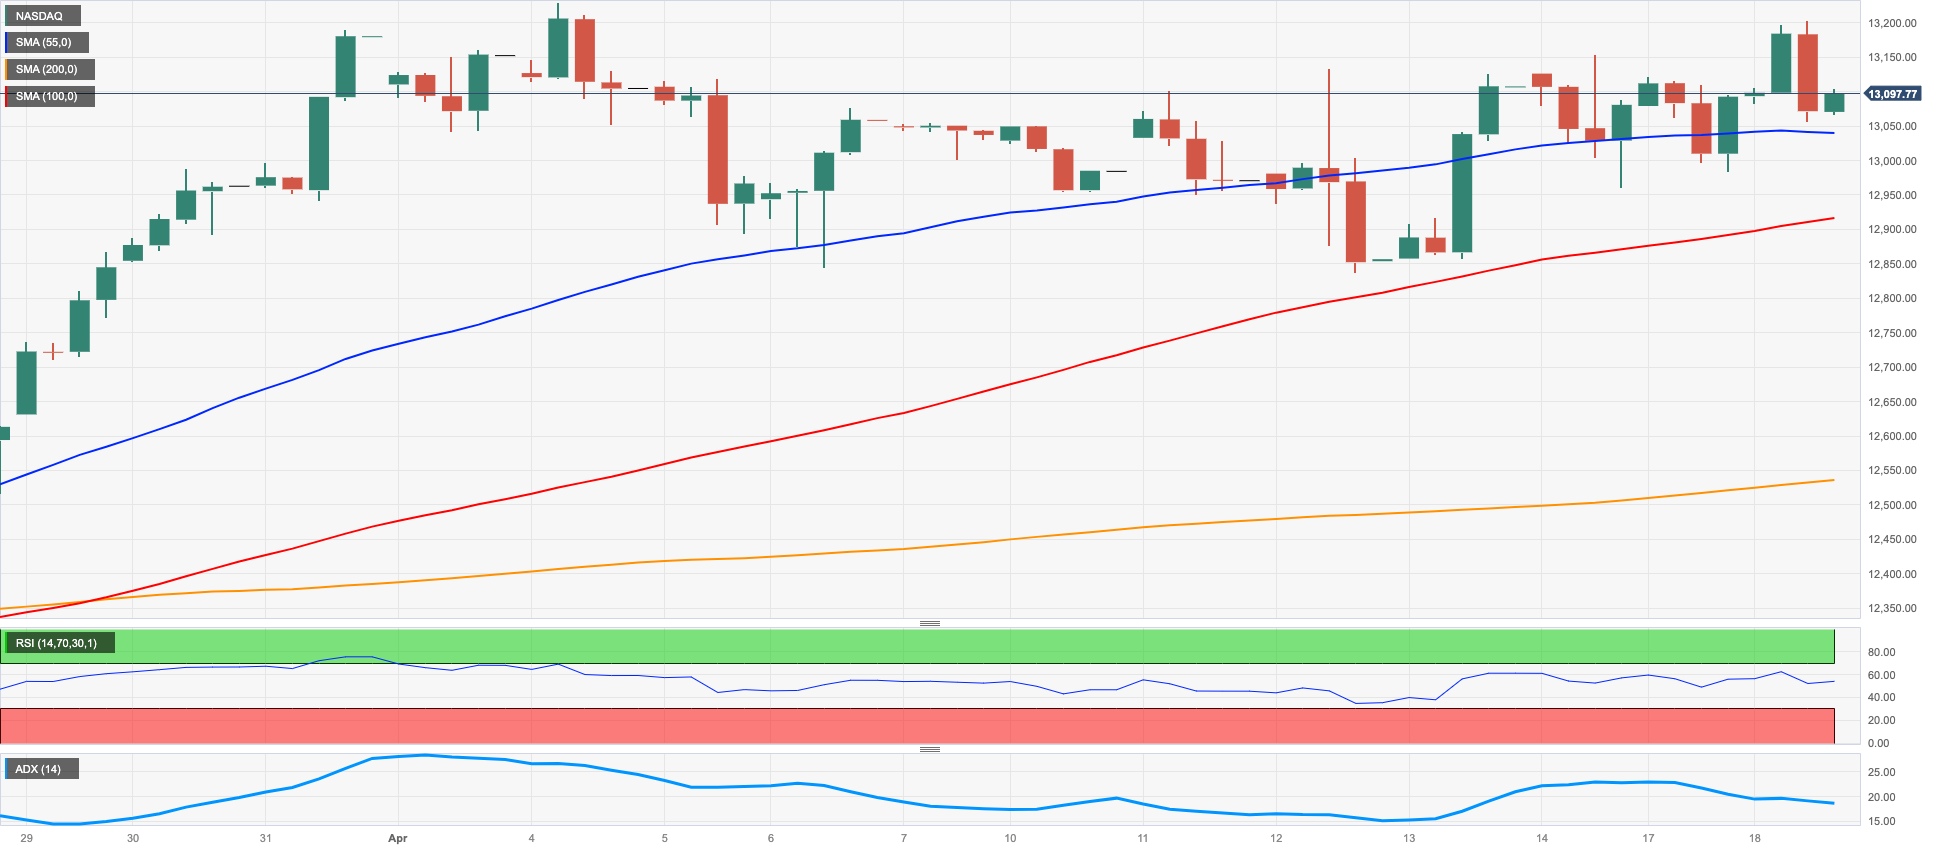
The generalized lack of direction in the US markets prompted the Nasdaq 100 to retreat modestly against the backdrop of the erratic performance in the rest of its US peers on Tuesday.
Expectations of another rate hike by the Fed in May in collaboration with hawkish remarks from FOMC’s J. Bullard lent support to yields in the short end of the curve and put the tech sector under pressure.
In addition, fears of a probable economic slowdown and below-consensus earnings reports from some blue chips also kept the sentiment among traders subdued.
The Nasdaq 100 extended the range bound trade on Tuesday. In the meantime, the continuation of the uptrend needs to break above the 2023 top at 13204 (April 4) to open the door to a probable visit to the August 2022 peak at 13720 (August 16) followed by the round level at 14000 and the March 2022 peak at 15265 (March 29). On the contrary, the April low at 12846 (April 6) is expected to hold the initial test seconded by the weekly low at 12517 (March 28), which appears reinforced by the temporary 55-day SMA. The breach of this region could prompt the key 200-day SMA at 12008 to return to the traders’ radar ahead of the March low at 11695 (March 13) and weekly lows at 11550 (January 25) and 11251 (January 19). Down from here emerges the 2023 low at 10696 (January 6). The daily RSI receded to the 60 zone.
Top Gainers: NVIDIA, Marvell, Airbnb
Top Losers: Sirius XM, Atlassian Corp Plc, Rivian Automotive
Resistance levels: 13204 13720 14277 (4H chart)
Support levels: 12833 12517 12017 (4H chart)
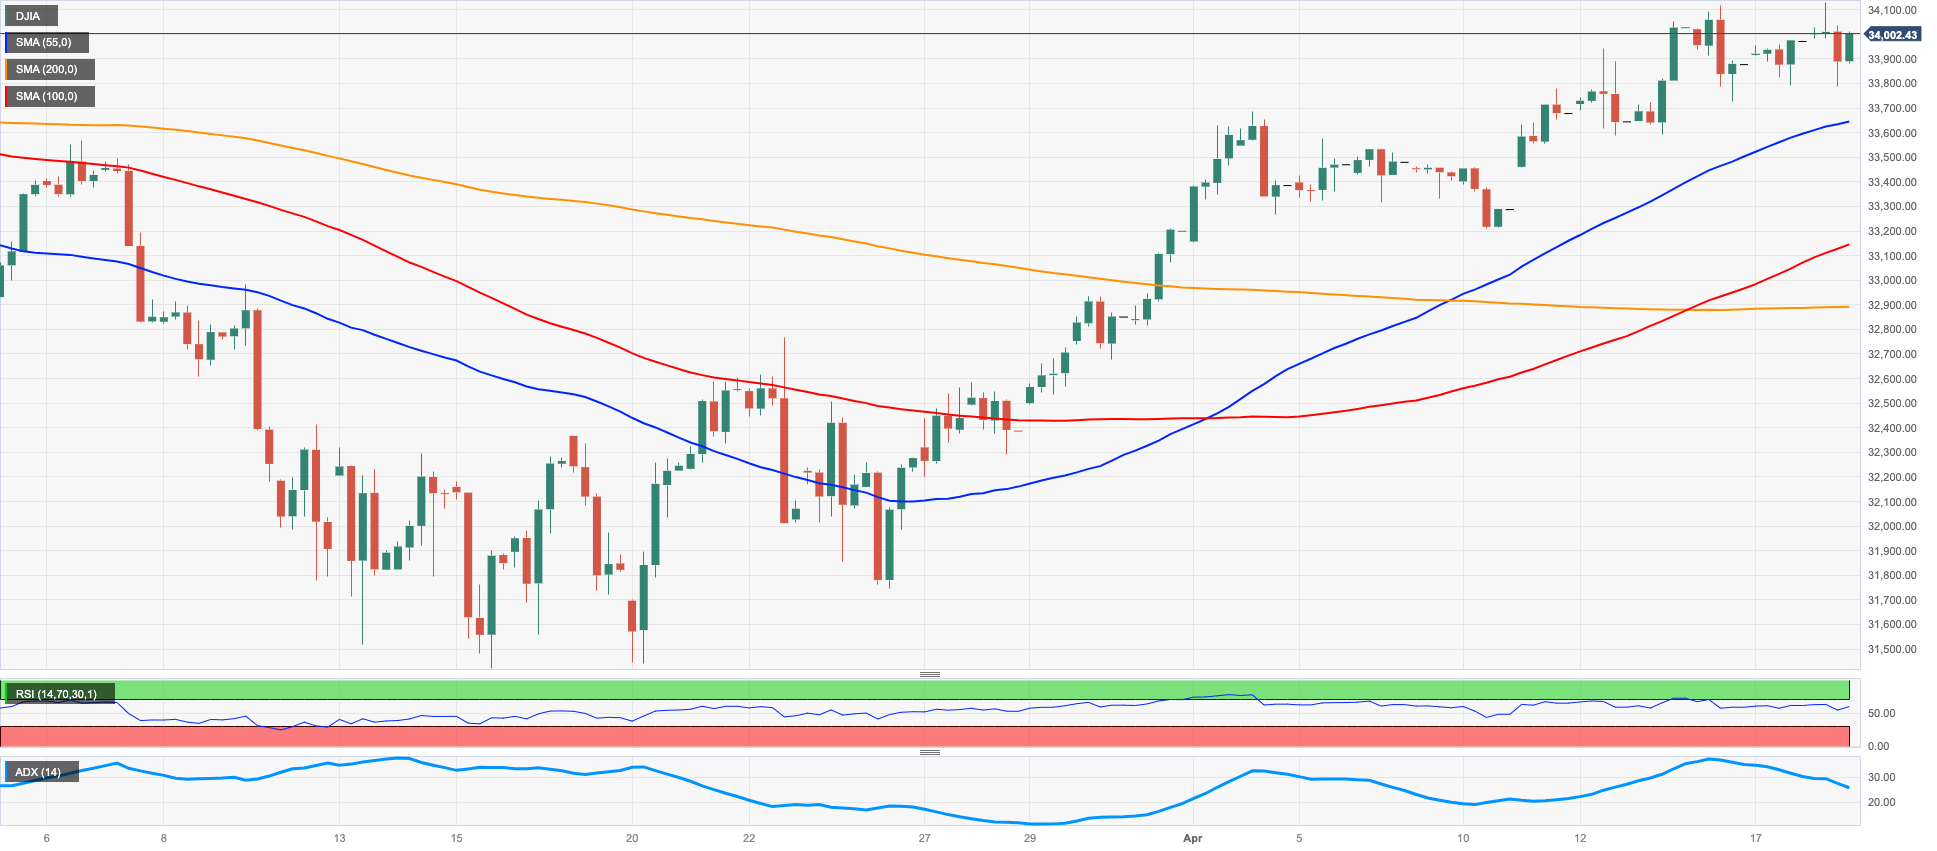
DOW JONES
All three major US stock indices alternated gains with losses amidst broad-based choppy trading on Tuesday.
Indeed, the lack of a clear direction in US equities came on the back of firmer conviction of another 25 bps rate hike by the Fed in May, a view supported (once again) by FOMC’s J. Bullard, while his colleague R. Bostic favoured a pause in the hiking cycle after one more rate raise.
In addition, investors’ disappointment following corporate reports from Goldman Sachs and J&J also played against the continuation of the upside momentum in the reference indices, which nonetheless managed to keep business in the area of 2-month peaks.
Overall, the Dow Jones gained 0.02% to 33992, the S&P500 advanced 0.01% to 4151 and the tech-benchmark Nasdaq Composite dropped 0.14% to 12139.
Extra gains in the Dow Jones face the immediate up-barrier at the April top at 34082 (April 14) ahead of the 2023 peak at 34342 (January 13) and the December 2022 high at 34712 (December 13). The surpass of this level could put a potential test of the April 2022 top at 35492 (April 21) back on the radar prior to the February 2022 peak at 35824 (February 9). On the flip side, the 100- and 55-day SMAs at 33383 and 33181 are expected to offer provisional contention, respectively, before the key 200-day SMA at 32553 and the 2023 low at 31429 (March 15). Down from here turns up the 30000 level seconded by the 2022 low at 28660 (October 13). The daily RSI looked stable around 64.
Top Performers: Boeing, JPMorgan, Home Depot
Worst Performers: J&J, Walgreen Boots, Goldman Sachs
Resistance levels: 34082 34334 34712 (4H chart)
Support levels: 33363 31805 31429 (4H chart)
MACROECONOMIC EVENTS

All Information & Updates provided by:

All information relating to the financial markets available on this page has been prepared and issued by FXStreet (Forexstreet SL, Spain, Reg: B62498233) on the basis of publicly available information and all information believed to be reliable and does not conflict with Kuwaiti local laws, and all necessary care has been taken to before the company to ensure that the facts mentioned are correct from the source.
NCM Investment nor any of its directors or employees shall in any way be held responsible for the contents of this news, and the information contained on this page is intended only to provide clients with publicly available information and should not be construed as investment advice, report or analysis and/or constitute an offer or invitation to buy or sell financial instruments of any kind.
RISK WARNING: Forex and CFDs are highly risky leveraged products, as losses can exceed deposits. Please ensure you understand all the risks and take independent advice if necessary. NCM will segregate the clients based on the criteria of the regulator and its bylaws. NCM does not provide any advisory service; the material published does not constitute advice or a recommendation for a transaction in any financial instrument. NCM accepts no responsibility for any use of the content presented and any consequences of that use. Anyone acting on the information provided does so at their own risk.