
- Contact Us:
-

-

-

-


Daily Market Updates
20 Apr 2023
USDJPY
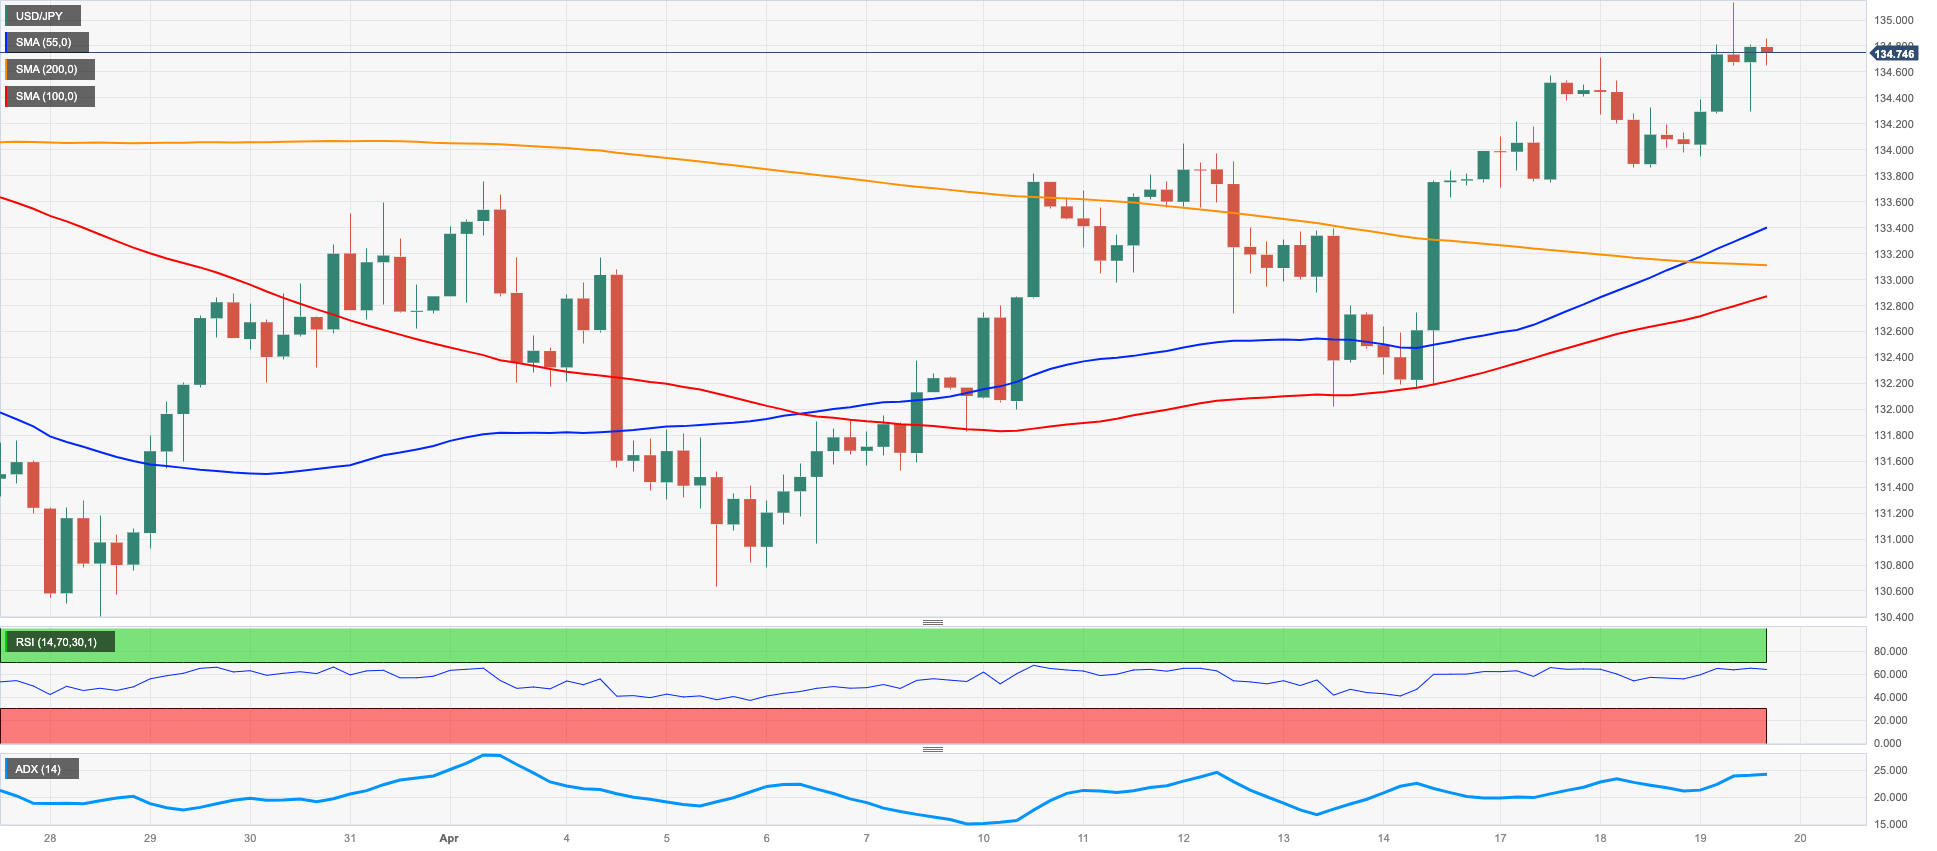
USD/JPY kept the erratic trade well in place on Wednesday, advancing to fresh monthly highs in the 135.10/15 band earlier in the session just to recede to the sub-135.00s soon afterwards.
Daily gains in spot were underpinned by the marked bounce in the greenback as well as the move to new multi-week highs in US yields across the curve. In the Japanese bond market, there was no news around the JGB 10-year yields, which kept the consolidative mood well in place for yet another session.
In Japan, final readings saw the Industrial Production contract 0.5% in the year to February and the Reuters Tankan Index held steady at -3 in April.
USD/JPY printed a new April high at 135.13 (April 19). The breakout of the latter could prompt gains to accelerate and revisit the key 200-day SMA at 137.09 ahead of the 2023 peak at 137.91 (March 8). Once the pair clears the latter, it could challenge weekly highs at 139.89 (November 30 2022) and 142.25 (November 21 2022). On the opposite side, there is provisional contention at the 55-day SMA at 133.37 seconded by the April low at 130.62 (April 5) and the March low at 129.63 (March 24). A deeper retracement could see the February low at 128.08 (February 2) revisited prior to the 2023 low at 127.21 (January 16). The daily RSI regained traction and surpassed the 59 yardstick.
Resistance levels: 135.13 136.99 137.91 (4H chart)
Support levels: 133.20 132.01 130.62 (4H chart)
GBPUSD
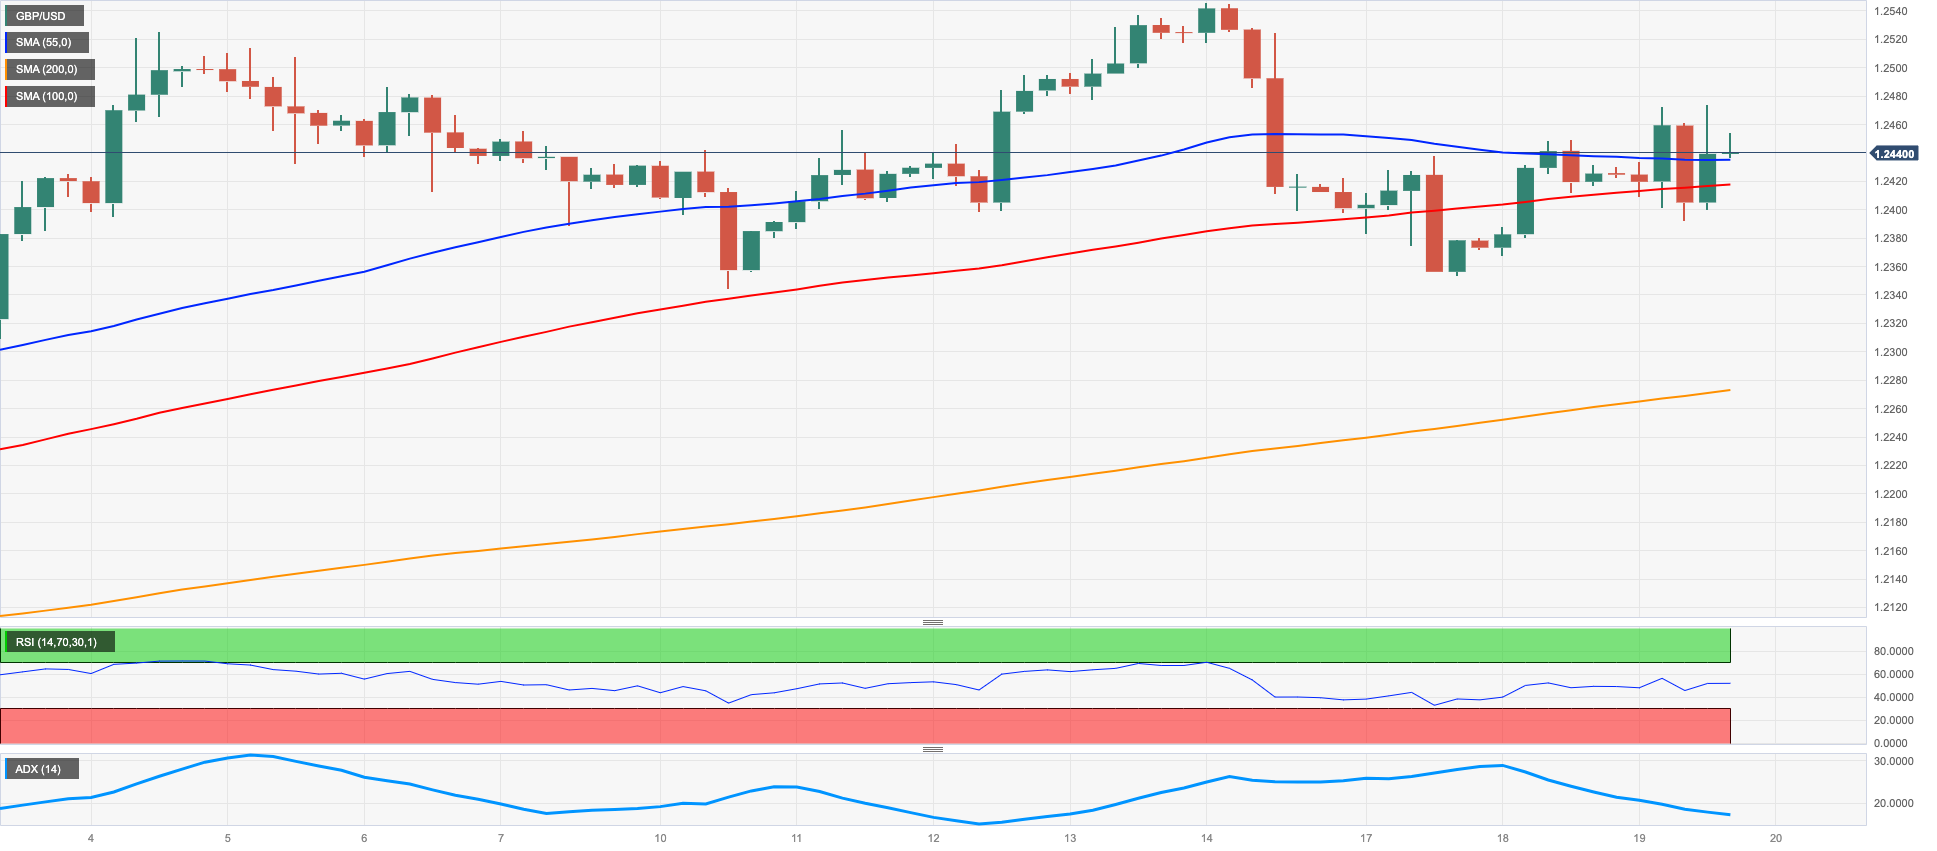
GBP/USD added to Tuesday’s advance and climbed to 3-day highs around the 1.2470 region despite the marked rebound in the dollar.
The firm note in the British pound came on the back of expectations of further tightening by the BoE, which were particularly magnified after the release of UK inflation figures for the month of March.
On the latter, inflation gauged by the headline CPI rose 10.1% from a year earlier (from 10.4%) and the Core CPI probed to be stickier than expected after rising 6.2% over the last twelve months.
Following the publication of the CPI figures, investors now see the BoE hiking rates by 25 bps at the May 11 meeting, while rates are seen peaking around 5.0% in the next months.
Extra gains could motivate GBP/USD to revisit the 2023 peak at 1.2546 (April 14) prior to the May 2022 high at 1.2666 (May 27) and the 200-week SMA at 1.2865, all preceding the psychological 1.3000 yardstick. The other way around, initial support emerges at the weekly low at 1.2344 (April 10) before the April low at 1.2274 (April 3) and the interim 55-day SMA at 1.2183. The loss of this region could open the door to a deeper pullback to the key 200-day SMA at 1.1918 and the 2023 low at 1.1802 (March 8). The daily RSI advanced to the boundaries of the 57 zone.
Resistance levels: 1.2472 1.2546 1.2599 (4H chart)
Support levels: 1.2353 1.2274 1.2263 (4H chart)
AUDUSD
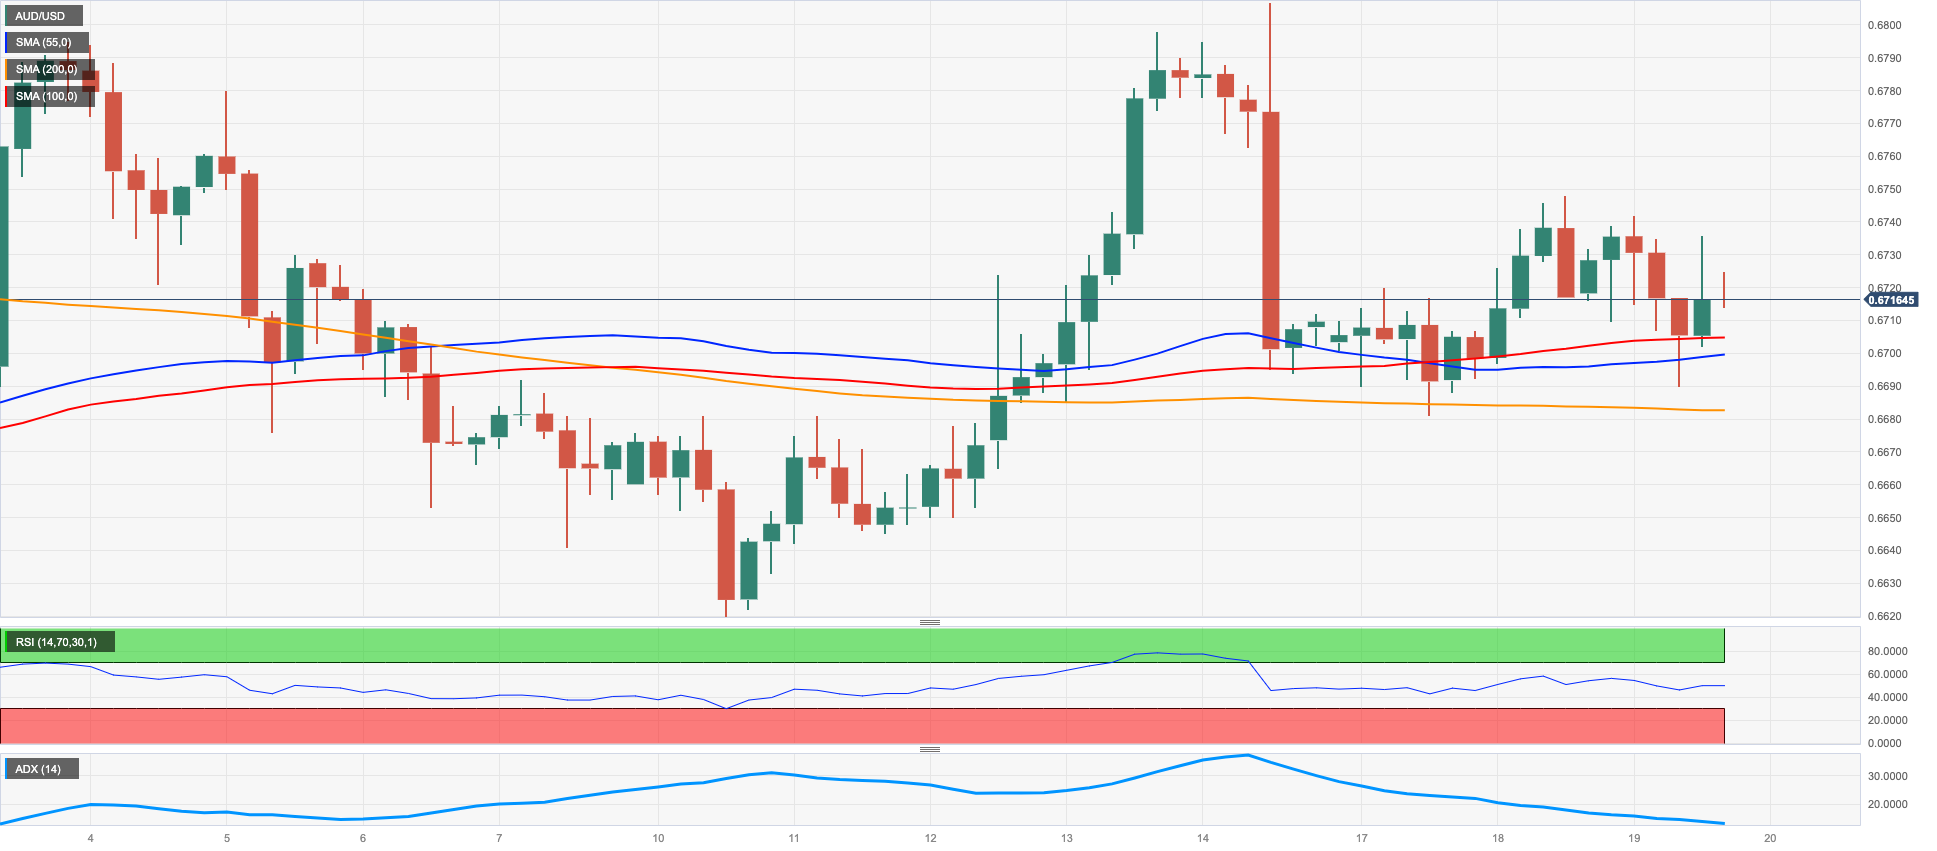
The pick-up in the buying interest around the greenback forced AUD/USD to fade the earlier move the area near the 200-day SMA around 0.6740 on Wednesday.
In fact, the pair reversed part of the previous daily advance, struggling once again to surpass the 0.6740/50 band, a region where weekly highs and the 55- and 200-day SMA all converge.
The mixed performance in the commodity complex saw copper prices give away Tuesday’s gains, while the iron ore added to the previous advance, all somehow limiting the upside potential in the Aussie dollar.
In the Australian calendar, the only release of note showed the Westpac Leading Index contract 0.01% in March.
Next on the upside for AUD/USD appears the April top at 0.6805 (April 14) prior to the key round level at 0.7000. The breakout of this region exposes the weekly peak at 0.7029 (February 14) before the 2023 high at 0.7157 (February 2). By contrast, the April low at 0.6619 (April 10) emerges as the immediate support ahead of the 2023 low at 0.6563 (March 10) and the weekly low at 0.6386 (November 10 2022). If the pair clears this level, it could then put the November 2022 low at 0.6272 (November 3) to the test. The daily RSI deflated below the 51 mark.
Resistance levels: 0.6747 0.6805 0.6920 (4H chart)
Support levels: 0.6684 0.6619 0.6589 (4H chart)
GOLD
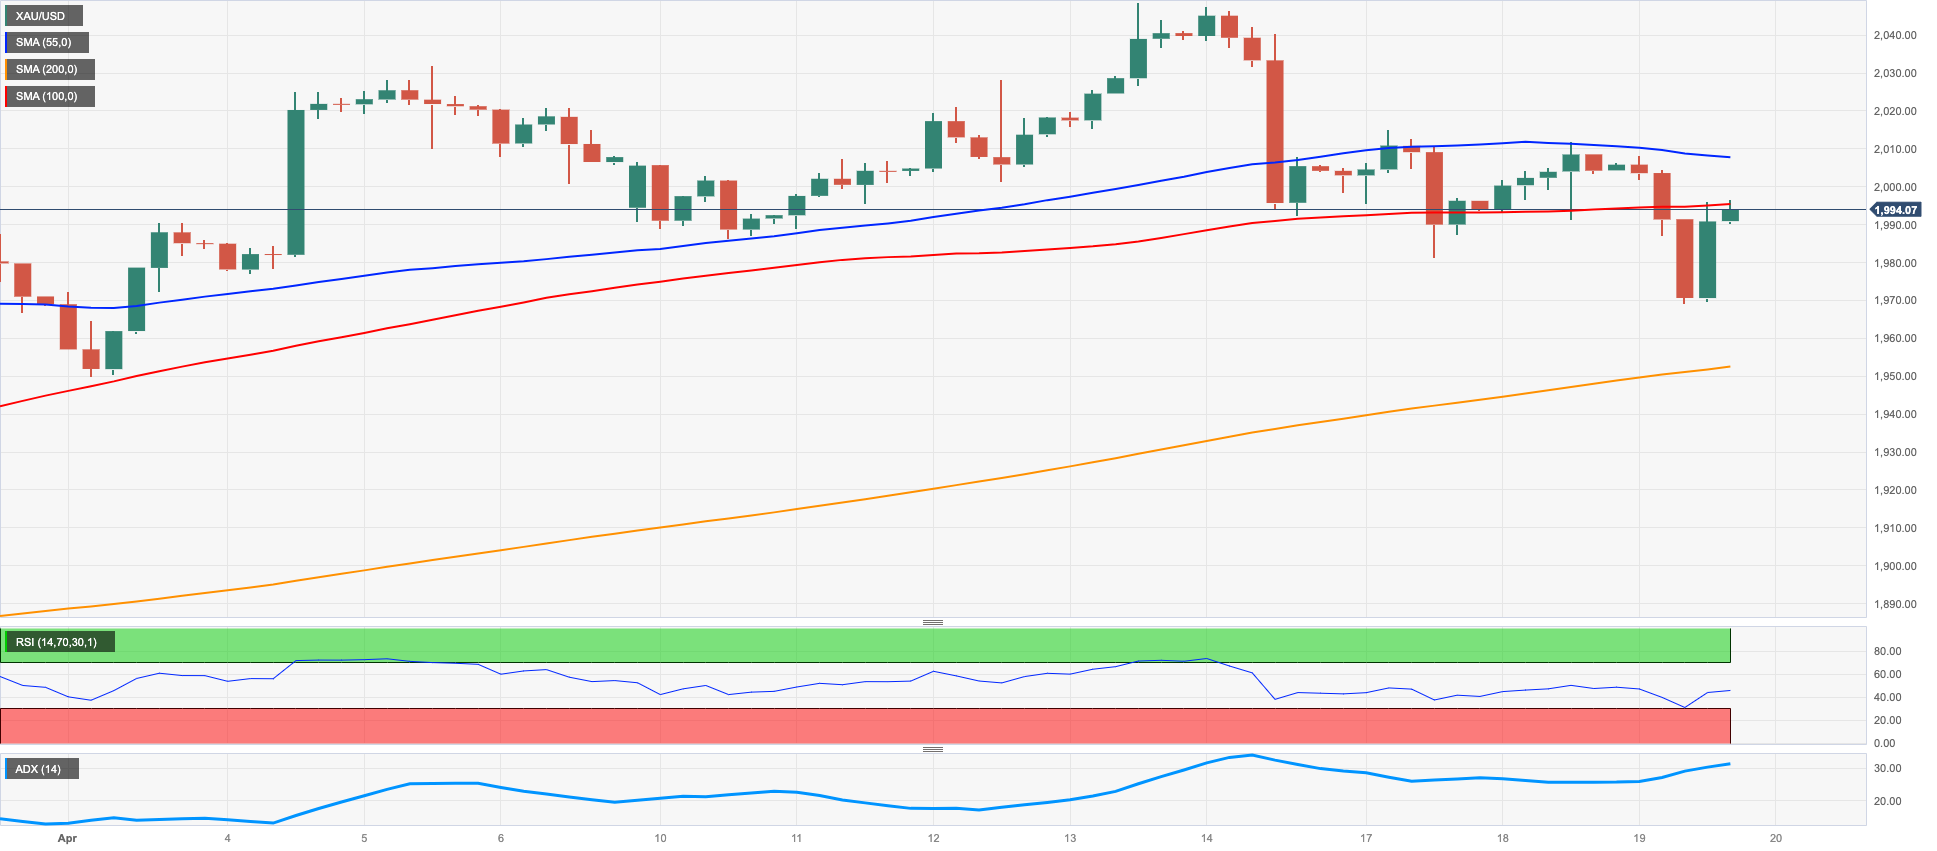
Gold prices dropped to multi-session lows near $1970 in response to the resumption of the buying interest in the greenback and the march higher in US yields on Wednesday.
Indeed, an improved sentiment around the greenback encouraged the USD Index (DXY) to trespass the 102.00 barrier early in the European session, although the uptick lacked follow through and fizzled out afterwards.
Also weighing on the precious metal emerged another solid performance of US yields, which extended the recovery to multi-week peaks across the curve, always propped up by rising conviction of further tightening by the Federal Reserve and the ECB at their meetings in May.
Gold keeps the choppy trade well in place so far this week. Against that, there are no changes to the topside, as occasional bullish attempts should meet the initial resistance level at the 2023 high at $2048 (April 13) ahead of the 2022 top at $2070 (March 8) and just before the all-time peak at $2075 (August 7 2020). To the contrary, there is initial contention at the weekly low at $1969 (April 19) prior to the April low at $1949 (April 3) and another weekly low at $1934 (March 22). The loss of this level could leave the yellow metal vulnerable to extra downside to the 55- and 100-day SMAs at $1912 and $1881, respectively, ahead of the March low at $1809 (March 8) and the 2023 low at $1804 (February 28).
Resistance levels: $2015 $2048 $2070 (4H chart)
Support levels: $1969 $1949 $1938 (4H chart)
SILVER
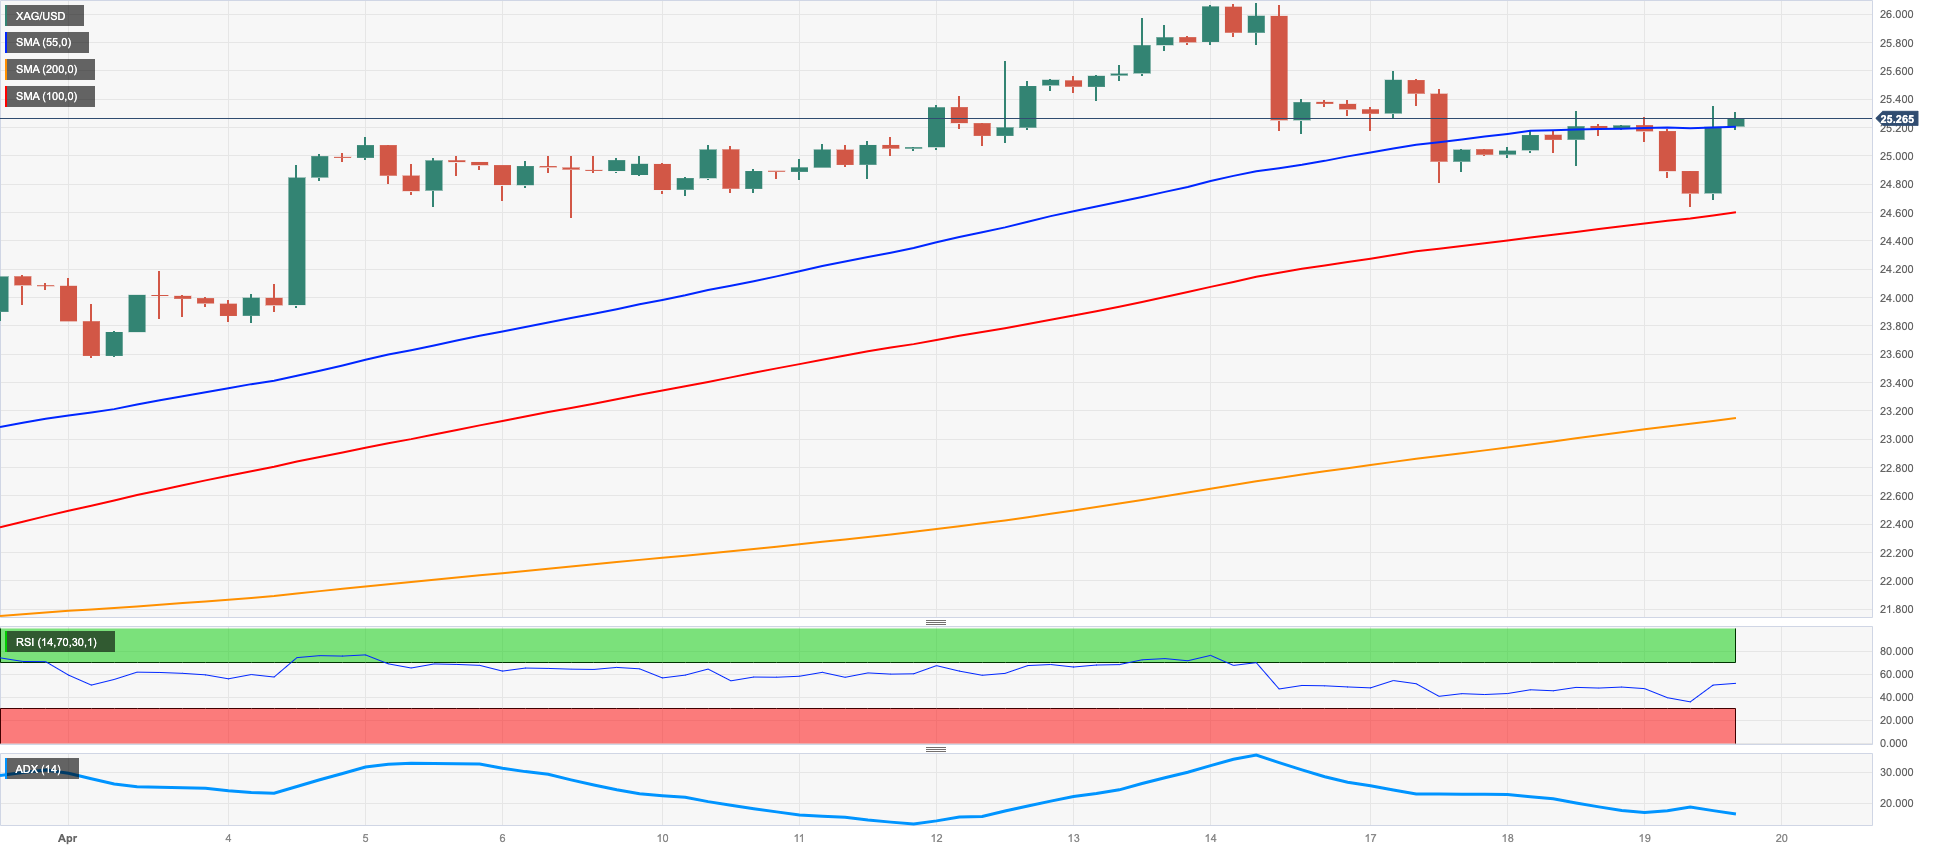
The marked recovery in the greenback could not prevent silver from clinching the second consecutive daily advance on Wednesday, this time reaching 2-day peaks past the $25.30 level.
The move higher in the grey metal also came in contrast to the generalized bearish mood in the commodity complex, while it seems to have found extra legs in the recent positive results from the Chinese calendar. It is worth recalling that the Chinese economy expanded more than expected during the January-March period and appeared to have sparked quite a noticeable recovery in prices of the industrial metals.
Meanwhile, the Gold/Silver Ratio remained under pressure and added to Tuesday’s decline below the 79.00 mar.
Silver bulls now need to clear the 2023 peak at $26.08 (April 14) to allow for a quick test of the April 2022 high at $26.21 (April 18) followed by the 2022 top at $26.94 (March 8) and the round level at $27.00. On the other hand, the weekly low at $24.65 (April 19) comes first ahead of the Fibo retracement of the March-April rally at $23.72 (38.2%). A drop below this level exposes provisional contention at the 100- and 55-day SMAs at $23.06 and $22.64, respectively, prior to the minor support at $21.47 (March 16) and the key 200-day SMA at $21.35. Down from here aligns the 2023 low at $19.92 (March 8).
Resistance levels: $25.34 $25.60 $26.08 (4H chart)
Support levels: $24.65 $23.54 $23.07 (4H chart)
CRUDE WTI
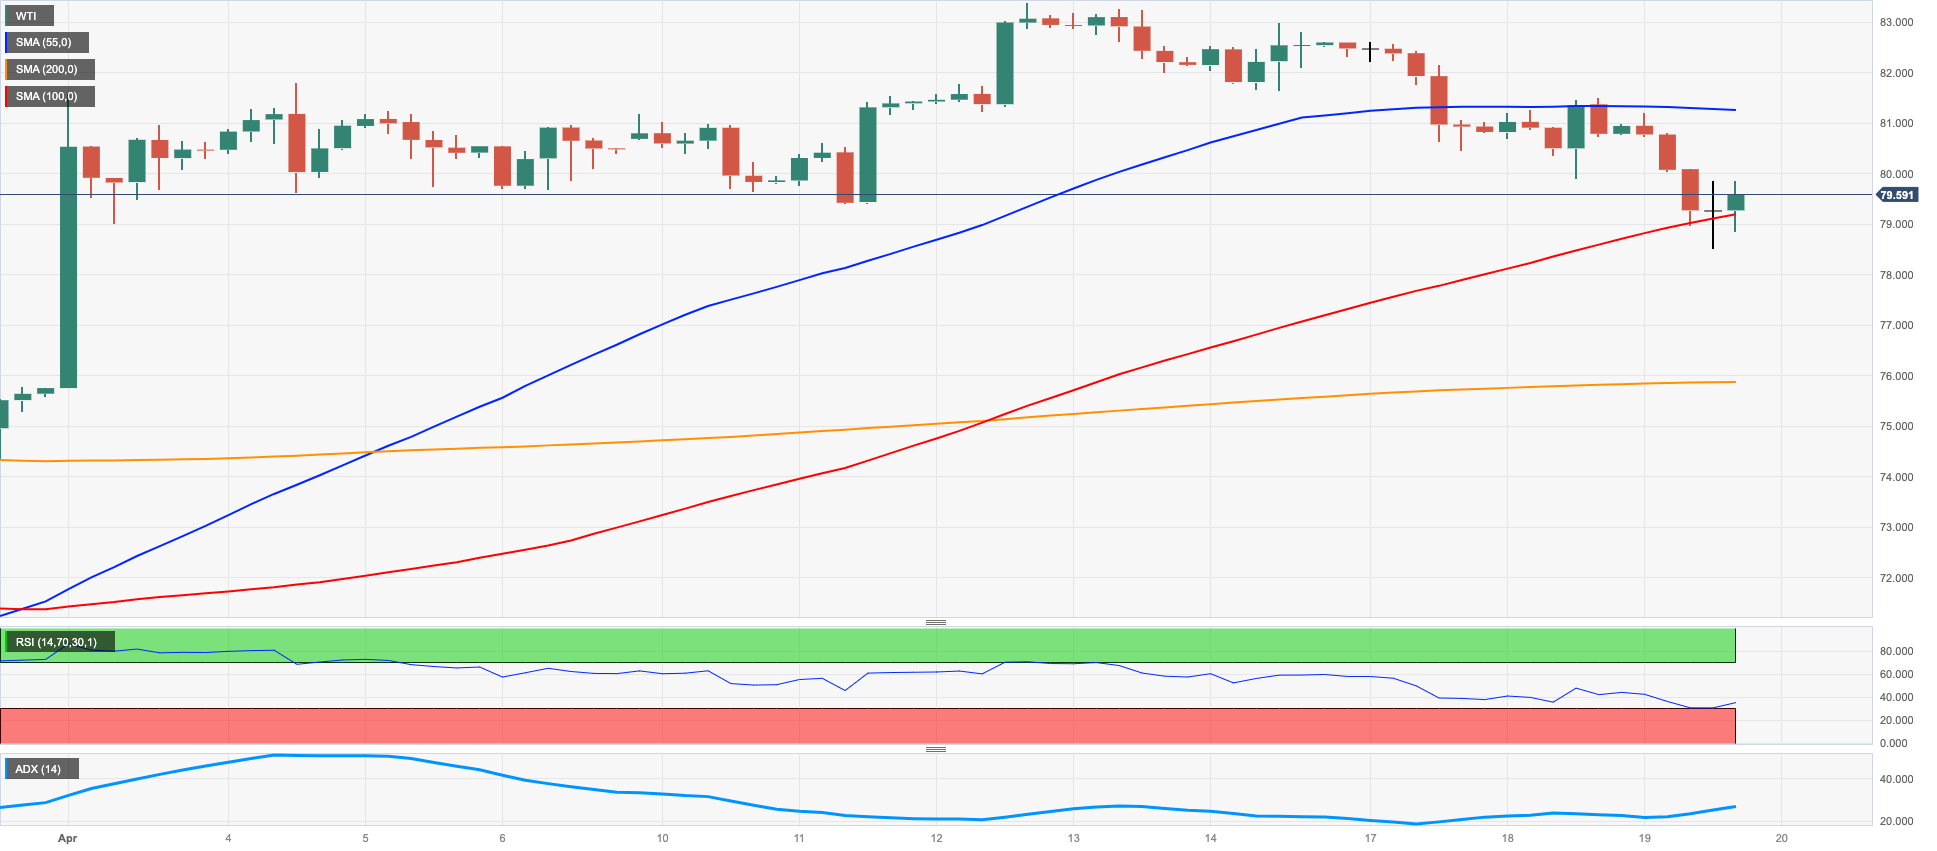
Renewed recession jitters in response to the most likely interest rate increase by the Federal Reserve at its May meeting spooked traders and sponsored the drop to new 3-week lows in prices of the WTI, this time revisiting the area below the $77.00 mark per barrel.
Further downside pressure emerged from the pick-up in the demand for the greenback, which kept the price action in the dollar-dubbed assets depressed on Wednesday.
The downbeat mood around the commodity also ignored the larger-than-expected drop in US crude oil inventories, as reported by EIA. On this, US crude oil inventories dropped by 4.581M barrels in the week to April 14, while supplies at Cushing shrank by 1.088M barrels, Weekly Distillate Stocks went down by 0.356M barrels and gasoline stockpiles unexpectedly increased by 1.300M barrels.
It seems the WTI has started to fill the post-OPEC+ gap recorded in early April. That said, further downside could face interim contention at the 100- and 55-day SMAs at $76.86 and $76.26, respectively, prior to the $66.86 level (March 24) and the 2023 low at $64.41 (March 20). The breach of the latter could prompt the December 2021 low at $62.46 (December 2) to emerge on the horizon ahead of the key $60.00 mark per barrel. Instead, the commodity should meet the initial up-barrier at the key 200-day SMA at $82.72 quickly followed by the 2023 top at $83.49 (April 12) and the November 2022 peak at $93.73 (November 7).
Resistance levels: $81.52 $83.49 $88.65 (4H chart)
Support levels: $78.58 $75.86 $72.16 4H chart)
GER40
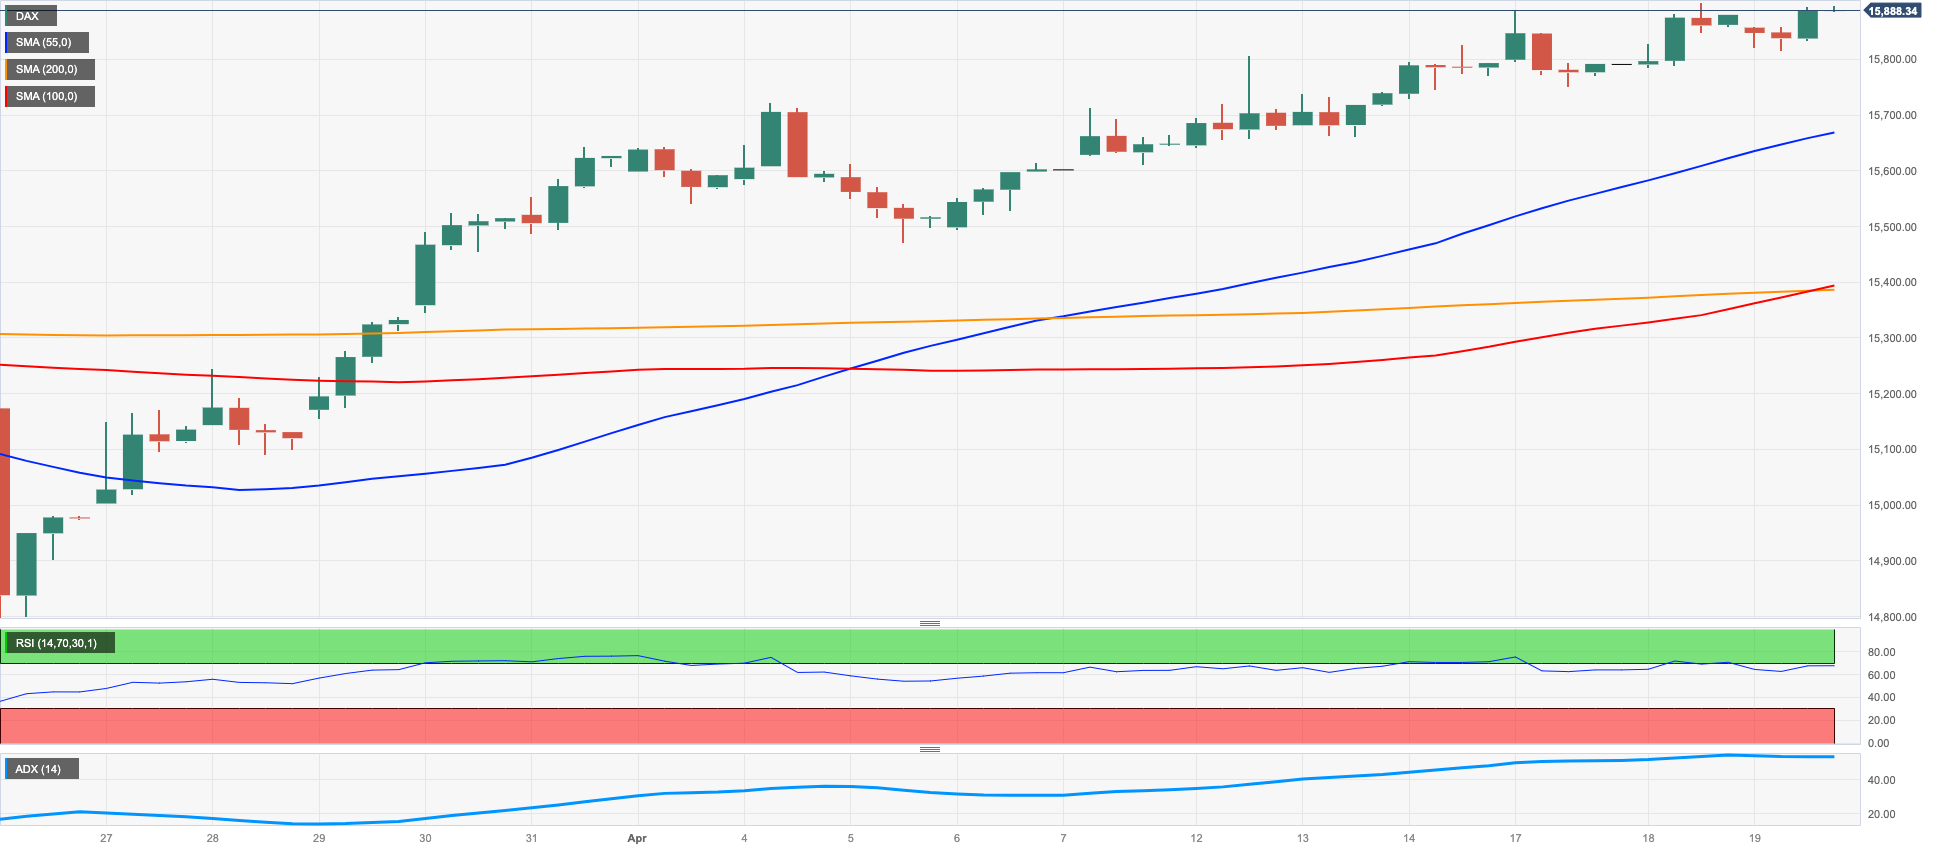
The German benchmark index DAX40 closed with humble gains but seems to have been enough to keep the bullish bias well in place so far this week.
Despite the marginal advance, investors remained cautious following another hot print from UK inflation, which prompted market participants to almost automatically associate further interest rate hikes by the BoE.
In addition, recent hawkish comments from Fed’s rate setters also kept concerns over the Fed’s tighter-for-longer stance in place as well as the almost omnipresent recession fears.
From the German money market, the 10-year Bund yields reached fresh multi-week highs past the 2.55% level, up for the 8th consecutive session.
Immediately to the upside for the DAX40 appears the 2023 top at 15916 (April 18) just ahead of the round level at 16000 and before the 2022 high at 16285 (January 5). On the flip side, the April low at 15482 (April 5) is expected to hold the initial test just ahead of the interim 55- and 100-day SMAs at 15400 and 15002, respectively. Further weakness below this region could confront the minor support at 14809 (March 24) prior to the March low at 14458 (March 20) and the key 200-day SMA at 14087. The daily RSI trespassed the 65 barrier.
Best Performers: Commerzbank, Brenntag AG, Hannover Rueck SE
Worst Performers: Infineon, Daimler Truck Holding, MTU Aero
Resistance levels: 15916 16090 16285 (4H chart)
Support levels: 15482 15345 14809 (4H chart)
NASDAQ
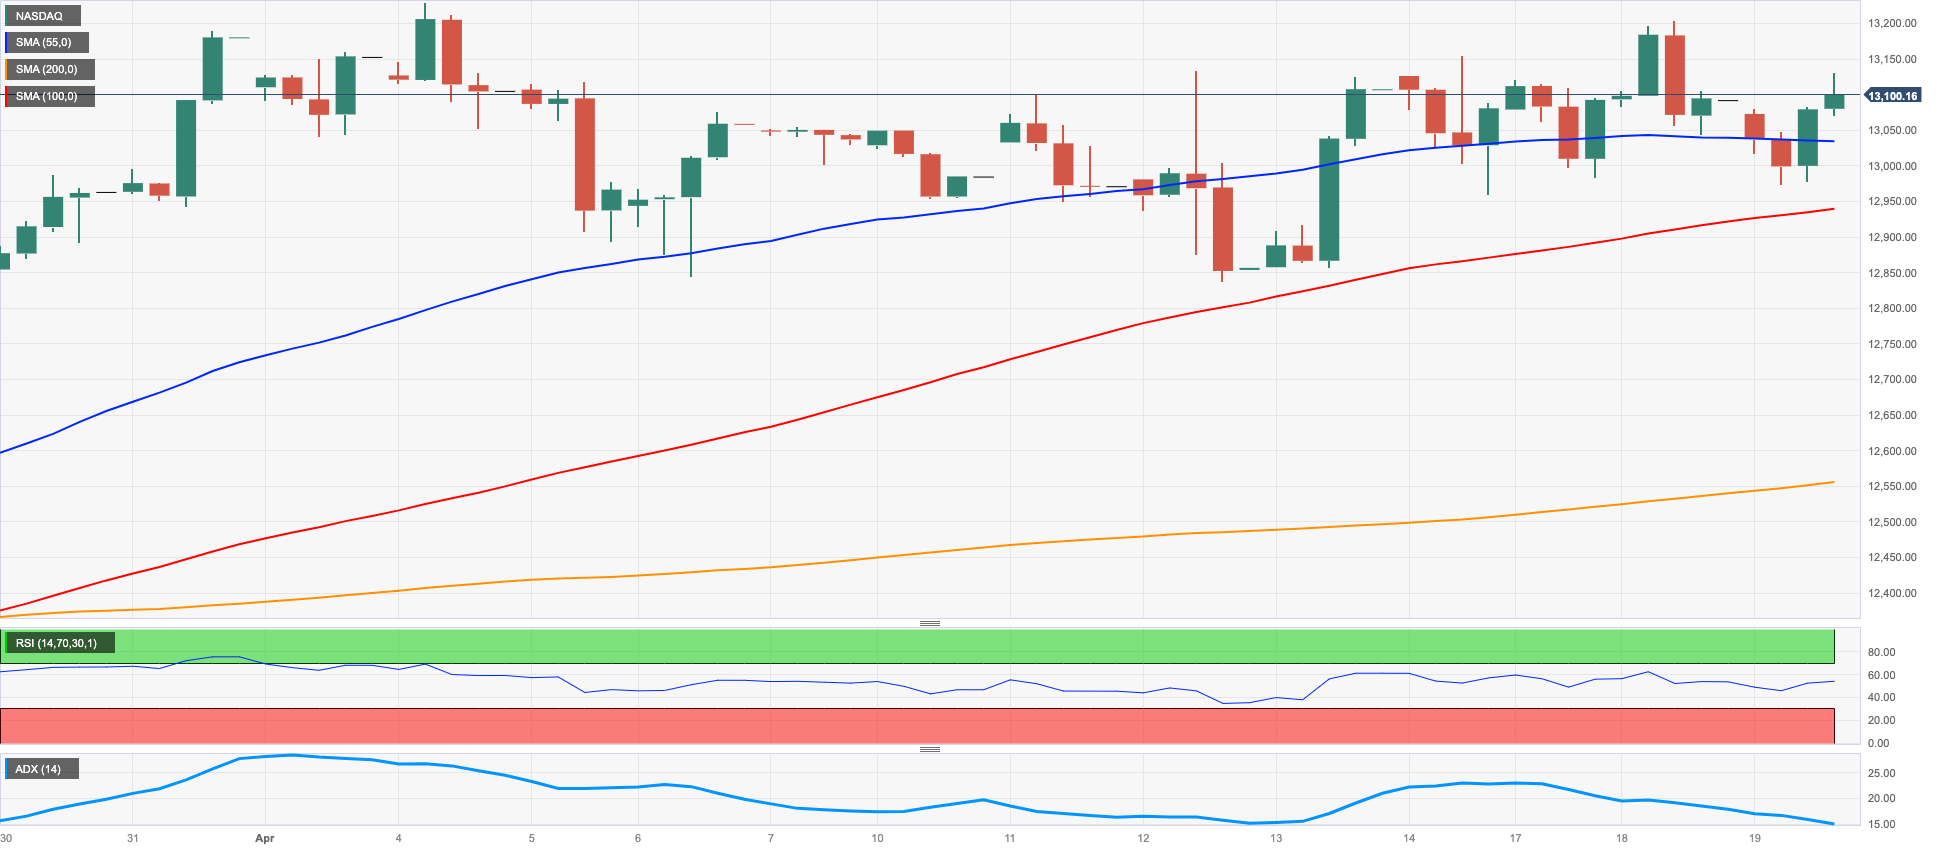
Tech equities tracked by the Nasdaq 100 managed to advance modestly despite higher US yields and the marked bounce in the dollar on Wednesday, reclaiming at the same time the area beyond the 13000 mark.
In addition, the index seems to have practically ignored the persistent recession worries and the generalized bearish mood in the rest of the US markets, where market participants remained concerned over the already anticipated 25 bps rate hike by the Fed at the May 3 event.
The Nasdaq 100 remains at shouting distance from the 2023 peak at 13204 (April 4). Once this level is cleared, the index could dispute the August 2022 high at 13720 (August 16) ahead of the round level at 14000 and the March 2022 high at 15265 (March 29). Just the opposite, the initial magnet for bears appears at the April low at 12846 (April 6) prior to the weekly low at 12517 (March 28), which remains underpinned by the interim 55-day SMA. The breakdown of the latter could motivate a probable test of the key 200-day SMA at 12016 to emerge on the horizon before the March low at 11695 (March 13) and weekly lows at 11550 (January 25) and 11251 (January 19). Further down comes the 2023 low at 10696 (January 6). The daily RSI climbed above the 61 hurdle.
Top Gainers: Intuitive Surgical, Baker Hughes, DexCom
Top Losers: Rivian Automotive, Cisco, Netflix
Resistance levels: 13204 13720 14277 (4H chart)
Support levels: 12833 12517 12032 (4H chart)
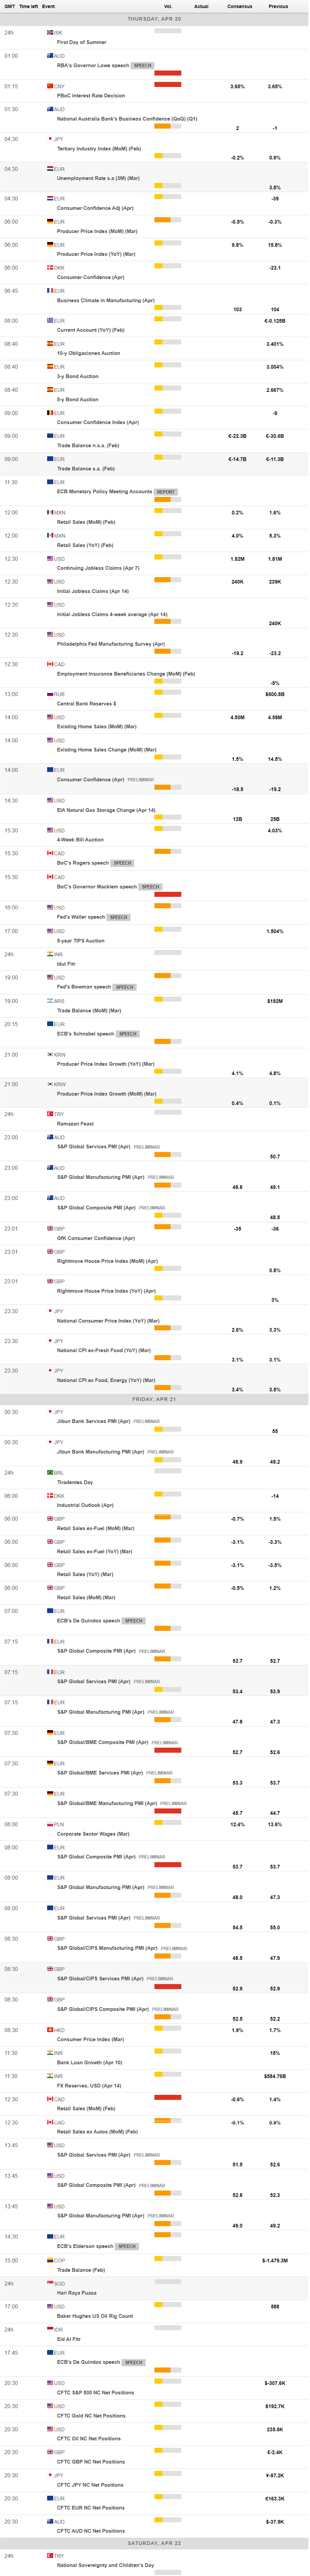
MACROECONOMIC EVENTS
All Information & Updates provided by:

All information relating to the financial markets available on this page has been prepared and issued by FXStreet (Forexstreet SL, Spain, Reg: B62498233) on the basis of publicly available information and all information believed to be reliable and does not conflict with Kuwaiti local laws, and all necessary care has been taken to before the company to ensure that the facts mentioned are correct from the source.
NCM Investment nor any of its directors or employees shall in any way be held responsible for the contents of this news, and the information contained on this page is intended only to provide clients with publicly available information and should not be construed as investment advice, report or analysis and/or constitute an offer or invitation to buy or sell financial instruments of any kind.
RISK WARNING: Forex and CFDs are highly risky leveraged products, as losses can exceed deposits. Please ensure you understand all the risks and take independent advice if necessary. NCM will segregate the clients based on the criteria of the regulator and its bylaws. NCM does not provide any advisory service; the material published does not constitute advice or a recommendation for a transaction in any financial instrument. NCM accepts no responsibility for any use of the content presented and any consequences of that use. Anyone acting on the information provided does so at their own risk.