
- Contact Us:
-

-

-

-


Daily Market Updates
21 Apr 2023
USDJPY
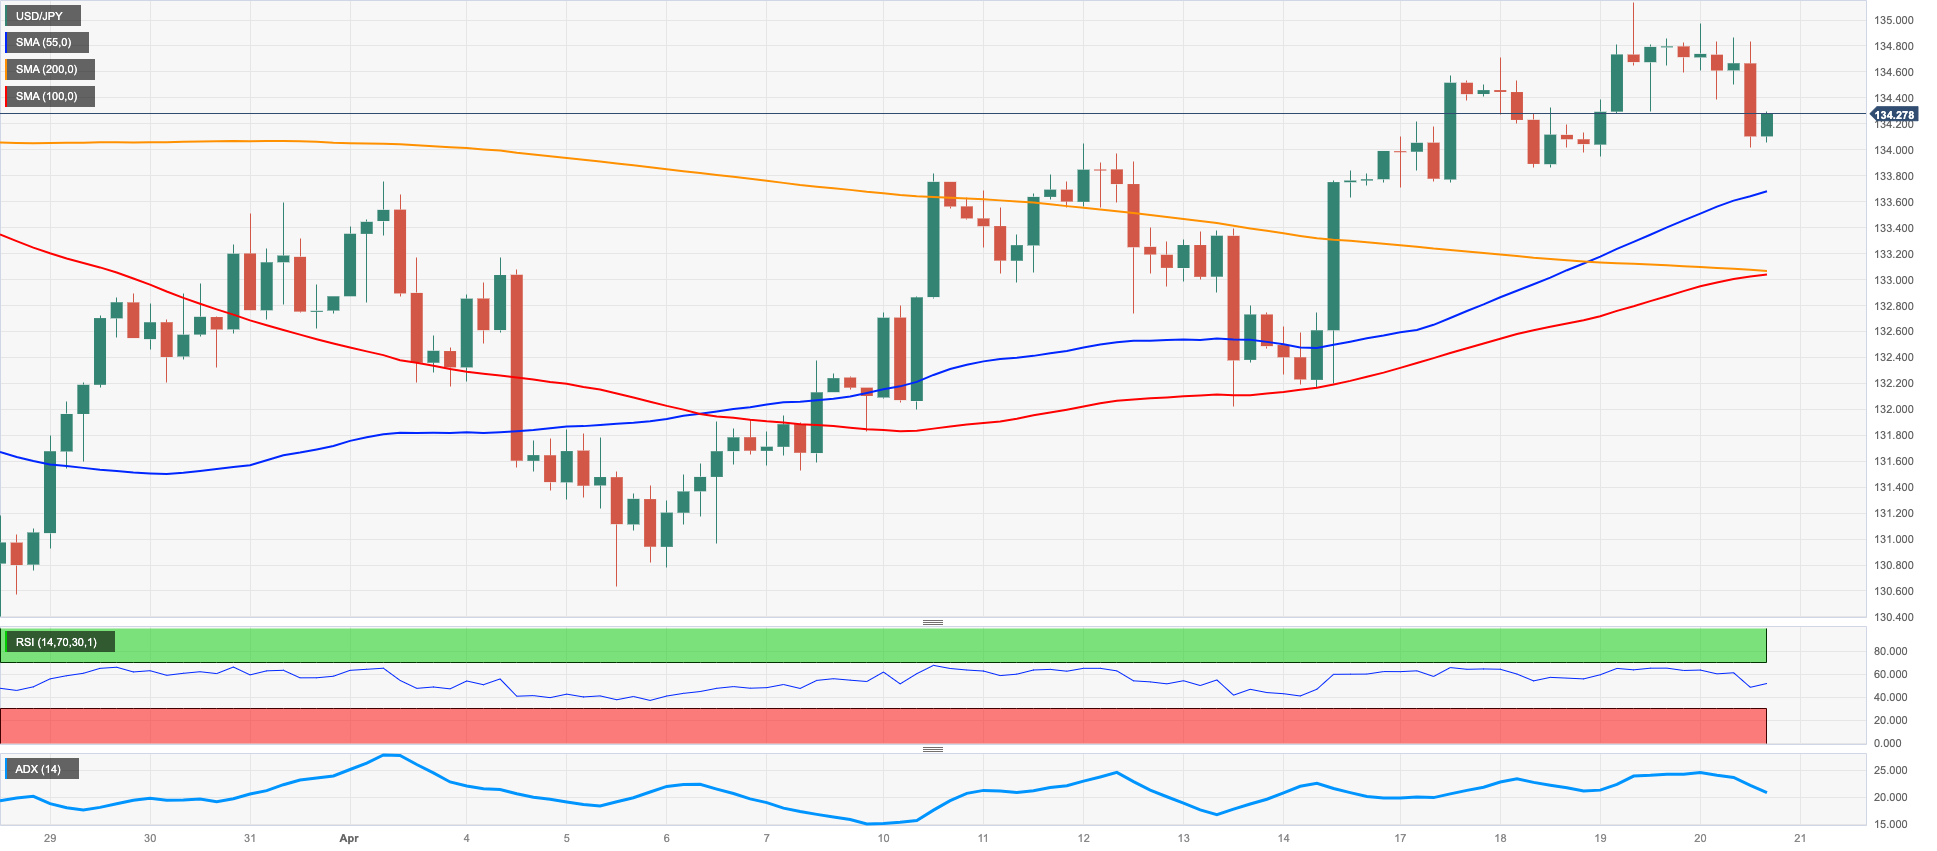
The prevailing downside pressure in the greenback in combination with the generalized retracement in US yields put USD/JPY under pressure on Thursday.
Indeed, the pair reversed Wednesday’s advance to fresh monthly high past the 135.00 hurdle and returned to the vicinity of the 134.00 neighbourhood following the knee-jerk in the buck and yields.
In the Japanese money market, the JGB 10-year yields attempted a move higher and poked with the key 0.50% region.
In Japan, Foreign Bond Investment increased to ¥500.2B in the week to April 15, while the trade deficit narrowed to ¥754.5B in March and the Tertiary Industry Index gained 0.7% MoM in February.
Once USD/JPY clears the April top at 135.13 (April 19) it should then set sail to the key 200-day SMA at 137.07 prior to the 2023 high at 137.91 (March 8). The breakout of this level could prompt weekly tops at 139.89 (November 30 2022) and 142.25 (November 21 2022) to re-emerge on the horizon. The other way around, the 55- and 100-day SMAs at 133.47 and 132.98, respectively, are expected to emerge as temporary contention before the April low at 130.62 (April 5) and the March low at 129.63 (March 24). The breach of the latte exposes the February low at 128.08 (February 2) seconded by the 2023 low at 127.21 (January 16). The daily RSI weakened to the 56 region.
Resistance levels: 135.13 136.99 137.91 (4H chart)
Support levels: 133.86 133.16 132.01 (4H chart)
GBPUSD
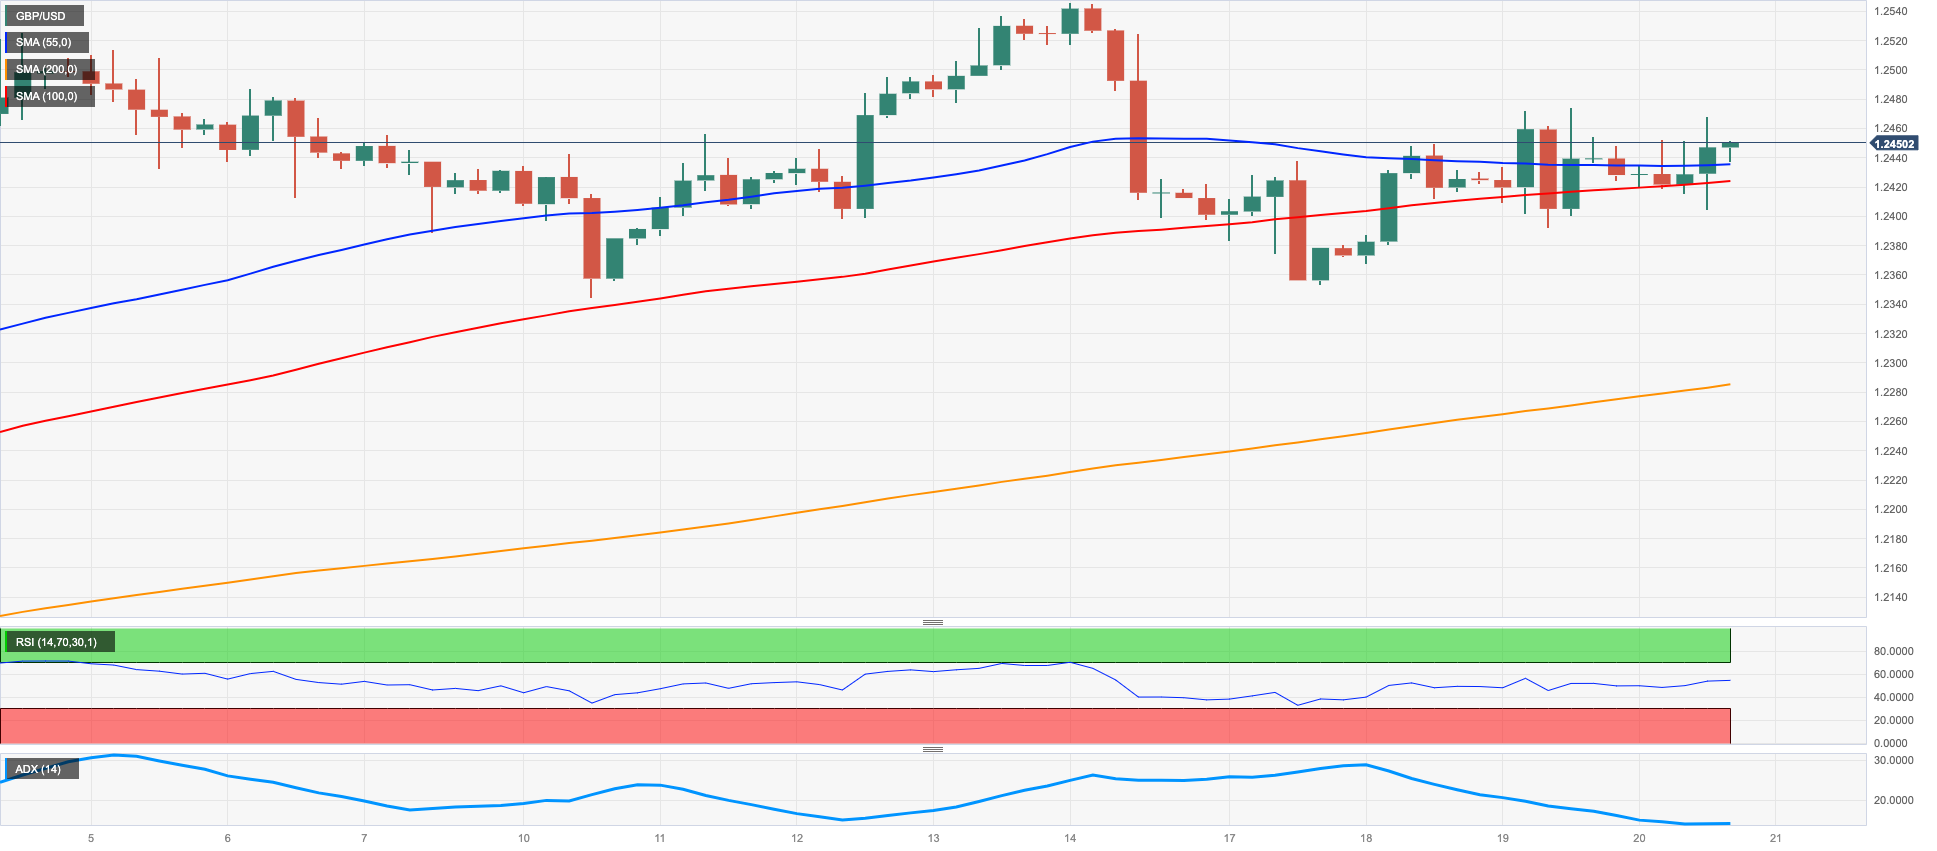
The weekly recovery in the Sterling remained well in place for the third session in a row and GBP/USD approached once again the 1.2460 on Thursday.
The move higher in Cable, in the meantime, was accompanied by the renewed loss of momentum in the greenback, which remained side-lined and faded the previous daily gain when tracked by the USD Index (DXY).
In line with the rest of the bond markets, UK 10-year Gilt yields dropped below the 2.50% region and snapped a 4-day positive streak on Thursday.
There were no data releases in the UK calendar.
The continuation of the bid bias could put GBP/USD en route to retest the 2023 high at 1.2546 (April 14). The surpass of this level could pave the way for a potential move to the May 2022 top at 1.2666 (May 27) seconded by the 200-week SMA at 1.2865 and the psychological 1.3000 mark. On the contrary, the weekly low at 1.2344 (April 10) should offer initial contention ahead of the April low at 1.2274 (April 3) and the provisional 55-day SMA at 1.2187. Further south emerges the key 200-day SMA at 1.1921 prior to the 2023 low at 1.1802 (March 8). The daily RSI ticked higher and flirted with the 58 zone.
Resistance levels: 1.2474 1.2546 1.2599 (4H chart)
Support levels: 1.2353 1.2274 1.2263 (4H chart)
AUDUSD
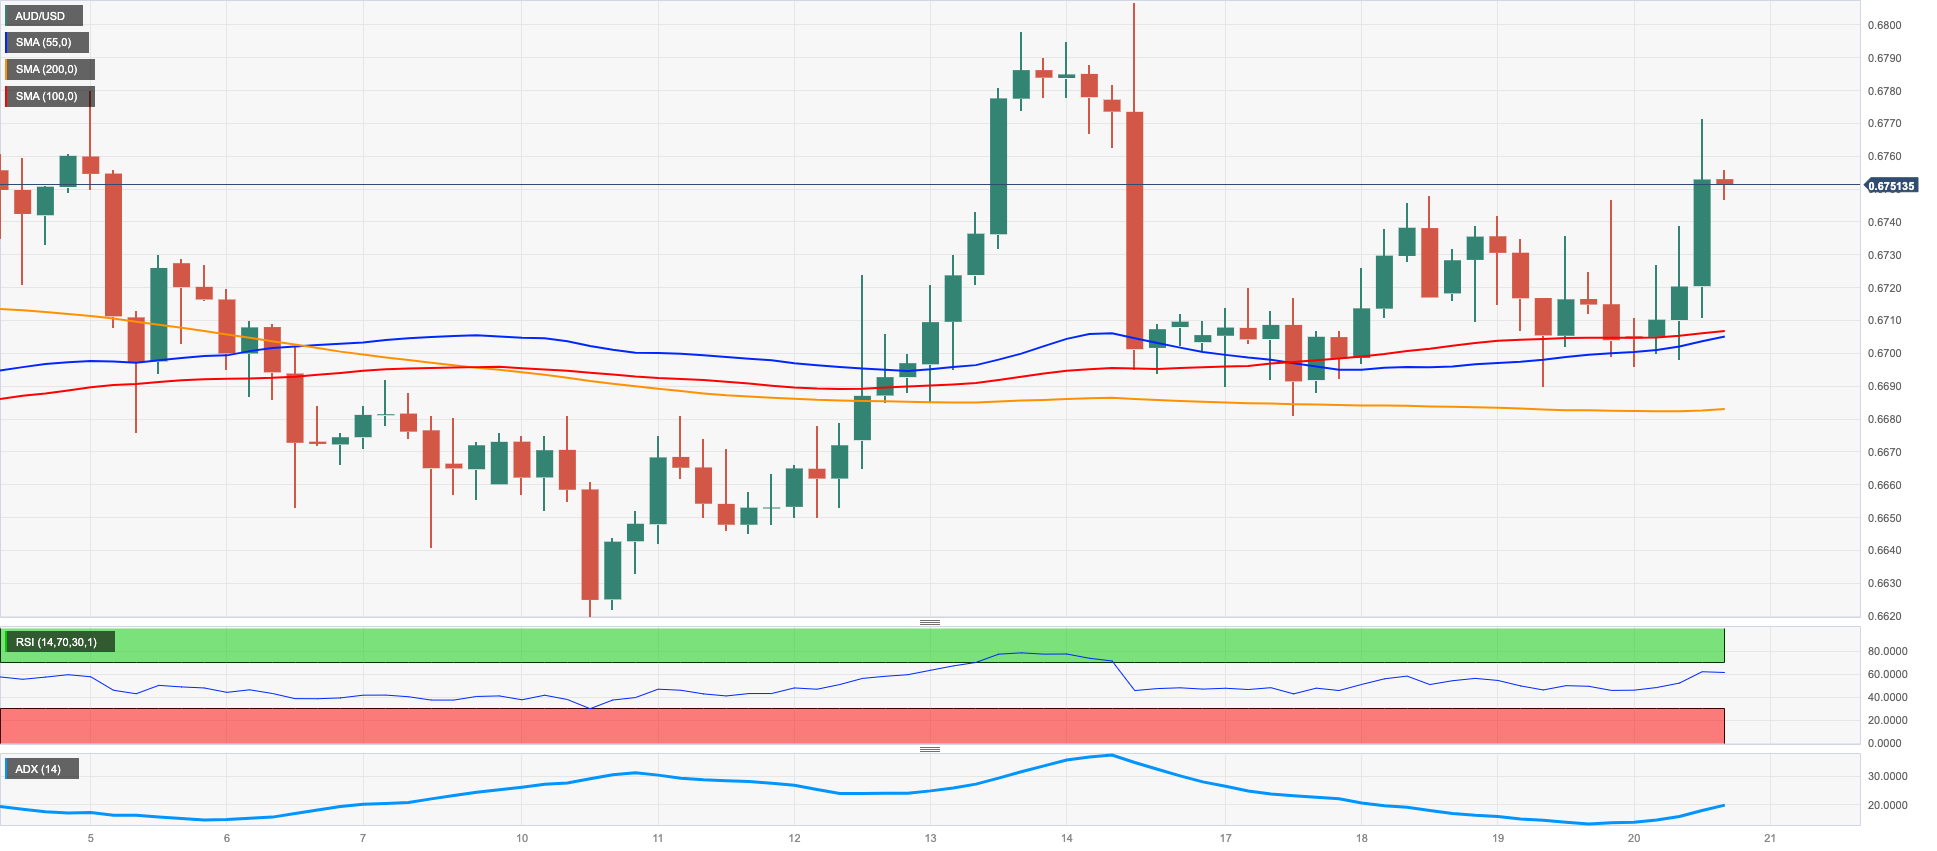
The Aussie dollar found a good reason to attempt a breakout of the weekly consolidation in the renewed weakness around the greenback on Thursday.
On this, AUD/USD climbed to multi-session highs and revisited the 0.6760 region exclusively on the back of the knee-jerk in the dollar and despite the broad-based bearish performance of the commodity complex.
In what was the only release of note Down Under, the RBA Review called for 8 monetary policy meetings per year (instead of the current 11), all followed by a press conference explaining the policy decisions. The Review also favoured maintaining the current inflation targeting regime.
AUD/USD broke above the key 200-day SMA, and in doing so it opened the door to further upside in the near term. Against that, the immediate up-barrier aligns at the April peak at 0.6805 (April 14) seconded by the key round level at 0.7000 and the weekly high at 0.7029 (February 14), all preceding the 2023 top at 0.7157 (February 2). On the opposite side, initial support appears at the April low at 0.6619 (April 10) prior to the 2023 low at 0.6563 (March 10) and the weekly low at 0.6386 (November 10 2022). Extra losses from here could revisit the November 2022 low at 0.6272 (November 3). The daily RSI leapt past the 54 hurdle.
Resistance levels: 0.6766 0.6805 0.6920 (4H chart)
Support levels: 0.6683 0.6619 0.6589 (4H chart)
GOLD
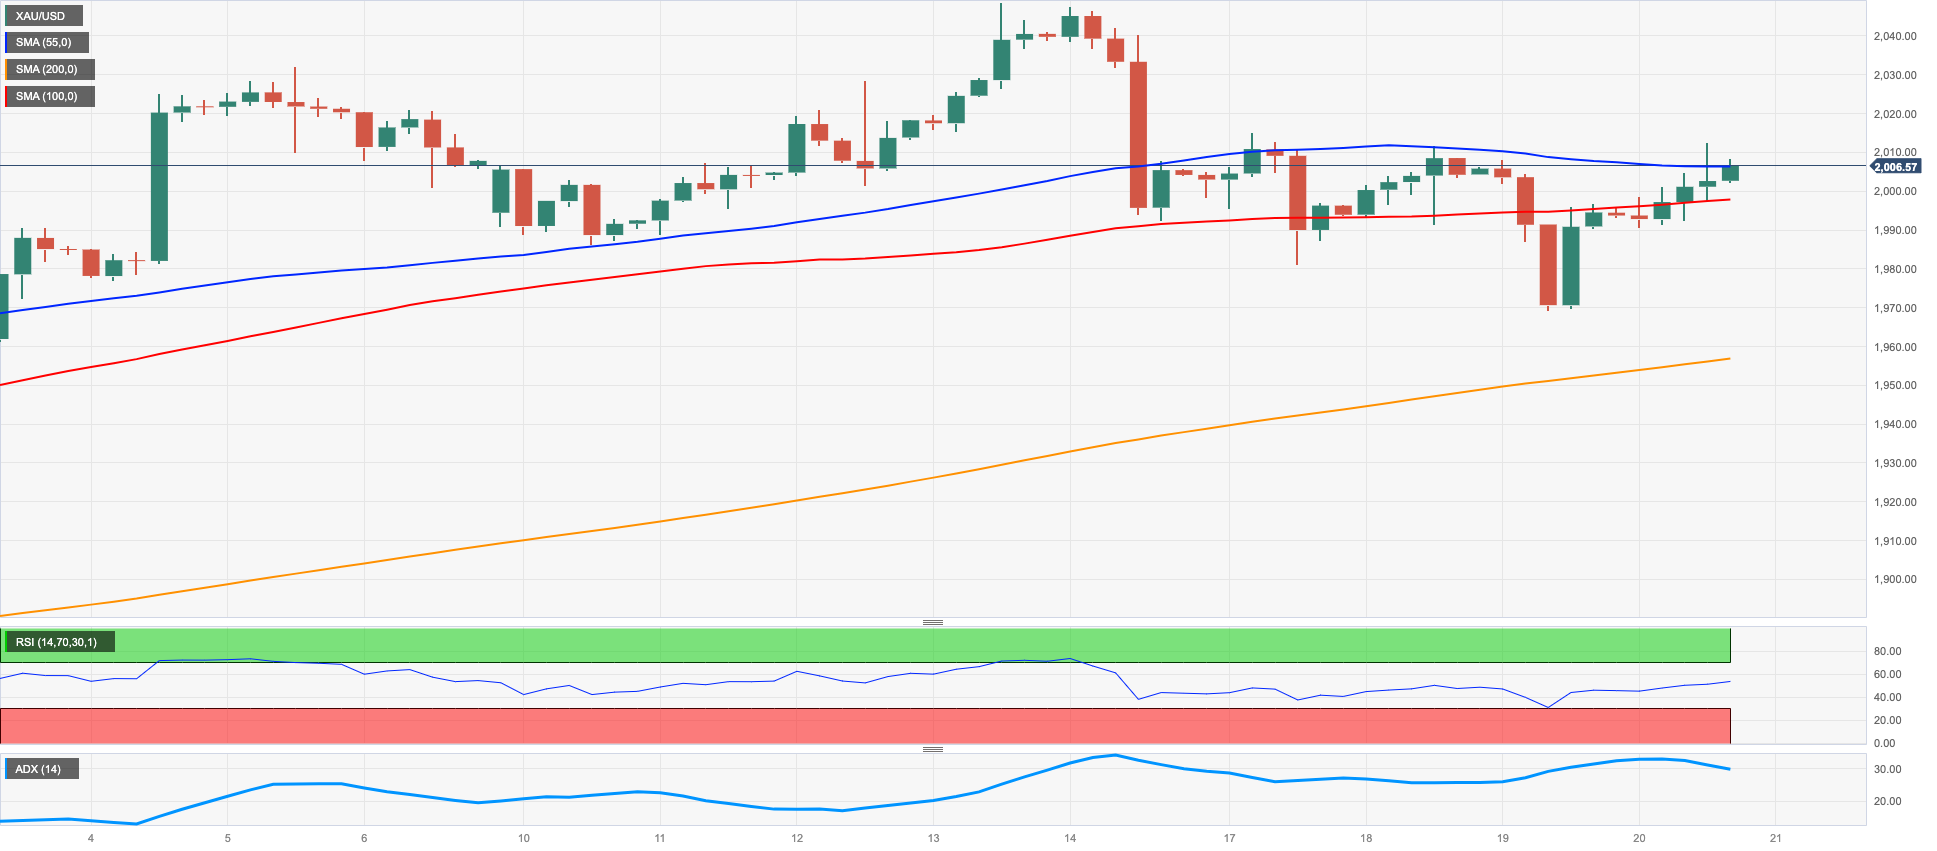
Prices of the ounce troy of the yellow metal regained the smile and set aside Wednesday’s pullback, reclaiming at the same time the area above the key $2000 mark on Thursday.
The resumption of the selling pressure in the dollar lent support to the daily bounce in the precious metal, while the knee-jerk in US yields across the curve also lent fresh upside impulse to bullion.
Looking at the broader picture, the precious metal should continue to closely follow the next steps by the Federal Reserve when it comes to its normalization process, as investors seem to maintain the view of a likely pause following the 25 bps rate hike (already anticipated) at the May gathering.
Once gold breaks above the current consolidative theme, it should re-shift the attention to the 2023 top at $2048 (April 13) prior to the 2022 peak at $2070 (March 8) and ahead of the all-time high at $2075 (August 7 2020). By contrast, sellers are expected to meet initial support at the weekly low at $1969 (April 19) seconded by the April low at $1949 (April 3) and another weekly low at $1934 (March 22). South from here emerges the 55- and 100-day SMAs at $1913 and $1884, respectively, prior to the March low at $1809 (March 8) and the 2023 low at $1804 (February 28).
Resistance levels: $2015 $2048 $2070 (4H chart)
Support levels: $1969 $1949 $1938 (4H chart)
CRUDE WTI
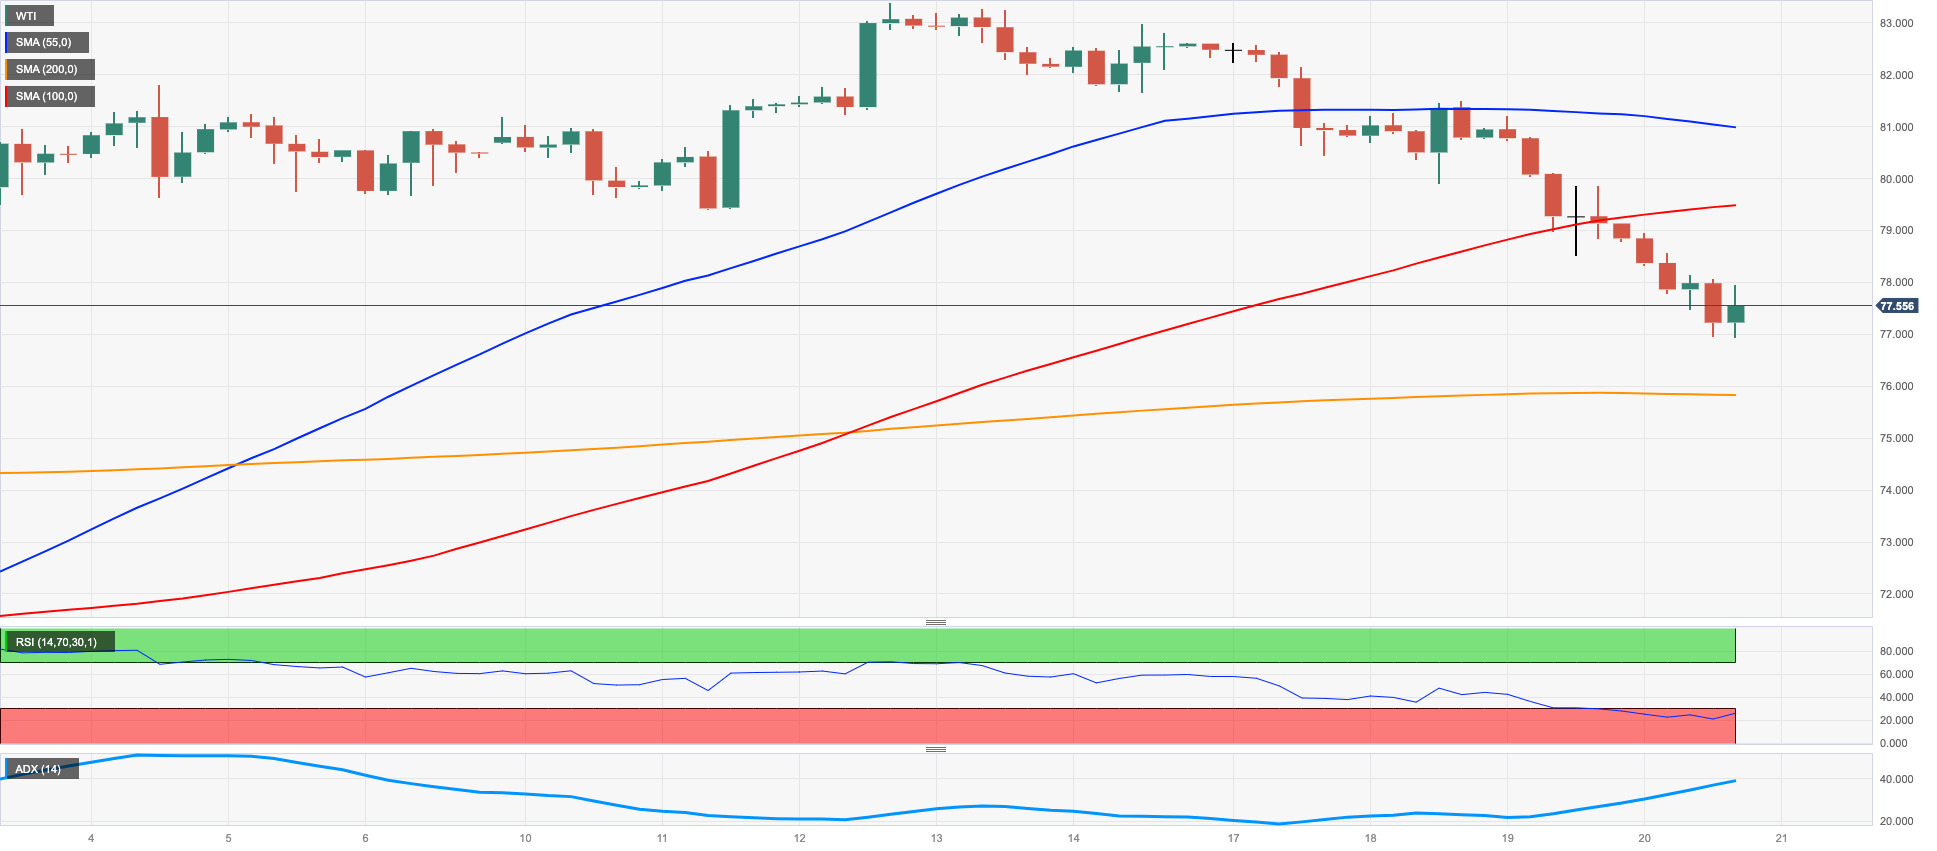
Prices of the American benchmark for the sweet light crude oil dropped to multi-day lows around the $77.00 mark per barrel on Thursday, an area also coincident with the 100-day SMA.
Indeed, the third consecutive daily pullback in prices of the WTI came in tandem with persistent recession concerns among investors, which remained bolstered by loss of momentum in US fundamentals as of late, while the unabated hawkish narrative from Fed speakers also propped up speculation of a tighter-for-longer stance from the Federal Reserve.
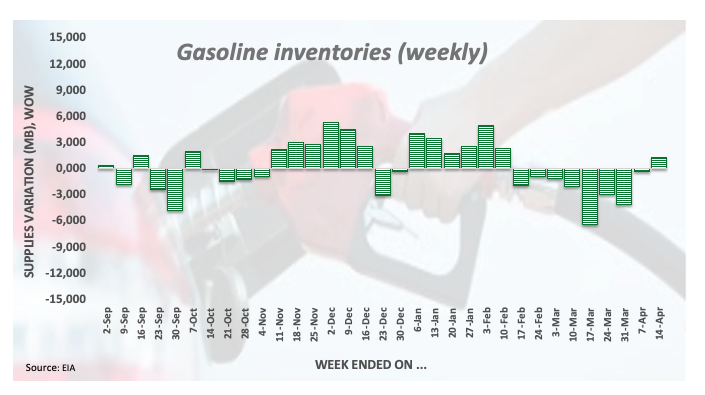
Also weighing on traders’ mood appeared the unexpected increase in gasoline stockpiles, as per Wednesday’s release of the EIA’s weekly report, which eventually added to persevering fears of an economic slowdown.
Prices of the WTI were close to fill the post-OPEC+ gap seen at the beginning of April. Further losses in the commodity are now seen targeting the 55-day SMA at $76.19 ahead of the key $70.00 mark and the $66.86 level (March 24). South from here aligns the 2023 low at $64.41 (March 20) prior to the December 2021 low at $62.46 (December 2) and the key $60.00 mark per barrel. On the other hand, the immediate hurdle emerges at the key 200-day SMA at $82.70 seconded by the 2023 peak at $83.49 (April 12) and the November 2022 high at $93.73 (November 7).
Resistance levels: $81.52 $83.49 $88.65 (4H chart)
Support levels: $77.01 $75.86 $72.16 (4H chart)
GER40
European stocks navigated a “sea of red” on Thursday with the sole exception of the UK benchmark FTSE100, which advanced marginally.
Poor results from the autos sector weighed on investors’ sentiment along with recession worries, which were in turn bolstered by expectations of further interest rate hikes by the ECB, the Fed and the BoE.
Despite speculation of higher interest rates, the 10-year Bund yields snapped 8 sessions with gains and returned to the 2.45% region.
Meanwhile in Germany, Producer Prices contracted at a monthly 2.6% in March and rose 7.5% from a year earlier.
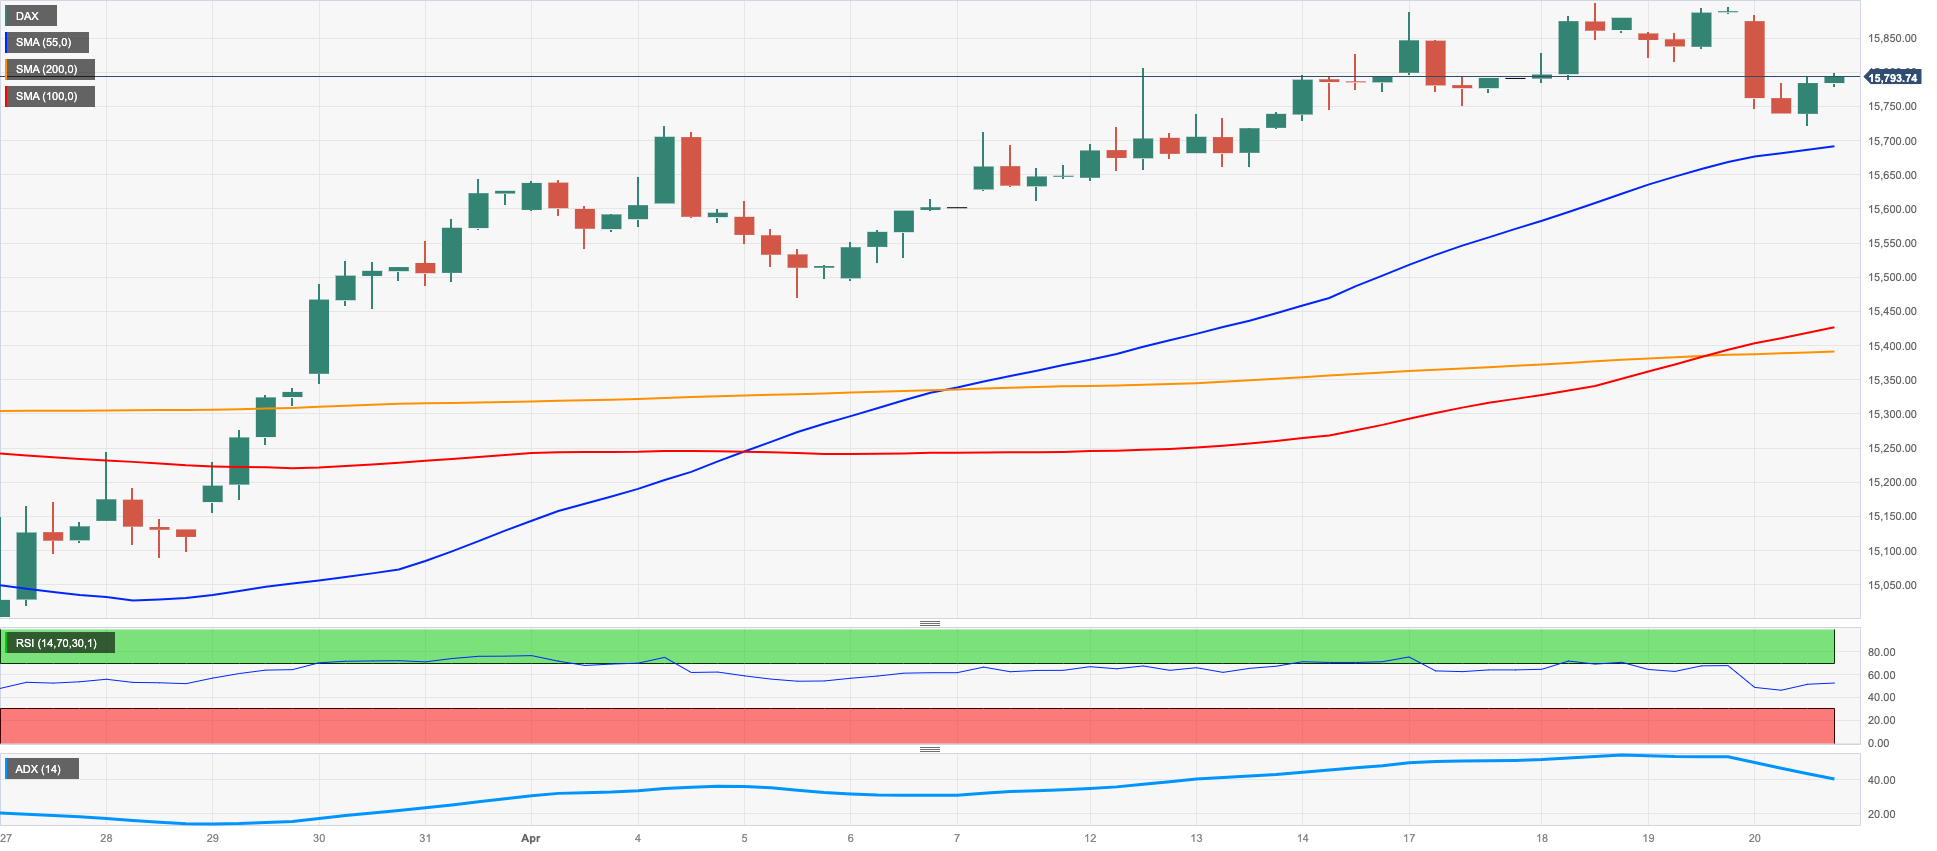
The 2023 peak at 15916 (April 18) emerges as the initial up-barrier for bulls for the time being. The breakout of this area could rapidly test the round level at 16000 ahead of the 2022 top at 16285 (January 5). In opposition, the April low at 15482 (April 5) looks reinforced by the provisional 55-day SMA at 15412 prior to the 100-day SMA at 15017. Further losses from here could prompt a test of the minor support at 14809 (March 24) to resurface on the horizon before the March low at 14458 (March 20) and the key 200-day SMA at 14102. The daily RSI dropped to the boundaries of 60.
Best Performers: Daimler Truck Holding, Siemens Healthineers, Hannover Rueck SE
Worst Performers: Sartorius AG VZO, Porsche, Continental AG
Resistance levels: 15916 16090 16285 (4H chart)
Support levels: 15482 15355 14809 (4H chart)
NASDAQ
The tech benchmark Nasdaq 100 reversed Wednesday’s pullback and charted humble gains on Thursday.
Indeed, the index managed to reverse the initial pessimism sparked after the earnings report from electric car maker Tesla missed expectations, while the weaker dollar and declining US yields also collaborated with the daily rebound beyond the 13000 mark.
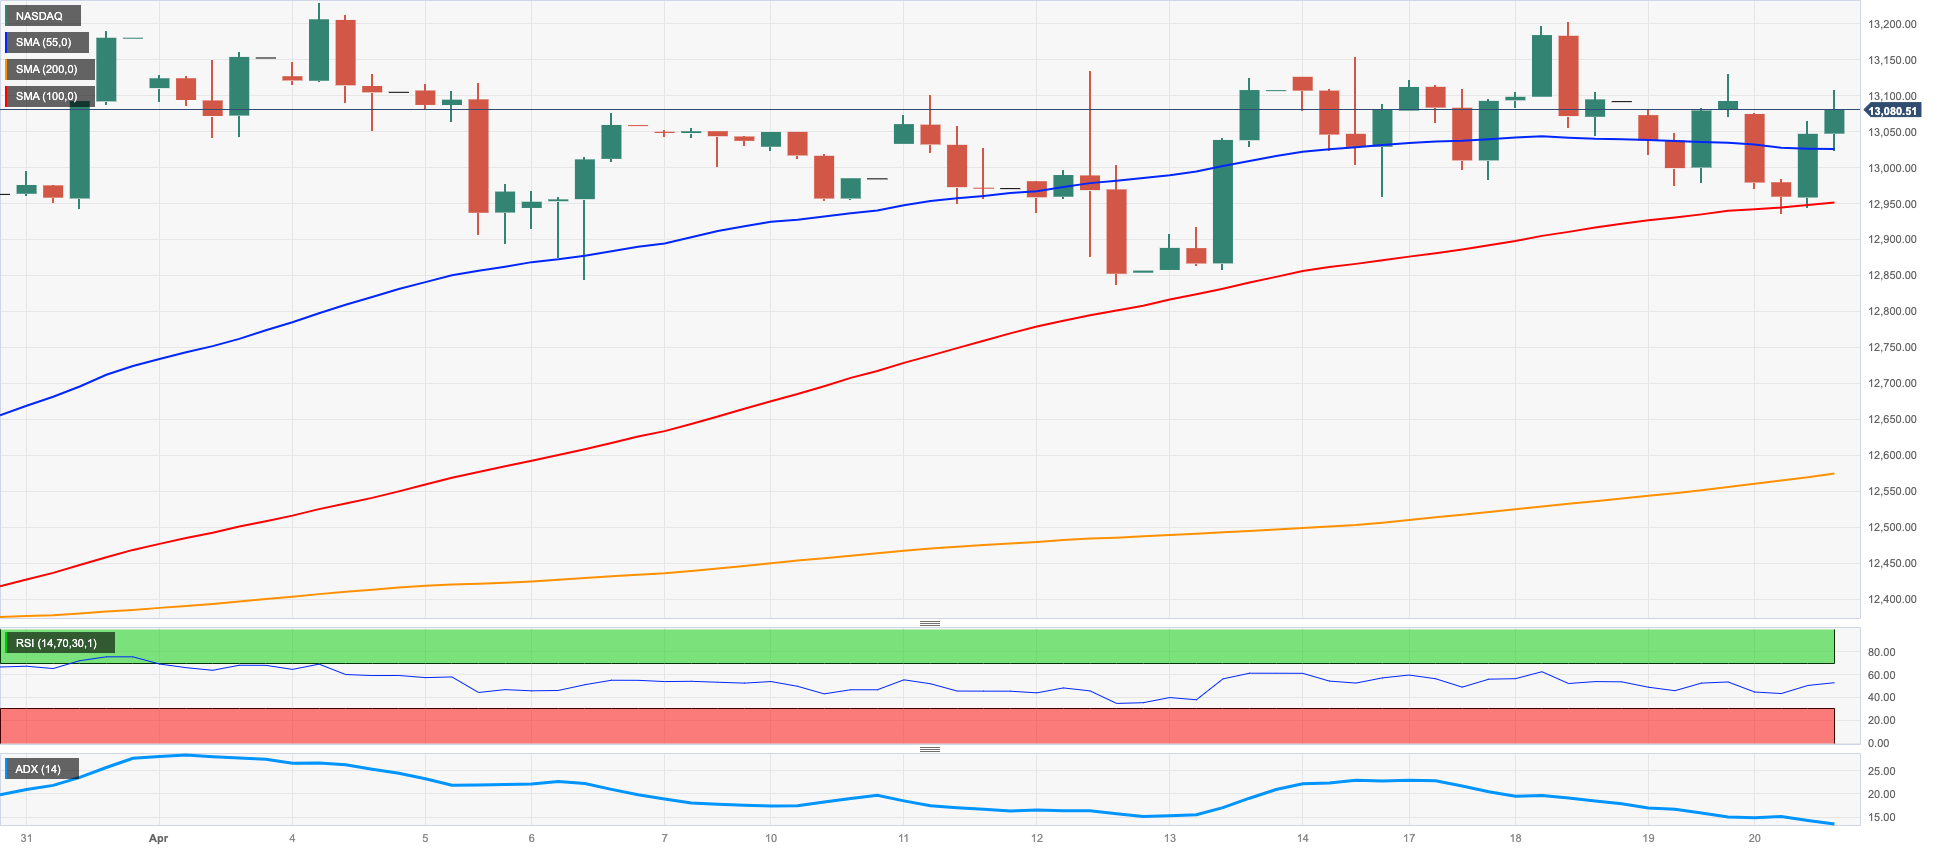
Once the Nasdaq 100 leaves behind the 2023 high at 13204 (April 4) it could attempt a move to the August 2022 top at 13720 (August 16) and the round level at 14000. Up from here emerges the March 2022 top at 15265 (March 29). On the flip side, the April low at 12846 (April 6) lines up as the next support seconded by the provisional 55-day SMA at 12557 and the weekly low at 12517 (March 28). South from here, bears could put the key 200-day SMA at 12022 to the test ahead of the March low at 11695 (March 13) and weekly lows at 11550 (January 25) and 11251 (January 19), all prior to the 2023 low at 10696 (January 6). The daily RSI looked stable near 61.
Top Gainers: Lam Research, Applied Materials, KLA Corp
Top Losers: Tesla, Lucid Group, Rivian Automotive
Resistance levels: 13204 13720 14277 (4H chart)
Support levels: 12833 12517 12046 (4H chart)
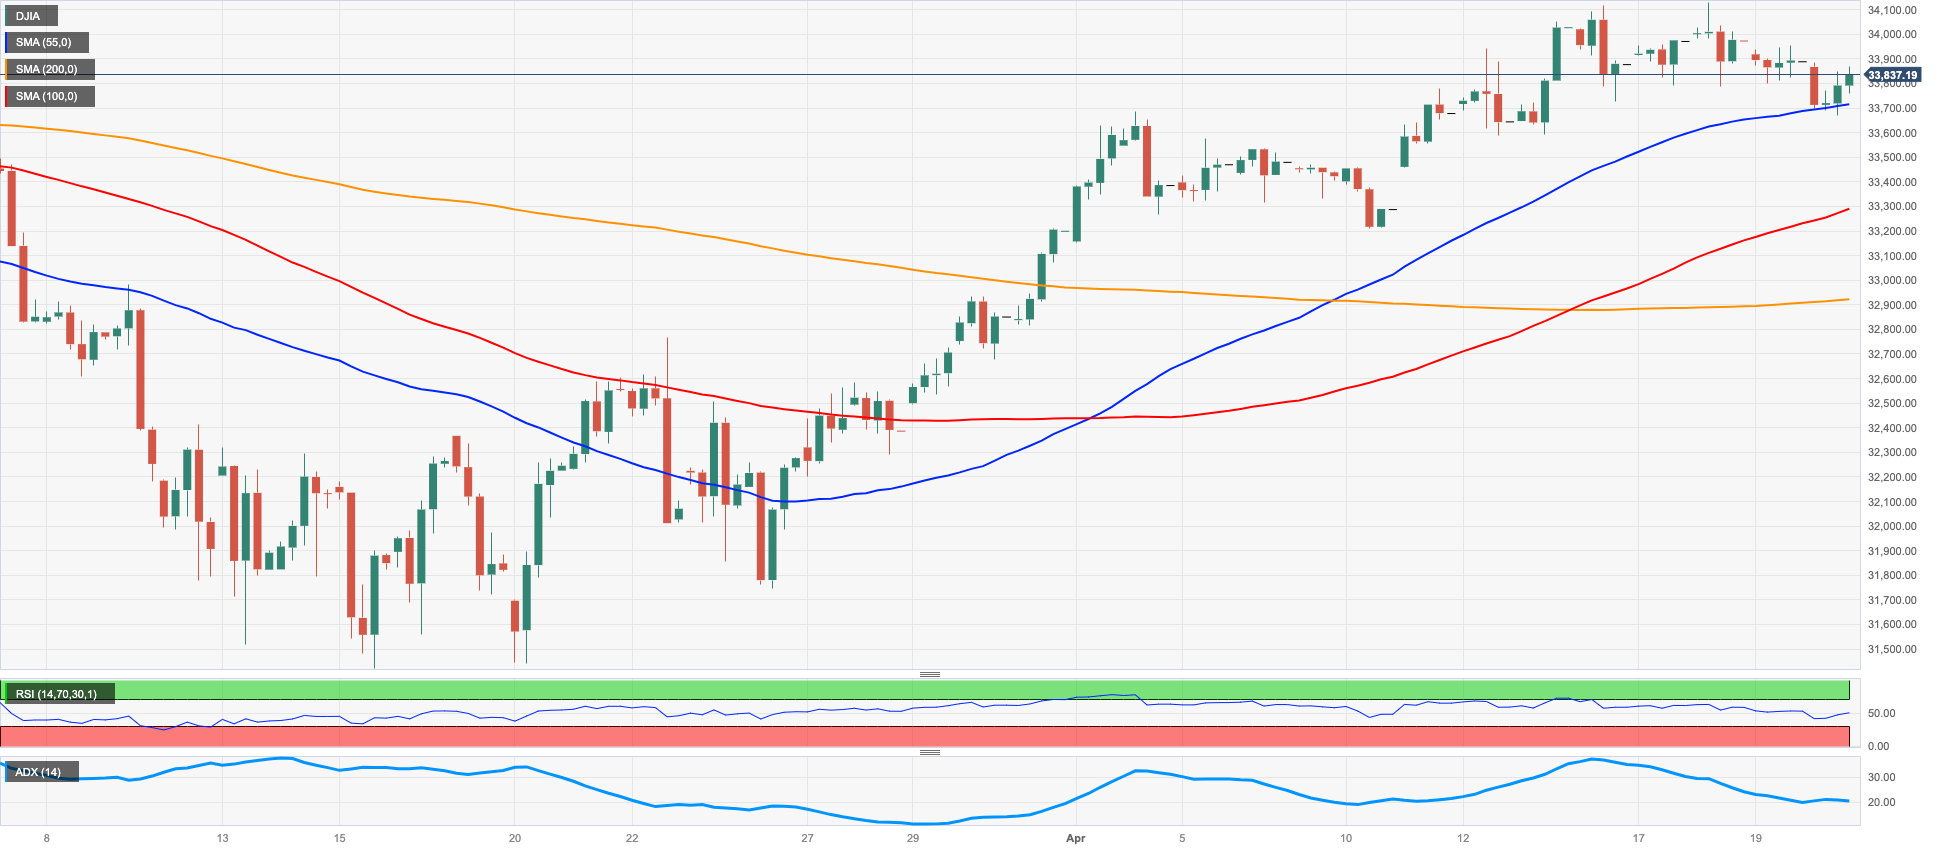
DOW JONES
All three major US stock indices traded on the defensive on Thursday.
As a matter of fact, recession concerns remained well and sound and seem to have been reinvigorated in response to another higher-than-expected increase in US weekly claims and the discouraging Philly Fed index.
Furthermore, investors continue to see the Fed hiking rates by 25 bps at the May event, while opinions of a potential pause following this gathering still remain pretty divided.
Adding to the sour mood also came some disappointing corporate results from megacaps and banks.
On the whole, the Dow Jones dropped 0.18% to 33836, the S&P500 retreated 0.35% to 4139 and the tech-reference Nasdaq Composite managed to post a modest advance.
Once the Dow Jones breaks above the ongoing range bound theme, it is expected to challenge the April high at 34082 (April 14) closely followed by the 2023 top at 34342 (January 13) and the December 2022 peak at 34712 (December 13). Beyond the latter comes the April 2022 high at 35492 (April 21) seconded by the February 2022 top at 35824 (February 9). Instead, the 100- and 55-day SMAs at 33378 and 33181, respectively, should offer interim support prior to the more relevant 200-day SMA at 32582. A deeper pullback could see the 2023 low at 31429 (March 15) revisited ahead of the 30000 level and the 2022 low at 28660 (October 13). The daily RSI drifted lower to the proximity of 61.
Top Performers: Walgreen Boots, Home Depot, Walmart
Worst Performers: Verizon, American Express, Cisco
Resistance levels: 34082 34334 34712 (4H chart)
Support levels: 33677 33363 31805 (4H chart)
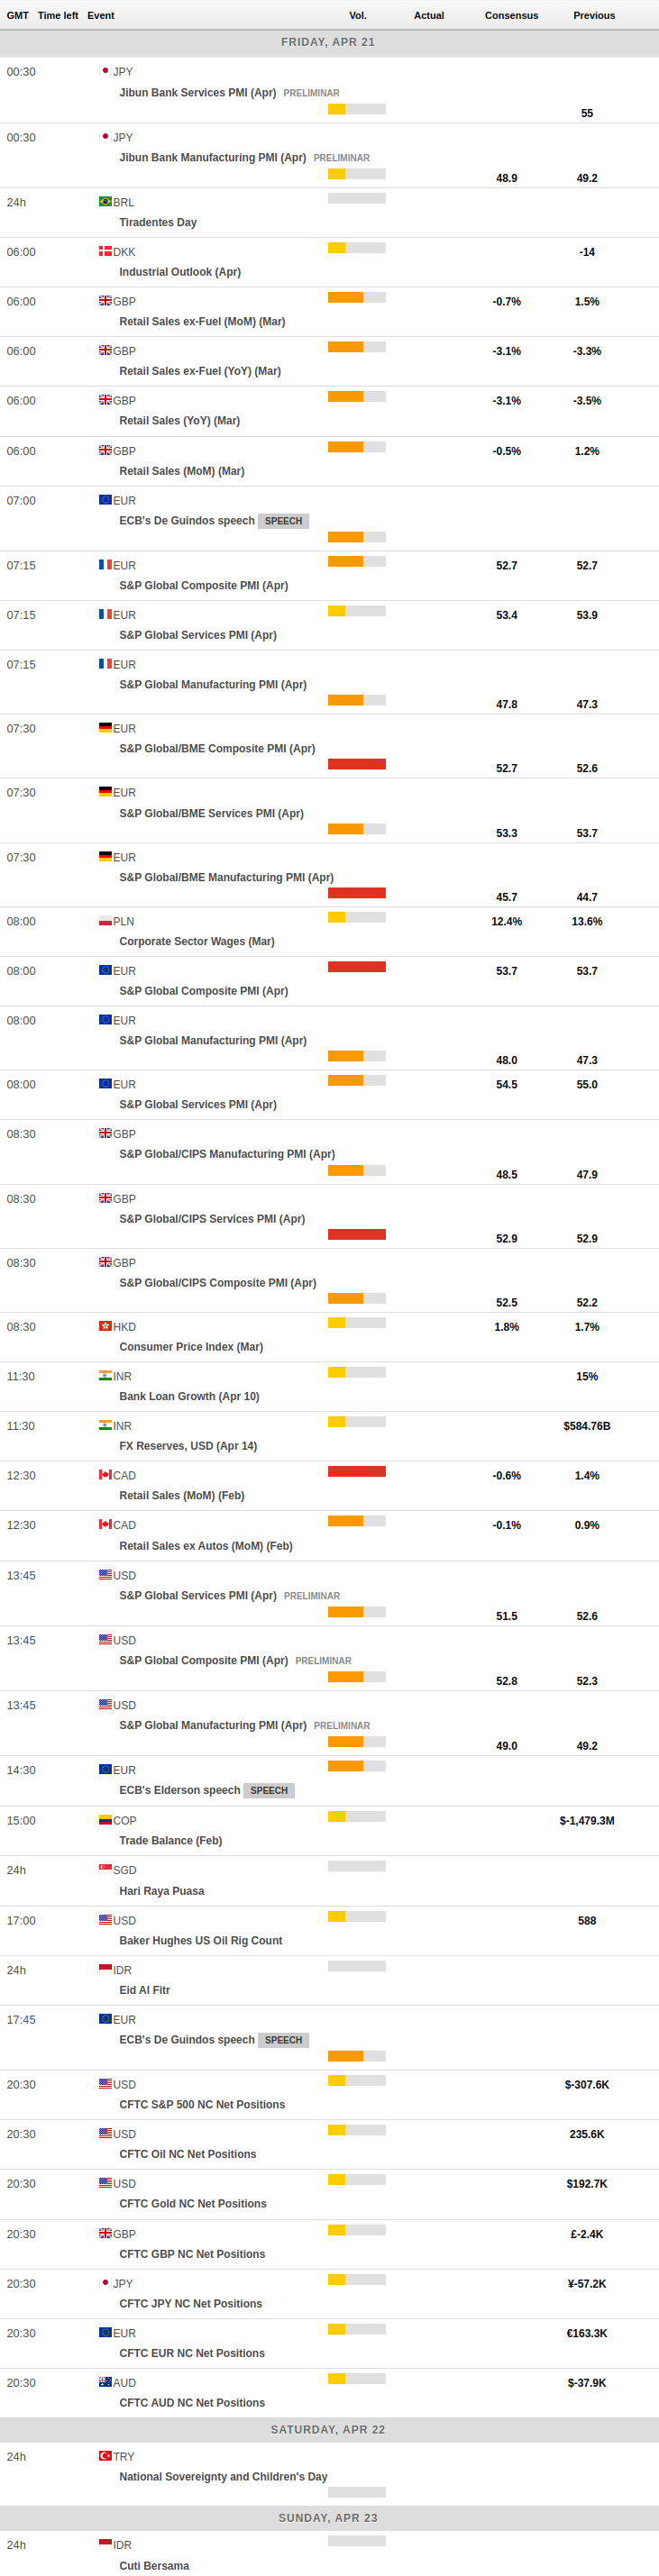
MACROECONOMIC EVENTS
All Information & Updates provided by:

All information relating to the financial markets available on this page has been prepared and issued by FXStreet (Forexstreet SL, Spain, Reg: B62498233) on the basis of publicly available information and all information believed to be reliable and does not conflict with Kuwaiti local laws, and all necessary care has been taken to before the company to ensure that the facts mentioned are correct from the source.
NCM Investment nor any of its directors or employees shall in any way be held responsible for the contents of this news, and the information contained on this page is intended only to provide clients with publicly available information and should not be construed as investment advice, report or analysis and/or constitute an offer or invitation to buy or sell financial instruments of any kind.
RISK WARNING: Forex and CFDs are highly risky leveraged products, as losses can exceed deposits. Please ensure you understand all the risks and take independent advice if necessary. NCM will segregate the clients based on the criteria of the regulator and its bylaws. NCM does not provide any advisory service; the material published does not constitute advice or a recommendation for a transaction in any financial instrument. NCM accepts no responsibility for any use of the content presented and any consequences of that use. Anyone acting on the information provided does so at their own risk.