
- Contact Us:
-

-

-

-


Daily Market Updates
24 Apr 2023
USDJPY
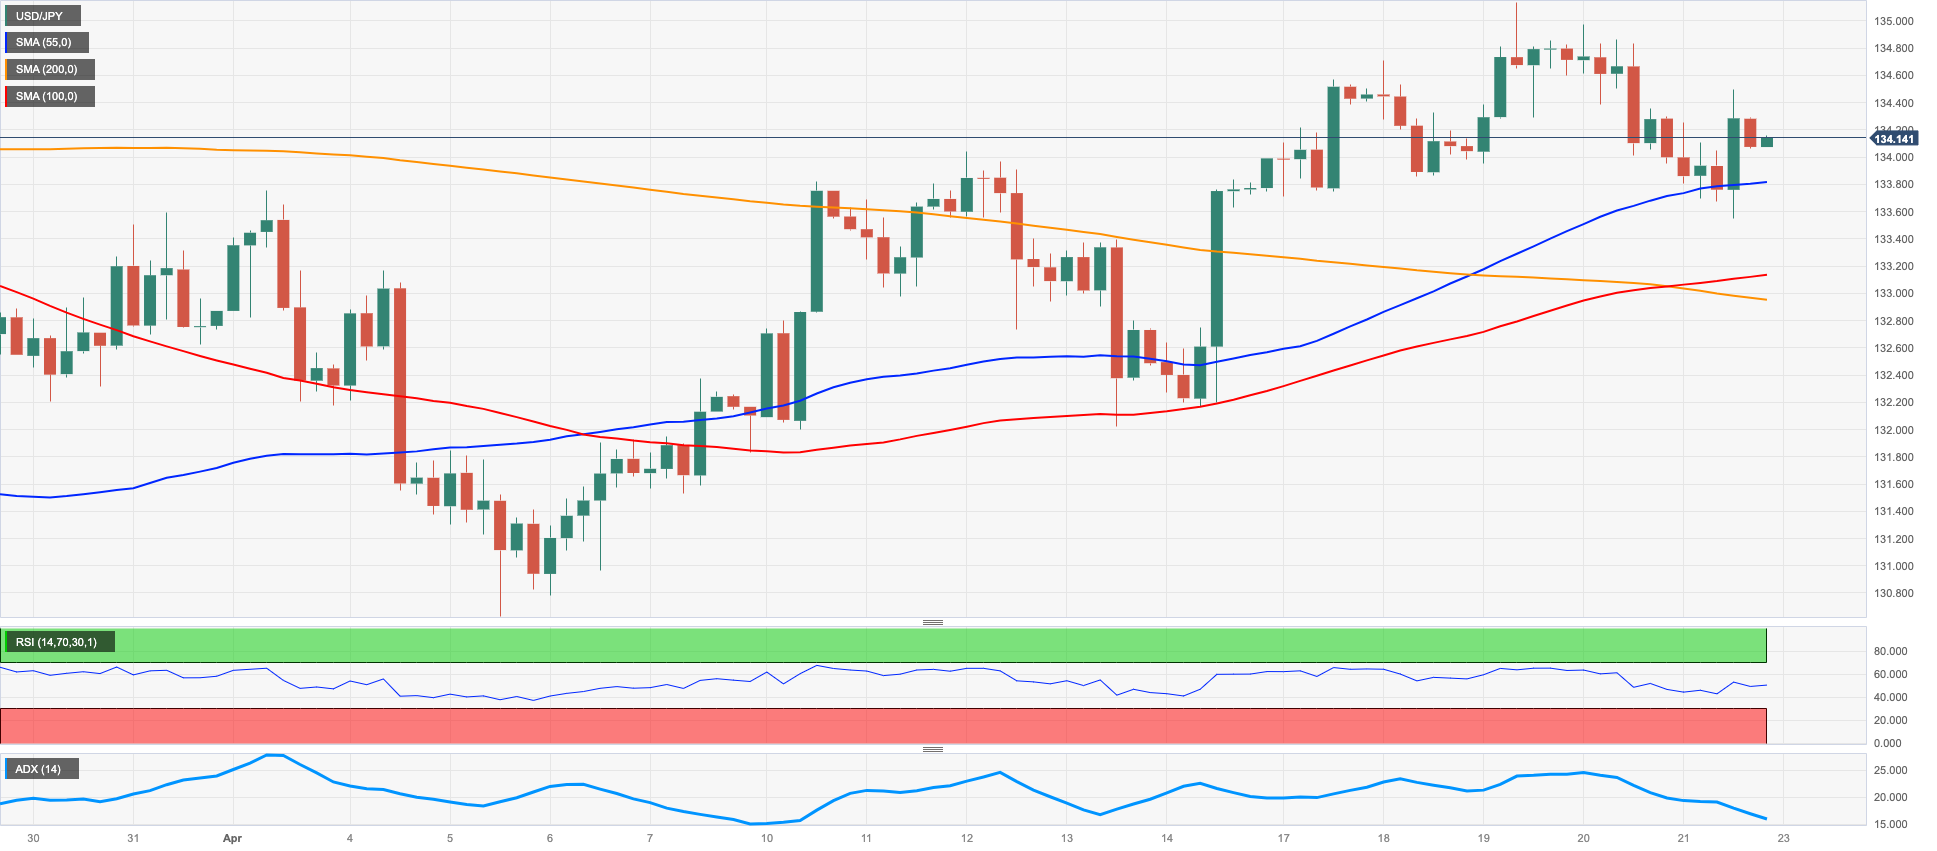
USD/JPY added to Thursday’s losses and maintained the bearish performance in the second half of the week, ending Friday’s session just above the 134.00 hurdle.
The initial selling pressure in the greenback coupled with the early pullback in US yields kept the pair on the defensive during most of the session, although the late rebound in the USD Index (DXY) and bouts of selling mood in US bonds helped the pair trim some losses towards the end of the session.
Data wise in Japan, the Inflation Rate rose 3.2% in the year to March, while Core Inflation Rate rose 3.1% over the last twelve months and the Inflation Rate Ex-Food and Energy gained 3.8% from a year earlier. Additionally, the flash Jibun Bank Manufacturing PMI is seen at 49.5 in April and 54.9 when it comes to the Services PMI.
In case bulls regain the upper hand, USD/JPY is expected to challenge the April peak at 135.13 (April 19) ahead of the key 200-day SMA at 137.05 and the 2023 top at 137.91 (March 8). North from here emerges weekly peaks at 139.89 (November 30 2022) and 142.25 (November 21 2022). On the contrary, there is an interim support at the 100-day SMA at 132.98 seconded by the April low at 130.62 (April 5) and the March low at 129.63 (March 24). Extra losses from here could retest the February low at 128.08 (February 2) prior to the 2023 low at 127.21 (January 16). The daily RSI receded to the 55 region.
Resistance levels: 134.49 135.13 136.99 (4H chart)
Support levels: 133.54 133.09 132.01 (4H chart)
GBPUSD
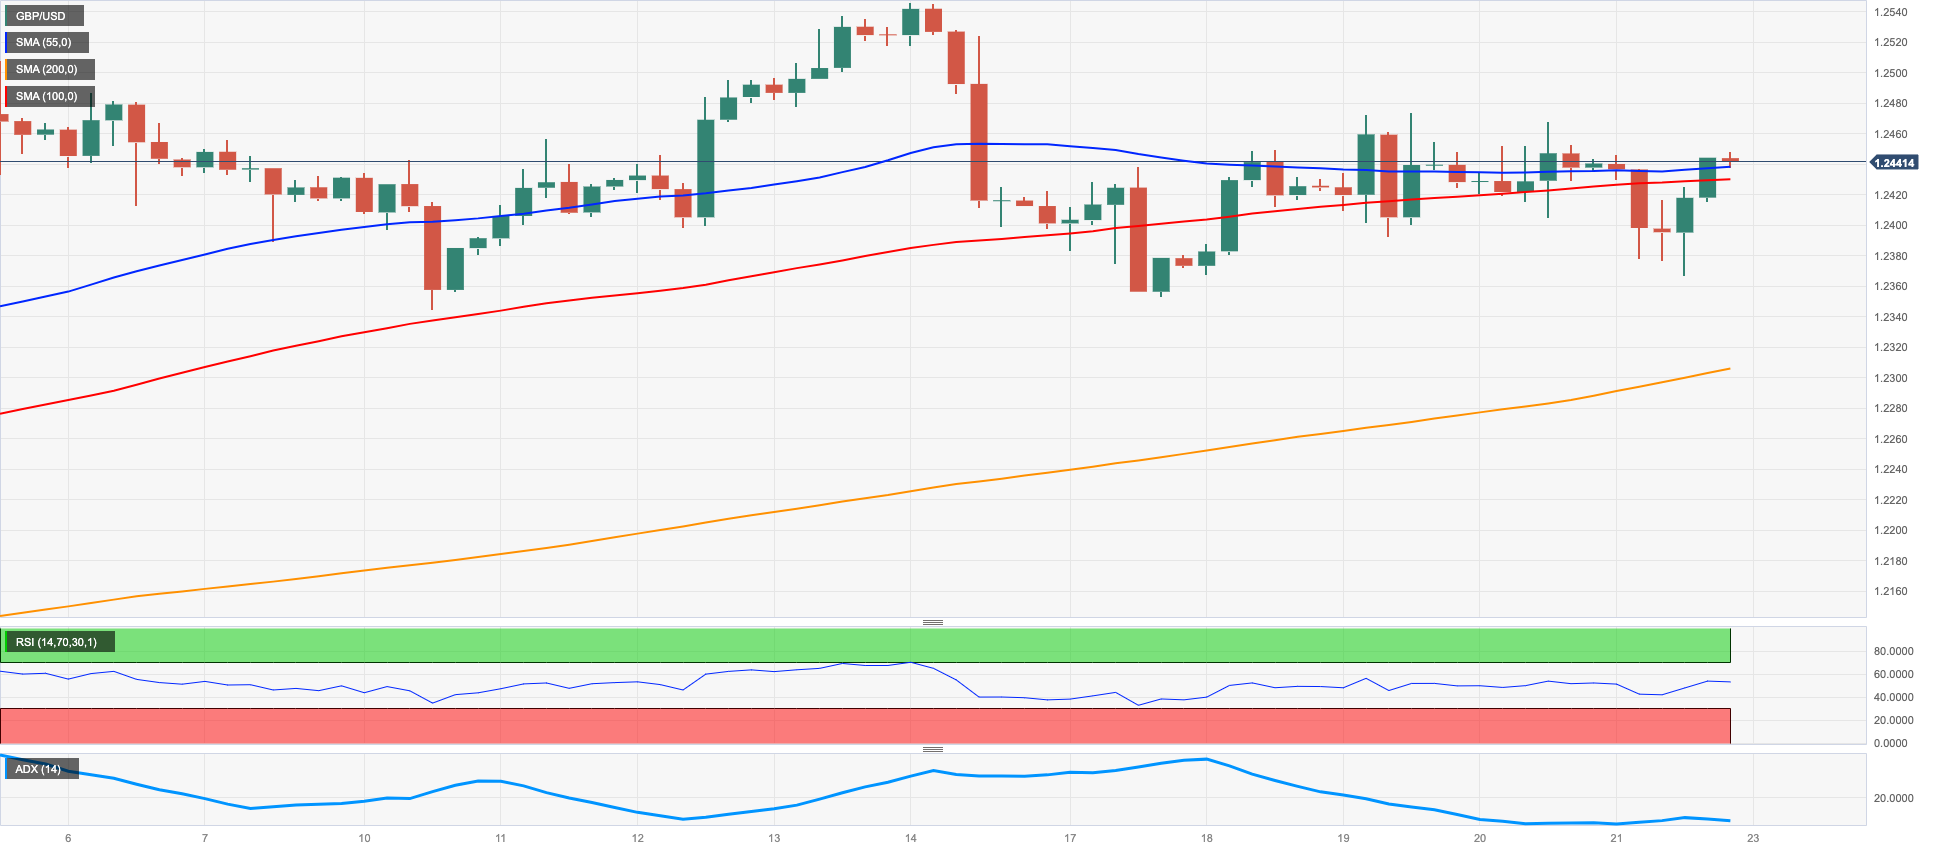
GBP/USD snapped three consecutive sessions with gains and probed the area of 3-day lows near 1.2370 before rebounding past 1.2400 the figure at the end of the week.
The bearish price action around the greenback failed to have sparked some upside reaction in the Sterling on Friday, although this did not prevent Cable from extending the positive streak for the sixth week in a row.
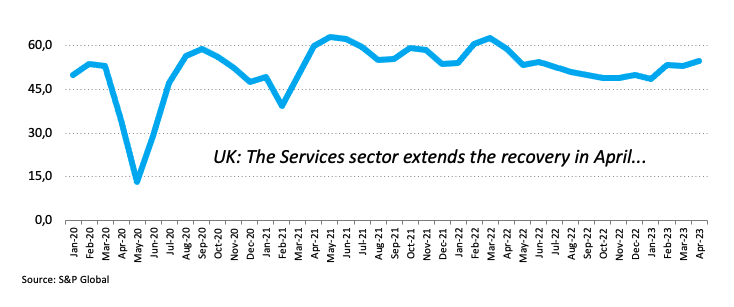
The renewed selling pressure in the British pound also came in line with mixed readings from the advanced Manufacturing and Services PMIs, which worsened to 46.6 and improved to 56.6, respectively, for the month of April.
More news from the UK calendar saw Consumer Confidence tracked by Gfk improve to -30 in April, while headline Retail Sales contracted 3.1% in the year to March and 3.2% YoY when excluding Fuel sales.
GBP/USD appears to have moved into some range bound trade as of late. The surpass of this theme could see the 2023 top at 1.2546 (April 14) revisited ahead of the May 2022 peak at 1.2666 (May 27). Further up emerges the 200-week SMA at 1.2865 before the psychological 1.3000 yardstick. Just the opposite, there is initial contention at the weekly low at 1.2344 (April 10) prior to the April low at 1.2274 (April 3) and the temporary 55-day SMA at 1.2194. The loss of the latter could pave the way for a test of the key 200-day SMA at 1.1924 before the 2023 low at 1.1802 (March 8). The daily RSI remained almost unchanged just above 57.
Resistance levels: 1.2474 1.2546 1.2599 (4H chart)
Support levels: 1.2353 1.2274 1.2263 (4H chart)
AUDUSD
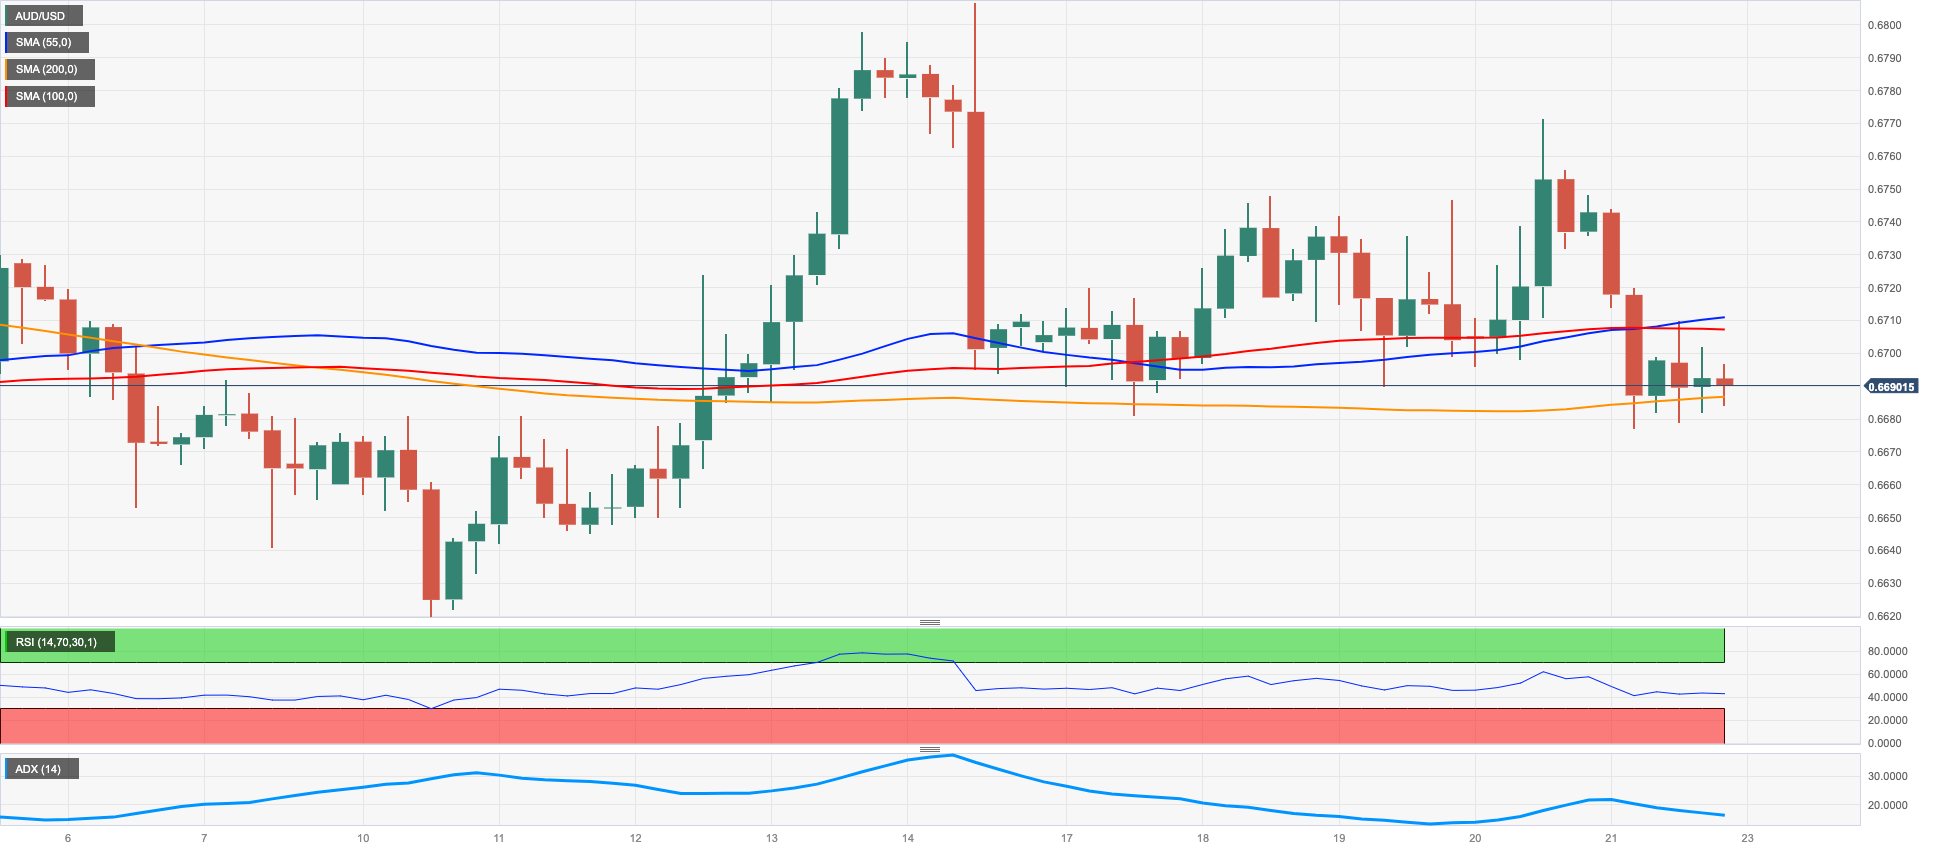
AUD/USD ended Friday’s session with marginal gains just below 0.6700 the figure amidst quite a volatile day and following a brief drop to the 200-day SMA in the 0.6680 zone.
The late bounce in the greenback in combination with some improvement in the sentiment around the currency limited the upside potential in the Aussie dollar, while the generalized negative mood surrounding the commodity complex also added to the volatility seen in the pair.
In Oz, the advanced Judo Bank Manufacturing PMI is expected to have eased to 48.1 in April, while the Judo Bank Services PMI is seen improving to 52.6.
The April low at 0.6677 (April 21) continues to hold the downside in AUD/USD for the time being. Down from here comes the April low at 0.6619 (April 10) ahead of the 2023 low at 0.6563 (March 10) followed by the weekly low at 0.6386 (November 10 2022) and the November 2022 low at 0.6272 (November 3). The other way around, the immediate hurdle aligns at the April high at 0.6805 (April 14) prior to the key round level at 0.7000 and the weekly top at 0.7029 (February 14). Further upside from here could see the 2023 peak at 0.7157 (February 2) revisited. The daily RSI dropped below the 48 region.
Resistance levels: 0.6771 0.6805 0.6920 (4H chart)
Support levels: 0.6677 0.6619 0.6589 (4H chart)
GOLD
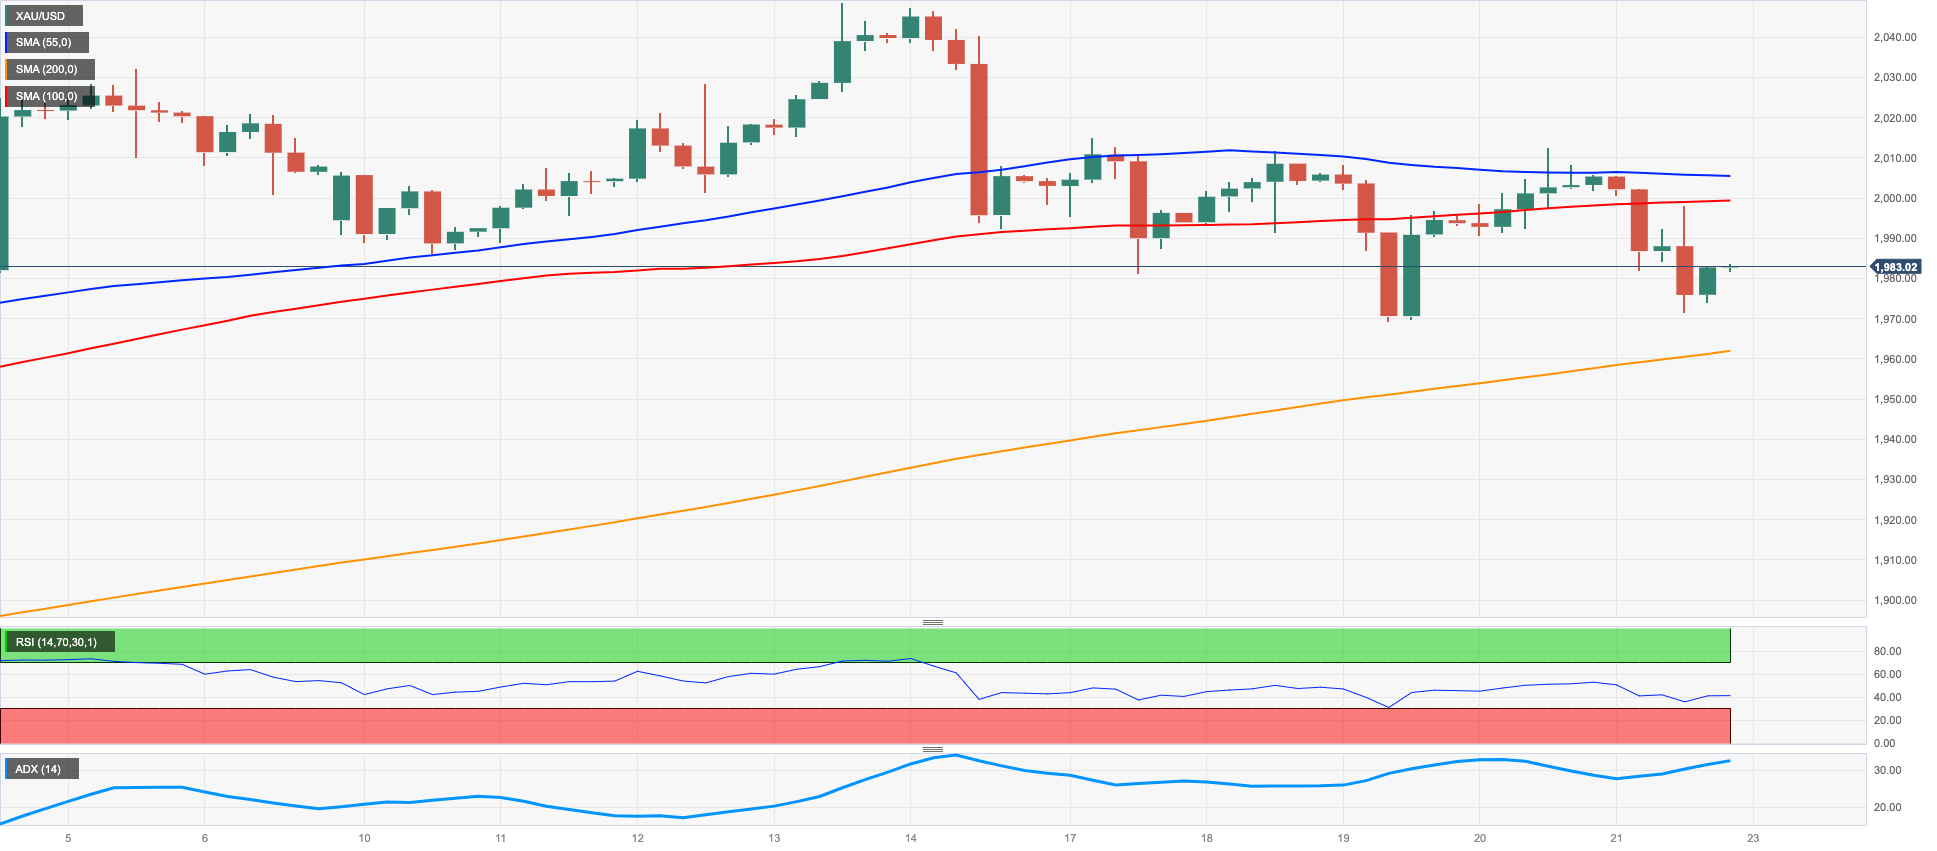
Gold prices kept the weekly choppiness well in place for yet another session on Friday, this time dropping to the area of weekly lows near the $1980 region.
Somewhat better-than-expected results from the US docket on Friday sponsored the late bounce in the dollar and the U-turn in US yields across the curve, putting the precious metal under further selling pressure at the end of the week.
In the meantime, the next future steps regarding interest rate hikes by both the Federal Reserve and the ECB are expected to keep dictating the price action around the yellow metal. So far, investors largely anticipate a 25 bps rate hike by both central banks in May, while an impasse in the Fed’s hiking cycle after the May gathering has started to gather some steam.
Bullion remains side-lined for the time being. If bulls regain control, then the metal is expected to retarget the 2023 peak at $2048 (April 13) ahead of the 2022 high at $2070 (March 8) and the all-time top at $2075 (August 7 2020). On the opposite side, there is a minor support at the weekly low at $1969 (April 19) followed by the April low at $1949 (April 3) and another weekly low at $1934 (March 22). The loss of the latter could pave the way for a potential drop to temporary support levels at the 55- and 100-day SMAs at $1915 and $1886, respectively, ahead of the March low at $1809 (March 8) and the 2023 low at $1804 (February 28).
Resistance levels: $2015 $2048 $2070 (4H chart)
Support levels: $1969 $1957 $1938 (4H chart)
CRUDE WTI
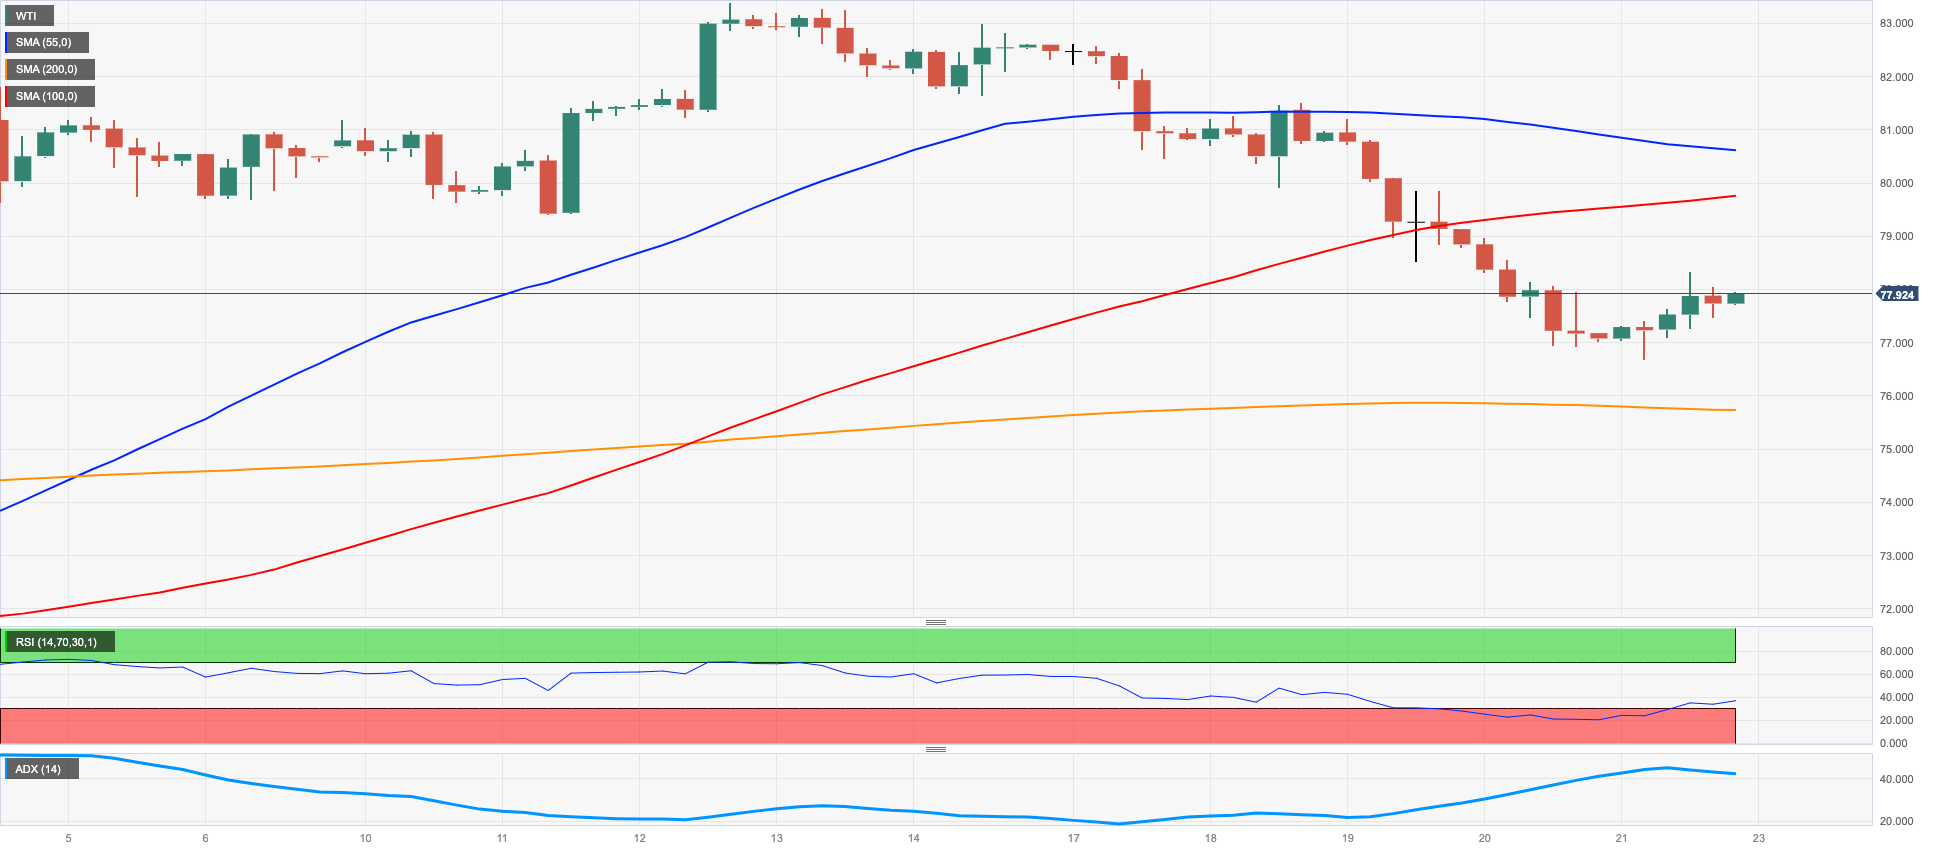
Prices of the barrel of the US benchmark West Texas Intermediate rose for the first time in the week on Friday regaining the vicinity of the $78.00. mark per barrel after dropping to the $76.80 region earlier in the session.
As usual over the last sessions, recession concerns returned to the fore as the almost exclusive drivers of the corrective decline in the commodity following new YTD highs past $83.00 earlier in the month, particularly on the back of prospects for further tightening by major central banks (Fed, ECB and the BoE).
Renewed oxygen for crude oil came after positive prints from flash Services PMIs on both sides of the Atlantic, although the strong build in gasoline inventories – as per the latest EIA’s weekly report – did not bode well for the near-term perspective of crude oil prices.
In the docket, the US oil rig count went up by 3 in the week to April 21 reported driller Baker Hughes, taking the US total active oil rigs to 591.
In case sellers push harder, the WTI should meet the next interim support at the 55-day SMA at $76.29 prior to the key $70.00 mark and before the $66.86 level (March 24). The loss of this region could put a test of the 2023 low at $64.41 (March 20) back on the traders’ radar prior to the December 2021 low at $62.46 (December 2) and the key $60.00 mark per barrel. To the contrary, the key 200-day SMA at $82.50 emerges as the initial obstacle for any bullish attempt ahead of the 2023 high at $83.49 (April 12) and the November 2022 top $93.73 (November 7).
Resistance levels: $78.35 $80.64 $81.52 (4H chart)
Support levels: $76.69 $75.82 $72.16 (4H chart)
GER40
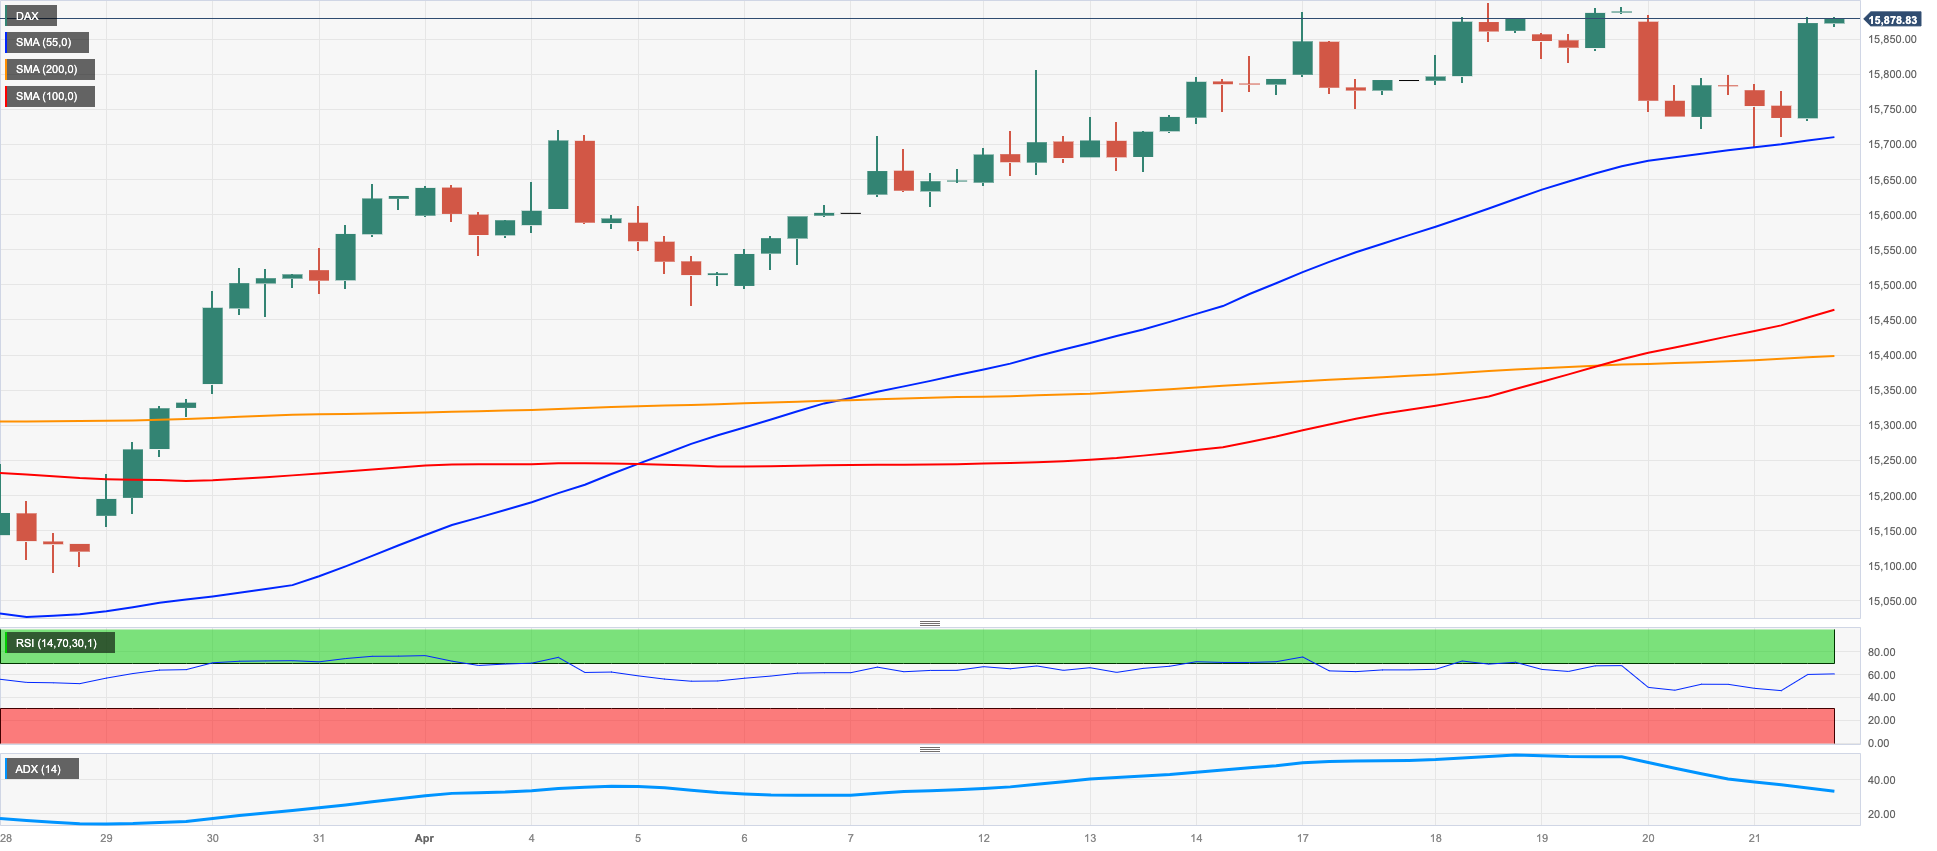
The German reference DAX40 reversed Thursday’s pullback and resumed the uptrend on Friday, trading at shouting distance from the recent 2023 peaks near the 16000 hurdle.
Positive results from the European docket – particularly from the Services sector – helped with the upbeat sentiment, while investors continued to assess upcoming interest rate hikes by the ECB and the BoE on this side of the ocean.
In Germany, the advanced Manufacturing PMI is expected to have deteriorated to 44.0 in April (from 44.7), and the Services PMI is seen improving to 55.7 (from 53.7).
The late rebound in US yields also echoed in the German money market, as the 10-year Bund yields traded closer to the 2.50% region following Thursday’s knee-jerk.
Another test of the 2023 high at 15916 (April 18) is just around the corner for the DAX40. Once the index leaves this region behind, it could then dispute the round level at 16000 prior to the 2022 peak at 16285 (January 5). Instead, the April low at 15482 (April 5) seems underpinned by the proximity of the interim 55-day SMA at 15425 ahead of another temporary support at the 100-day SMA at 15032. Down from here emerges the minor support at 14809 (March 24) seconded by the March low at 14458 (March 20) and the key 200-day SMA at 14117. The daily RSI climbed to the boundaries of 63.
Best Performers: SAP, Merck, Fresenius SE
Worst Performers: BASF, Daimler Truck Holding, Airbus Group
Resistance levels: 15916 16090 16285 (4H chart)
Support levels: 15706 15482 15366 (4H chart)
NASDAQ
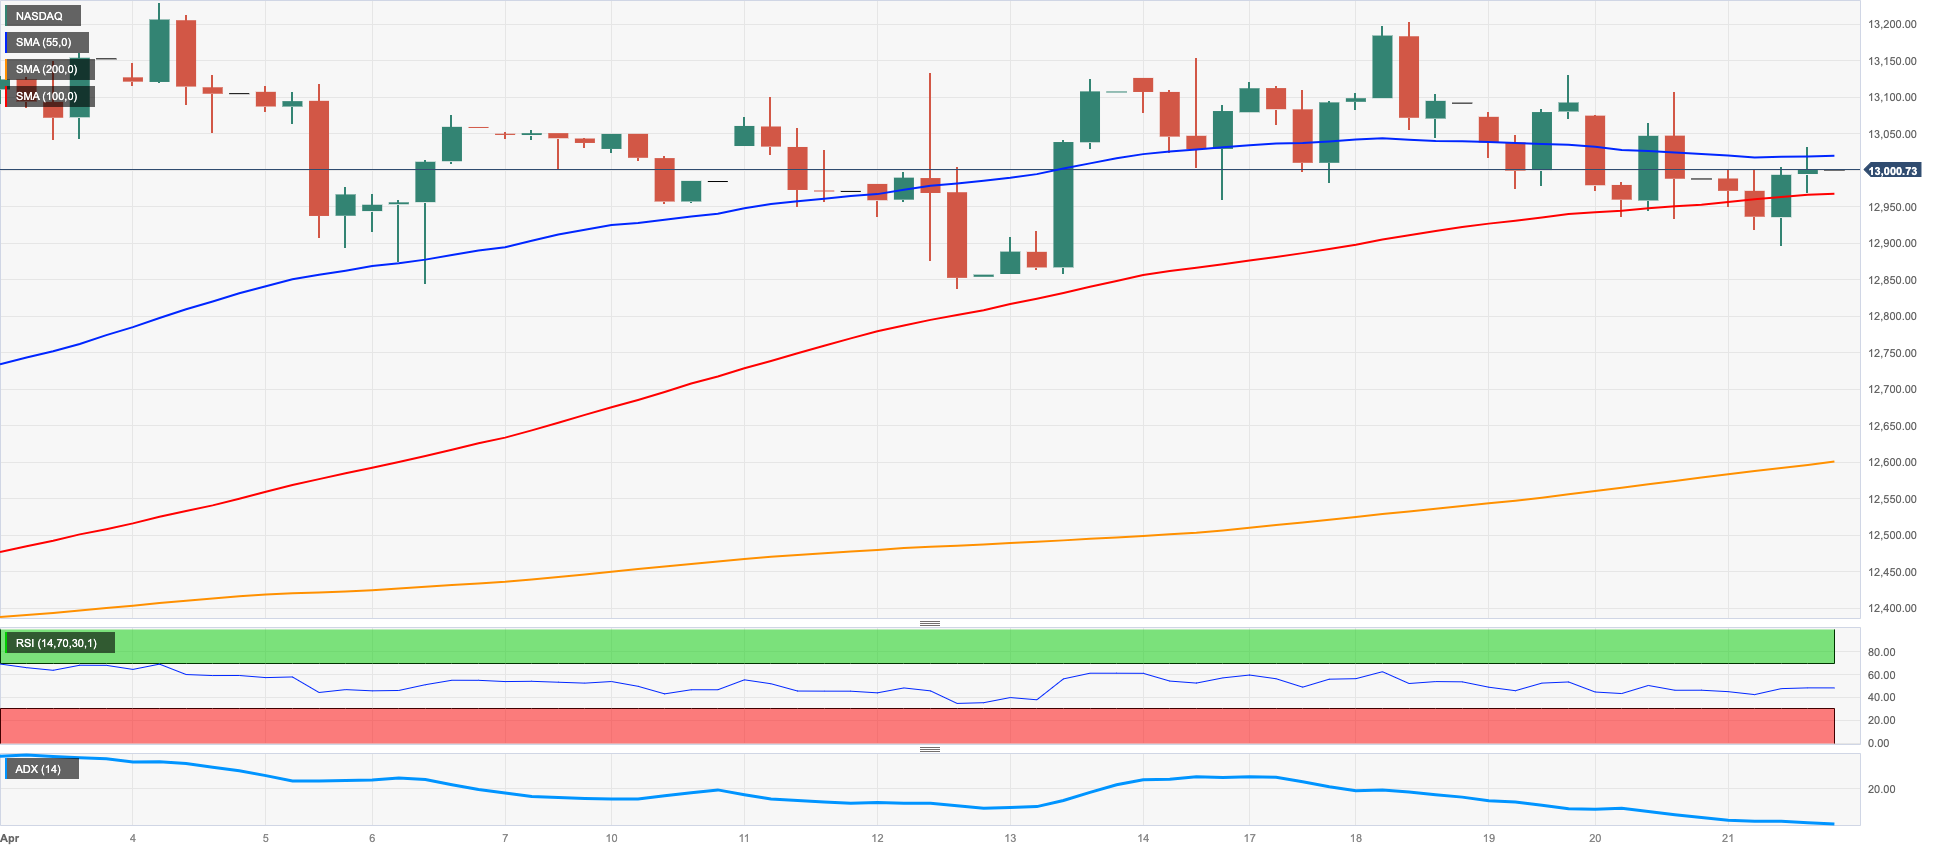
US tech stocks gauged by the Nasdaq 100 closed Friday’s session with humbles gains in line with the rest of its US peers, reclaiming at the same time the 1300 region.
Looking at the weekly chart, the index retreated modestly albeit enough to reverse the previous advance.
The tech sector therefore left behind two sessions in a row with losses amidst the prevailing selling bias in the dollar and the late rebound in US yields, which gathered sudden steam following the better-then-expected results from flash PMIs for the month of April.
The Nasdaq 100 needs to break above the current consolidative theme to confront the 2023 top at 13204 (April 4). The surpass of the latte could open the door to a probable visit to the August 2022 peak at 13720 (August 16) seconded by the round level at 14000 and the March 2022 peak at 15265 (March 29). In opposition, immediate contention remains at the April low at 12846 (April 6) ahead of the interim 55-day SMA at 12566 and the weekly low at 12517 (March 28). The loss of this region could spark a deeper retracement to the key 200-day SMA at 12027 before the March low at 11695 (March 13). Further weakness could see weekly lows at 11550 (January 25) and 11251 (January 19) revisited ahead of the 2023 low at 10696 (January 6). The daily RSI edged slightly higher past the 56 mark.
Top Gainers: CSX, Amazon.com, Gilead
Top Losers: Zoom Video, Airbnb, AMD
Resistance levels: 13204 13720 14277 (4H chart)
Support levels: 12899 12833 12517 (4H chart)
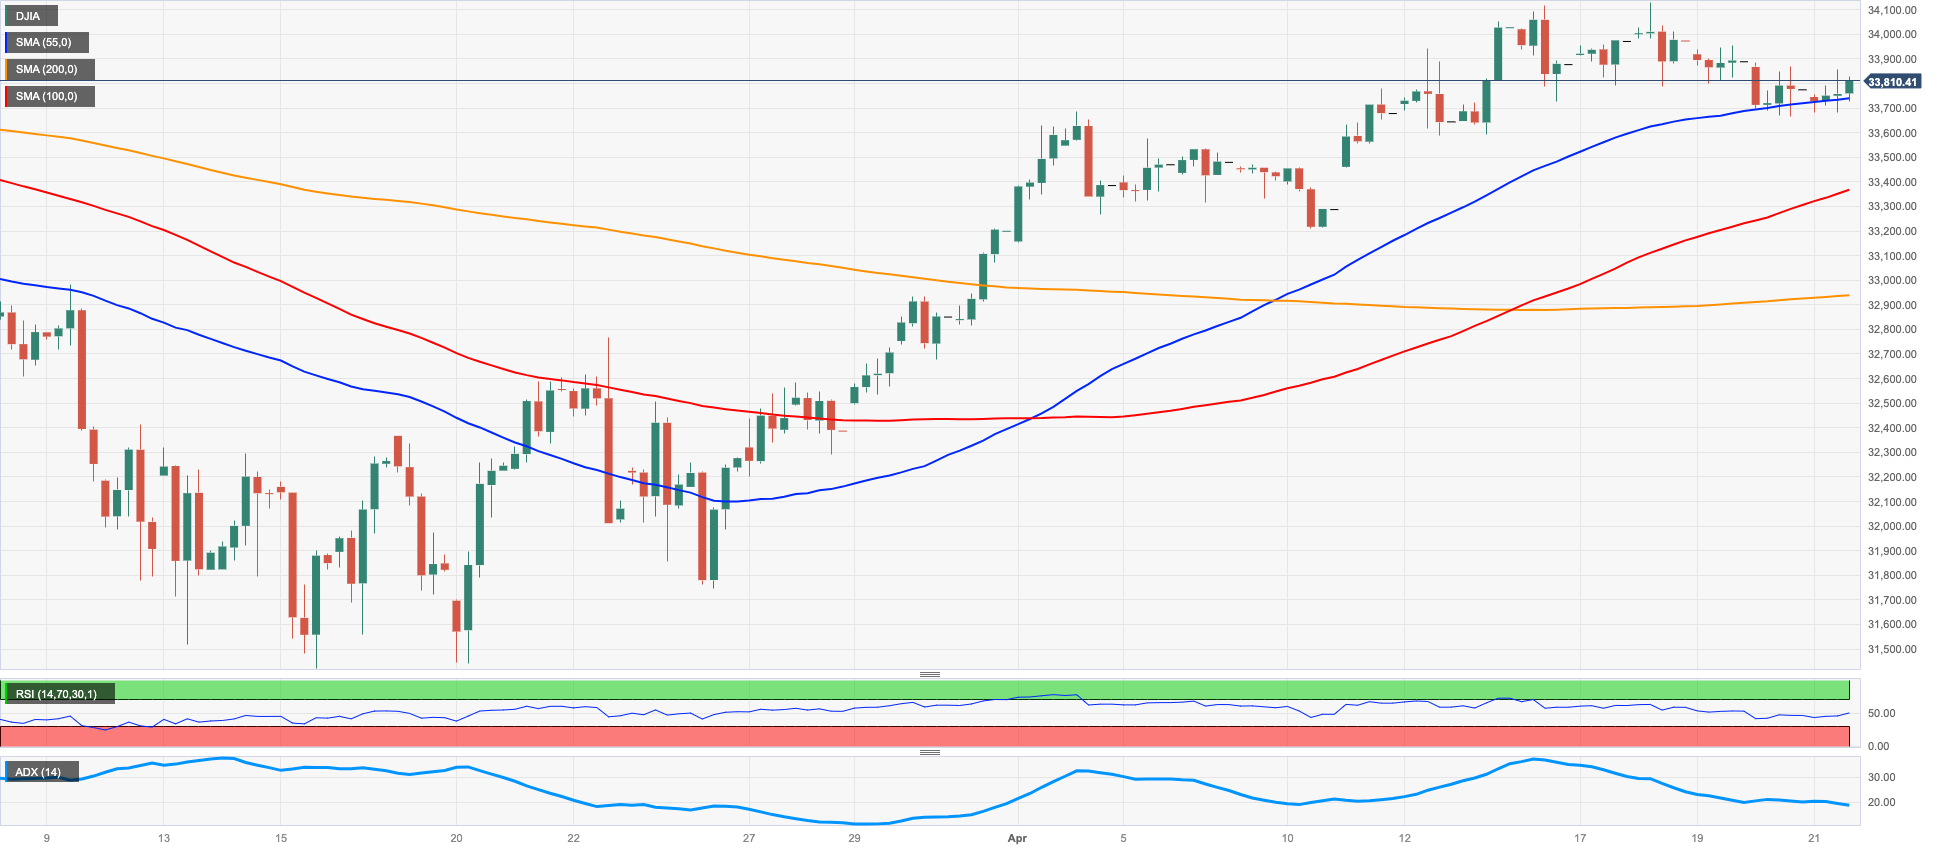
DOW JONES
US equities tracked by the Dow Jones ended Friday’s session with marginal gains and closed the week with red figures for the first time after four consecutive advances.
The prudent stance from market participants ahead of next week’s expected slew of corporate earnings reports in combination with the generalized consolidative mood in the global markets and recession concerns, all ruled the price action around US stocks over the last sessions.
Overall, the Dow Jones rose 0.07% to 33808, the S&P500 advanced 0.09% to 4133 and the tech-benchmark Nasdaq Composite gained 0.11% to 12072.
The April top at 34082 remains the initial up-barrier for the Dow Jones ahead of the 2023 peak at 34342 (January 13) and the December 2022 high at 34712 (December 13). Once this level is cleared, the index could challenge the April 2022 top at 35492 (April 21) before the February 2022 peak at 35824 (February 9). On the other hand, provisional contention lines up at the 100- and 55-day SMAs at 33372 and 33174, respectively, ahead of the key 200-day SMA at 32595. South from here, a probable visit to the 2023 low at 31429 (March 15) could emerge on the horizon before the 30000 level and ahead of the 2022 low at 28660 (October 13). The daily RSI improved fractionally to 60.
Top Performers: Procter&Gamble, Walt Disney, Merck&Co
Worst Performers: Intel, Dow, Boeing
Resistance levels: 34082 34334 34712 (4H chart)
Support levels: 33677 33357 31805 (4H chart)
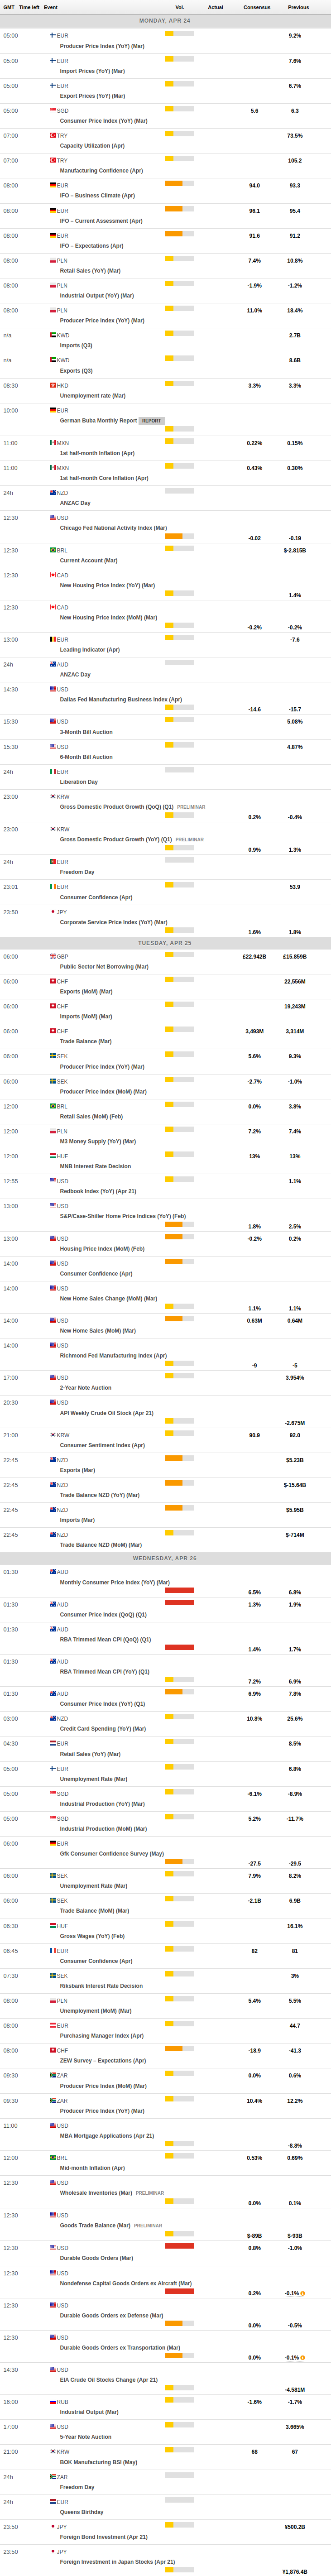
MACROECONOMIC EVENTS
All Information & Updates provided by:

All information relating to the financial markets available on this page has been prepared and issued by FXStreet (Forexstreet SL, Spain, Reg: B62498233) on the basis of publicly available information and all information believed to be reliable and does not conflict with Kuwaiti local laws, and all necessary care has been taken to before the company to ensure that the facts mentioned are correct from the source.
NCM Investment nor any of its directors or employees shall in any way be held responsible for the contents of this news, and the information contained on this page is intended only to provide clients with publicly available information and should not be construed as investment advice, report or analysis and/or constitute an offer or invitation to buy or sell financial instruments of any kind.
RISK WARNING: Forex and CFDs are highly risky leveraged products, as losses can exceed deposits. Please ensure you understand all the risks and take independent advice if necessary. NCM will segregate the clients based on the criteria of the regulator and its bylaws. NCM does not provide any advisory service; the material published does not constitute advice or a recommendation for a transaction in any financial instrument. NCM accepts no responsibility for any use of the content presented and any consequences of that use. Anyone acting on the information provided does so at their own risk.