Daily Market Updates
25 Apr 2023
USDJPY
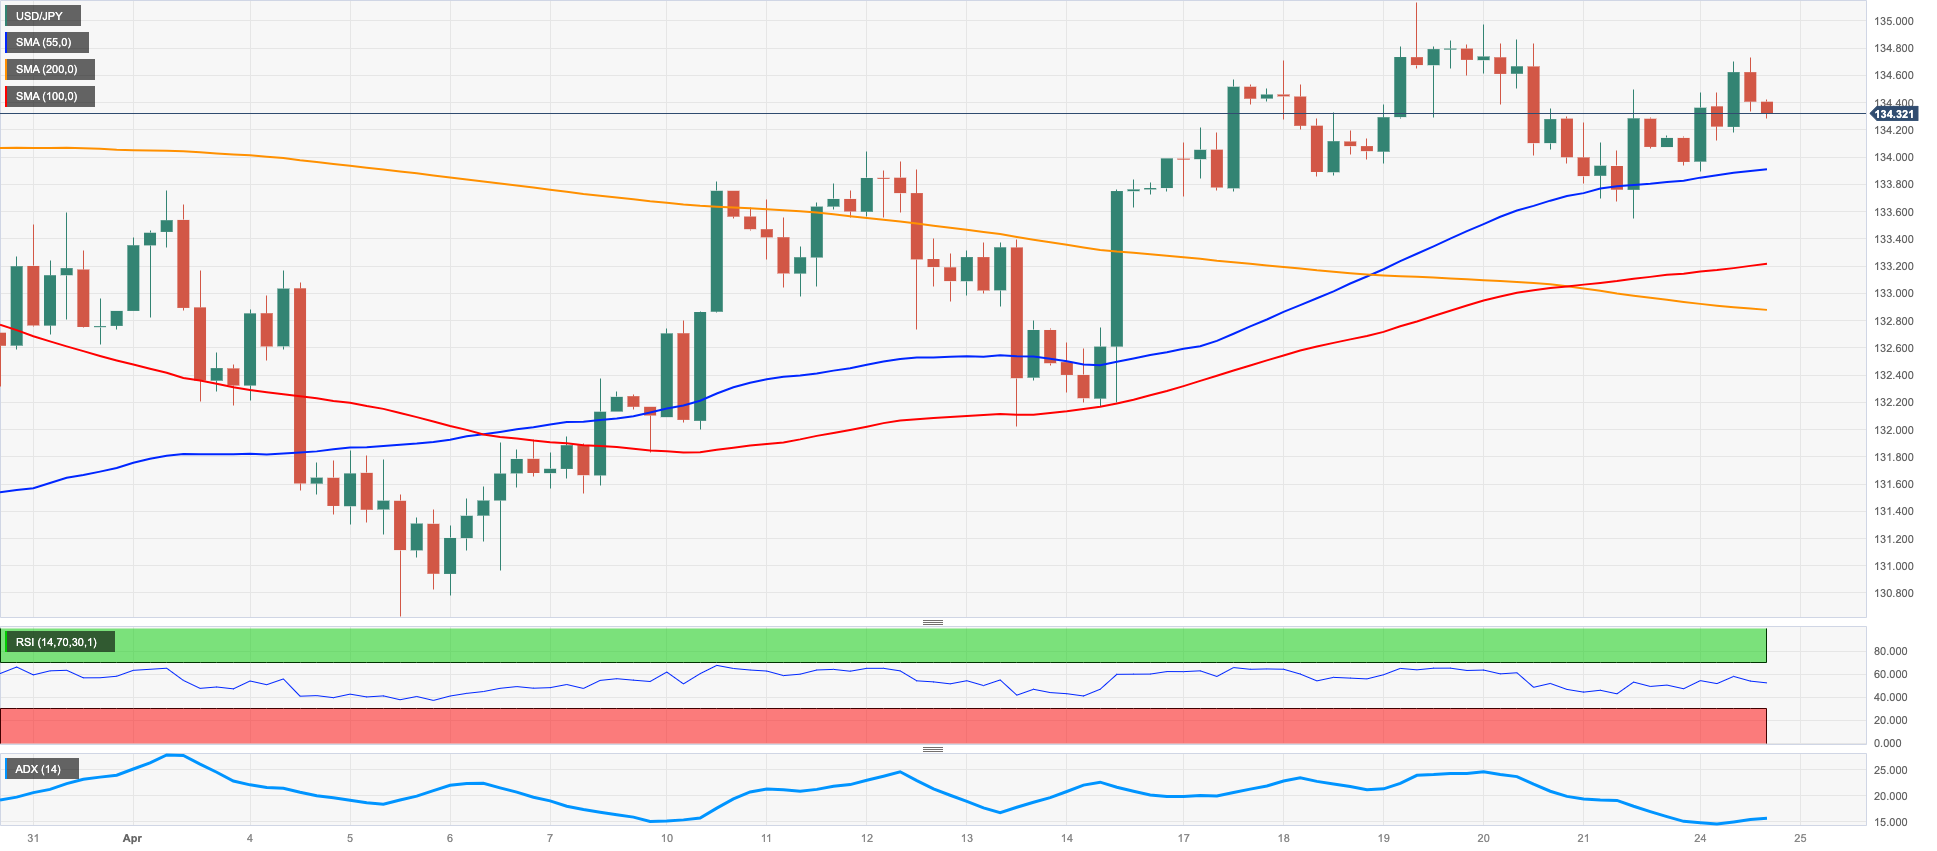
The dominating appetite for the risk complex favoured the exodus from the Japanese safe haven yen and sponsored a promising start of the week for USD/JPY, which climbed to 2-day highs around 134.70, where it met some initial resistance.
Indeed, spot moved markedly higher and revisited the 134.70/80 band amidst the equally persistent sell-off in the greenback and despite US yields drifting lower across the curve.
In the Japanese bond market, the JGB 10-year yields remained flat-lined around the 0.48% region for yet another session on Monday.
There were no data releases in the Land of the rising Sun on Monday.
Immediately to the upside for USD/JPY aligns the April high at 135.13 (April 19). Once this level is cleared, gains could accelerate and visit the key 200-day SMA at 137.03 prior to the 2023 peak at 137.91 (March 8). Further up emerges weekly high at 139.89 (November 30 2022) and 142.25 (November 21 2022). Just the opposite, the 100-day SMA at 132.96 offers temporary support before the April low at 130.62 (April 5) and the March low at 129.63 (March 24). A deeper pullback could put the February low at 128.08 (February 2) back on the investors’ radar ahead of the 2023 low at 127.21 (January 16). The daily RSI climbed past the 56 region.
Resistance levels: 134.73 135.13 136.99 (4H chart)
Support levels: 133.54 133.00 132.01 (4H chart)
GBPUSD
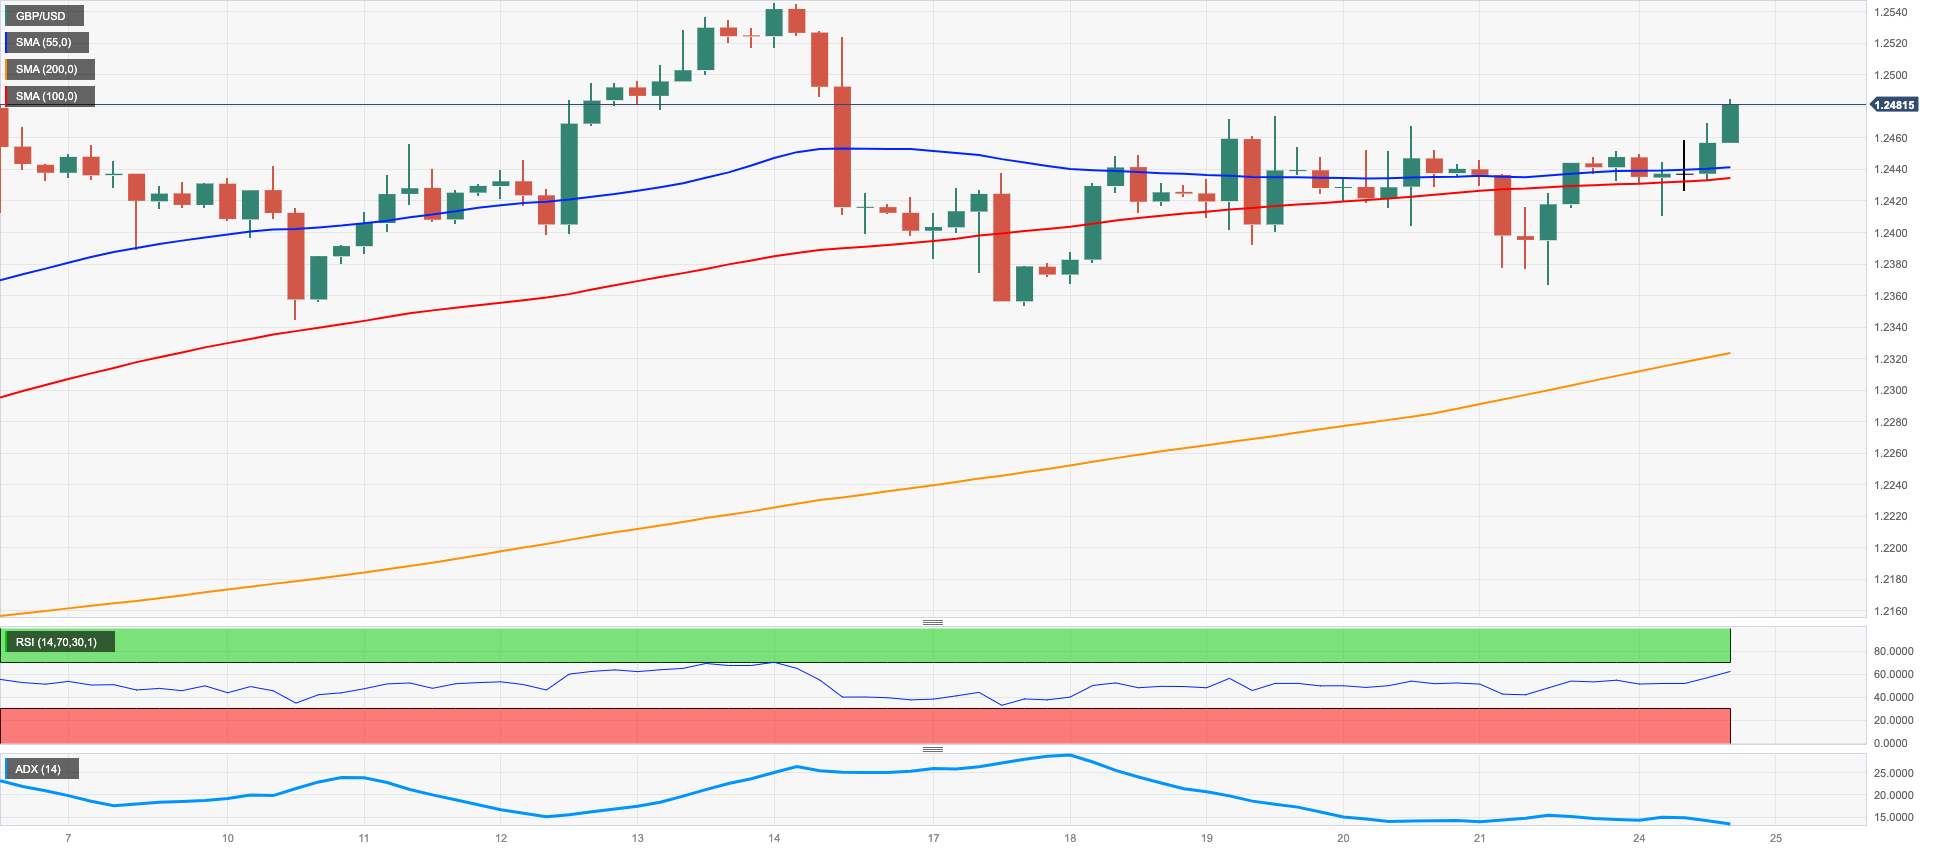
A discouraging start of the week for the greenback lent support to the risk complex and encouraged GBP/USD to fade Friday’s downtick and extend the recovery to the vicinity of the 1.2500 hurdle on Monday.
Indeed, the buying interest around the British pound gathered extra pace pari passu with the rest if its risk-linked peers and helped Cable regain the upside momentum and pave the way for a probable challenge of the so far 2023 peaks near 1.2550 sooner rather than later.
There were no scheduled releases in the UK docket at the beginning of the week, leaving all the attention to Tuesday’s publication of the public sector finances along with gauges from the Confederation of British Industry (CBI) on Tuesday.
GBP/USD seems stuck within a consolidative range so far. The breakout of this range could lead up to a potential test of the 2023 peak at 1.2546 (April 14) prior to the May 2022 high at 1.2666 (May 27) and the 200-week SMA at 1.2864, all preceding the psychological 1.3000 mark. On the flip side, the weekly low at 1.2344 (April 10) is expected to emerge as the initial support ahead of the April low at 1.2274 (April 3) and the interim 55-day SMA at 1.2202. If Cable breaches the latter it could put the key 200-day SMA at 1.1927 to the test prior to the 2023 low at 1.1802 (March 8). The daily RSI picked up pace and poked with.
Resistance levels: 1.2485 1.2546 1.2599 (4H chart)
Support levels: 1.2367 1.2353 1.2305 (4H chart)
AUDUSD
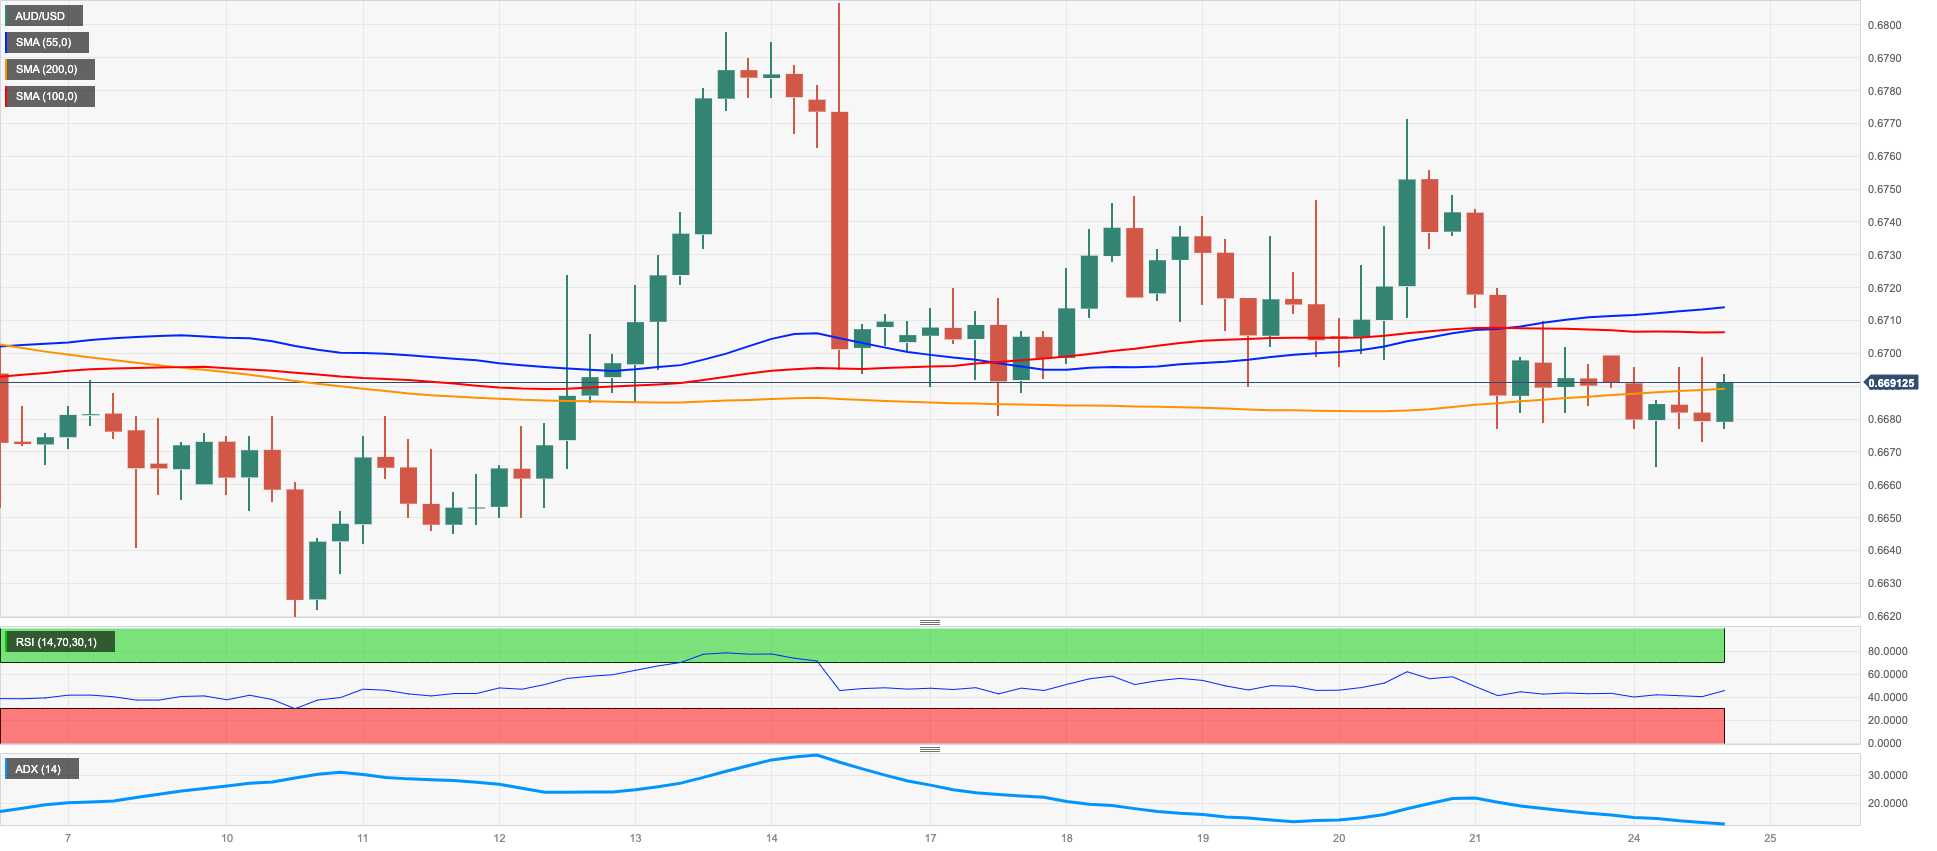
Following the continuation of the bearish performance in the greenback, AUD/USD reversed the initial downtick and managed to flirt with the key hurdle at 0.6700 the figure after two daily pullbacks in a row at the beginning of the week.
Indeed, the Aussie dollar traded with decent gains in spite of the disheartening mood surrounding the commodity universe, where the iron ore slipped back to levels last seen back in early January and copper prices flirted with April lows.
The next salient event in the Australian docket will be the publication of inflation figures for the January-March period, due on Wednesday.
Further decline could force AUD/USD to retest the April low at 0.6619 (April 10) prior to the 2023 low at 0.6563 (March 10) and followed by the weekly low at 0.6386 (November 10 2022) and the November 2022 low at 0.6272 (November 3). On the contrary, a convincing breakout of the key 200-day SMA at 0.6740 should pave the way for an initial test of the weekly high at 0.6771 (April 20) ahead of the April top at 0.6805 (April 14) and the key round level at 0.7000. Extra gains from here could target the weekly peak at 0.7029 (February 14) seconded by the 2023 high at 0.7157 (February 2). The daily RSI slipped back to the sub-47 region.
Resistance levels: 0.6712 0.6771 0.6805 (4H chart)
Support levels: 0.6665 0.6619 0.6589 (4H chart)
GOLD
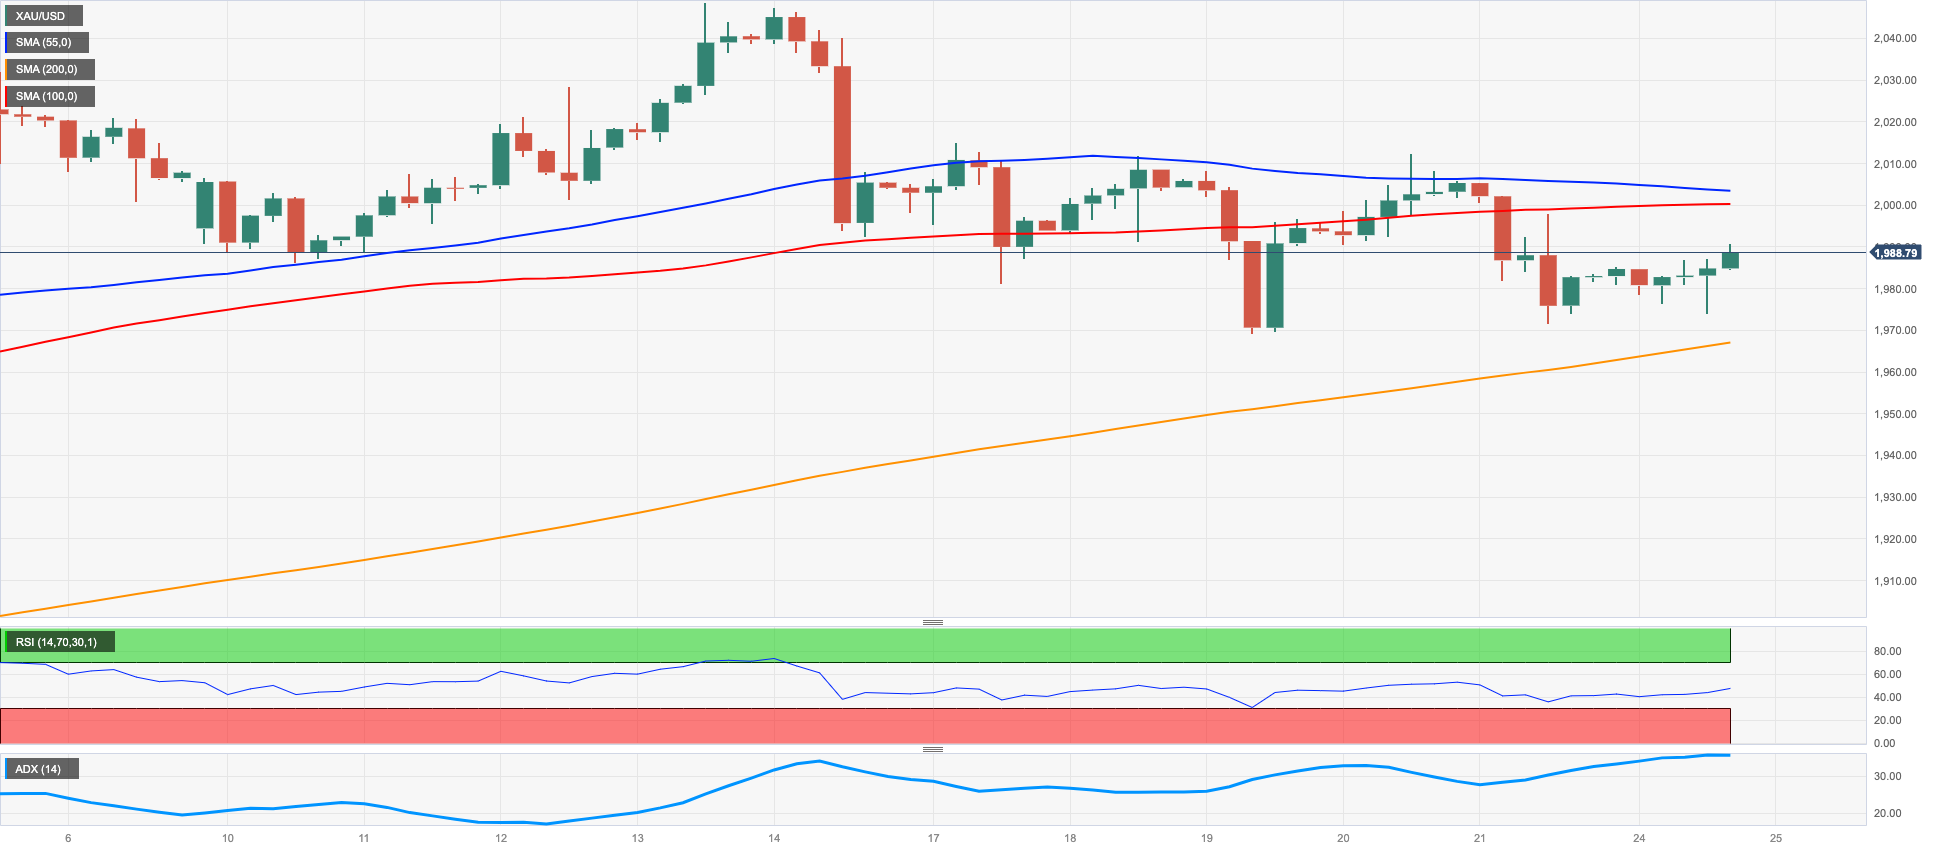
Gold prices found a good reason to reverse part of Friday’s strong pullback in the selling bias surrounding the dollar, as the initial upside in the USD Index (DXY) rapidly fizzled out in the wake of the opening bell in the old continent on Monday.
Also collaborating with the daily uptick in the precious metal resurfaced the renewed downside pressure in US yields across the curve.
It is worth noting that investors seem to have already (almost) fully priced in a 25 bps rate raise by the Federal Reserve at the May gathering. However, the increasing likelihood that the Fed might pause its hiking cycle after next month’s meeting could lend fresh contention to bullion in case of occasional bouts of weakness.
The range bound theme around gold looks unchanged so far. In case of a more lasting recovery, the yellow metal should meet the next resistance level at the 2023 high at $2048 (April 13) followed by the 2022 top at $2070 (March 8) and the all-time peak at $2075 (August 7 2020). The other way around, the weekly low at $1969 (April 19) comes as a minor support ahead of the April low at $1949 (April 3) and another weekly low at $1934 (March 22). The continuation of the decline could see interim contention at the 55- and 100-day SMAs at $1917 and $1888, respectively, revisited prior to the March low at $1809 (March 8) and the 2023 low at $1804 (February 28).
Resistance levels: $2015 $2048 $2070 (4H chart)
Support levels: $1969 $1949 $1934 (4H chart)
CRUDE WTI
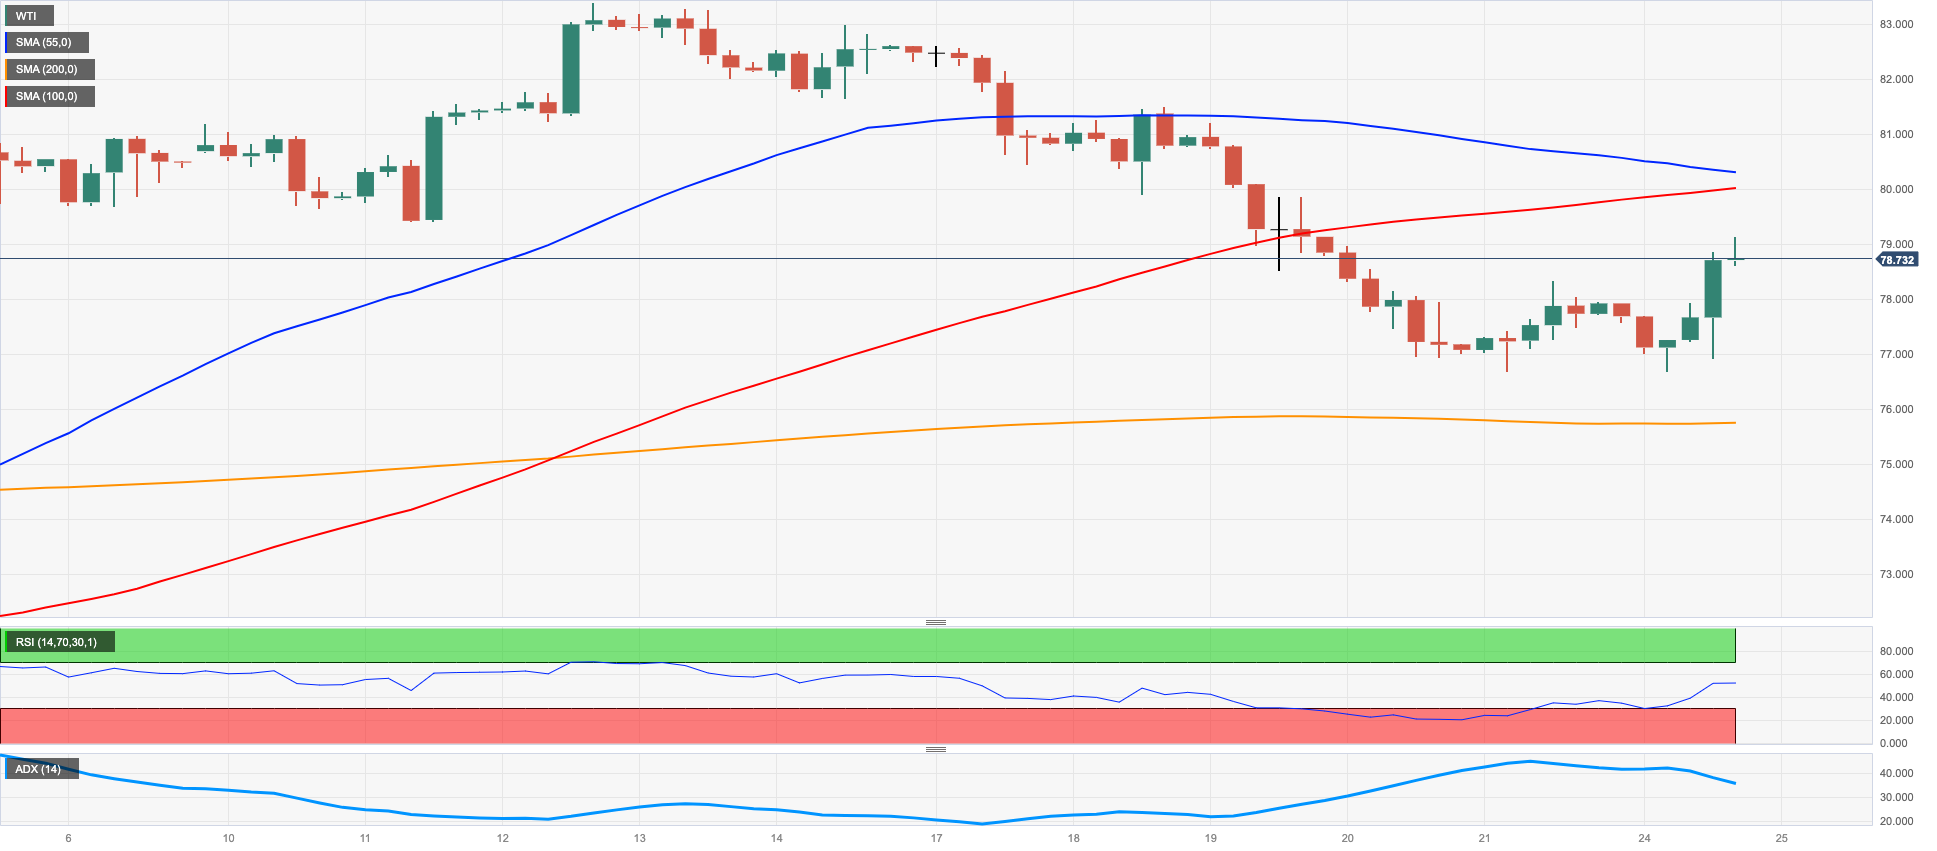
Prices of the WTI advanced for the second consecutive session on Monday, extending at the same time the rebound from last week’s lows in the sub-$77.00 mark per barrel.
Prospects for a strong recovery in China along with persistent tight supply conditions seem to have offset worries stemming from a potential central banks-led economic slowdown as well as the drop in the demand for gasoline.
Later in the week, the API and the EIA will report on weekly US crude oil inventories in the week to April 21 on Tuesday and Wednesday, respectively.
Further upside in the WTI needs to break above the key 200-day SMA at $82.17 to allow for a potential challenge of the 2023 top at $83.49 (April 12) seconded by the November 2022 peak $93.73 (November 7). By contrast, the breakdown of the provisional 55-day SMA at $76.48 could open the door to a move to the key $70.00 mark ahead of the $66.86 level (March 24) and the 2023 low at $64.41 (March 20). South from here, a probable visit to the December 2021 low at $62.46 (December 2) could emerge on the horizon ahead of the key $60.00 mark per barrel.
Resistance levels: $78.98 $81.48 $83.37 (4H chart)
Support levels: $76.66 $75.76 $72.16 (4H chart)
GER40
European markets kicked in the new trading week in the negative territory.
Indeed, investors kept the cautious tone in place on Monday amidst expectations of further corporate earnings reports, while the increasing view that the ECB is still quite far away from halting its hiking cycle also poured some cold water over traders’ sentiment at the beginning of the week.
In the German money market, the 10-year Bund yields rose to 3-day highs past the 2.50% level, in contrast to their US peers.
Data wise in Germany, the closely watched Business Climate tracked by the IFO institute improved slightly to 93.6 in April, while Current Conditions receded to 95 and Expectations rose to 92.2.
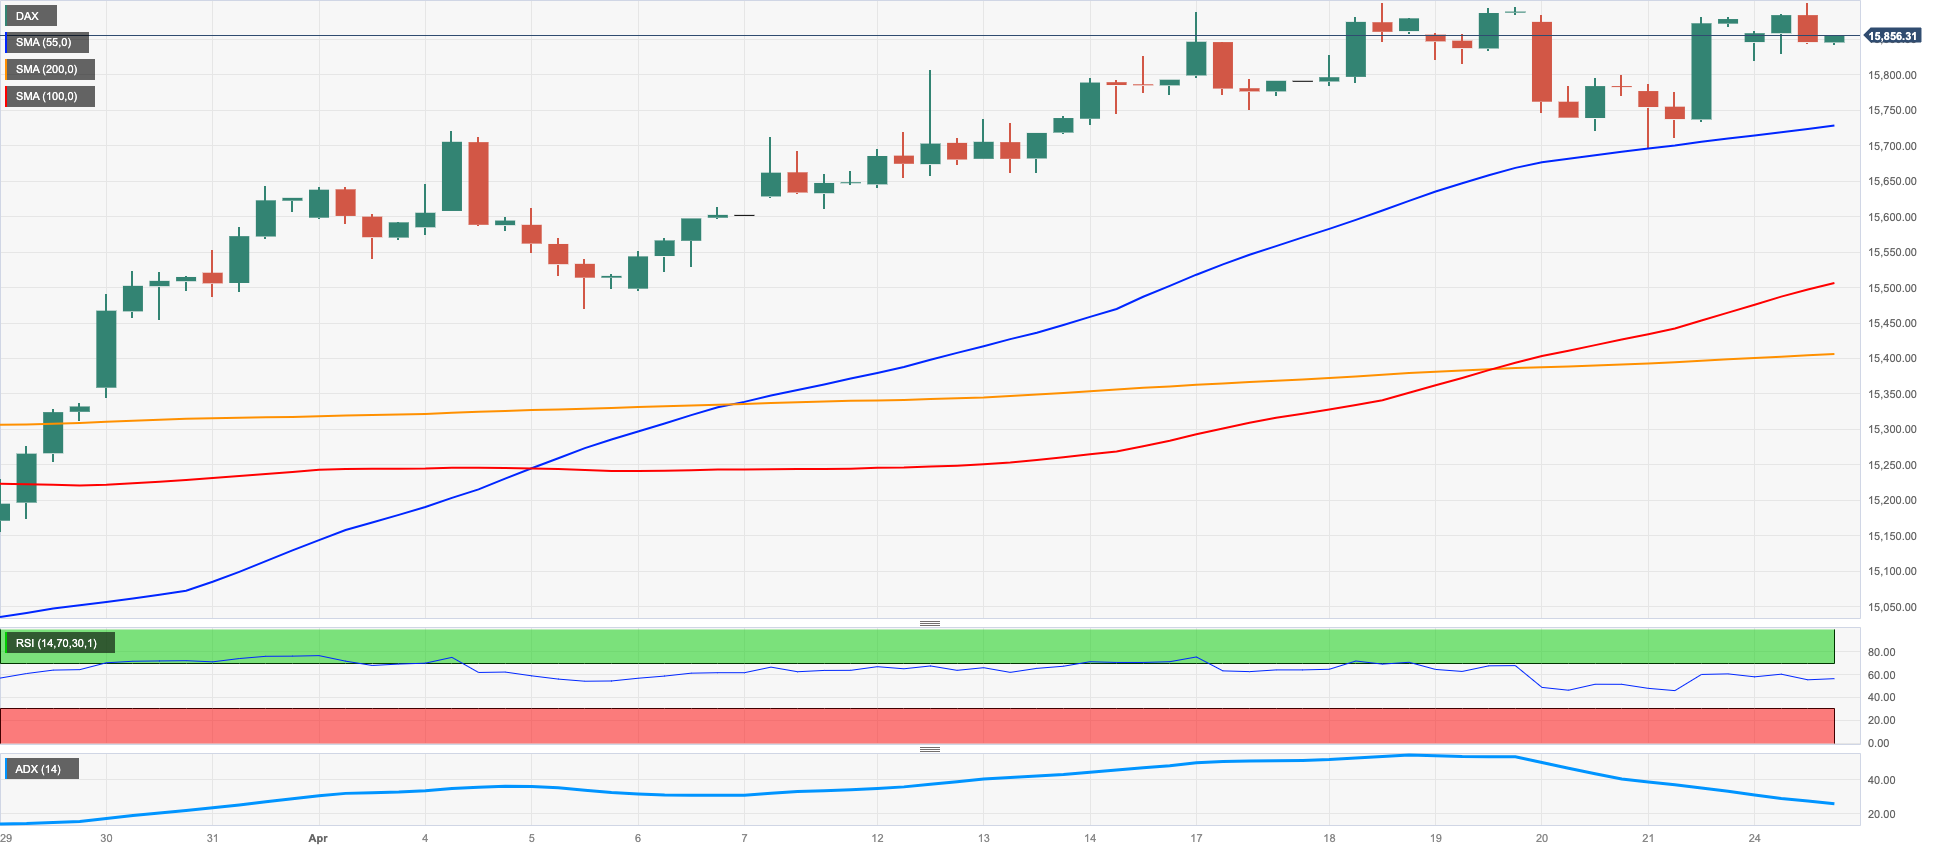
Despite the discouraging start of the week, the DAX40 remains focused on the 2023 top at 15916 (April 18), which is closely followed by the round level at 16000 and the 2022 high at 16285 (January 5). On the other hand, there is an initial support at the April low at 15482 (April 5), which appears bolstered by the vicinity of the temporary 55-day SMA at 15431. A deeper decline could spark a move to another provisional support at the 100-day SMA at 15047 ahead of the minor support at 14809 (March 24) and followed by the March low at 14458 (March 20) and the key 200-day SMA at 14133. The daily RSI receded to the 62 area.
Best Performers: Siemens, Healthineers, Sartorius AG VZO, Brenntag AG
Worst Performers: Zalando SE, Infineon, SAP
Resistance levels: 15919 16090 16285 (4H chart)
Support levels: 15706 15482 15376 (4H chart)
NASDAQ
Tech equities gauged by the reference Nasdaq 100 started the week on the defensive, as the negative performance from electric vehicle maker Tesla impacted on the rest of its peers on Monday.
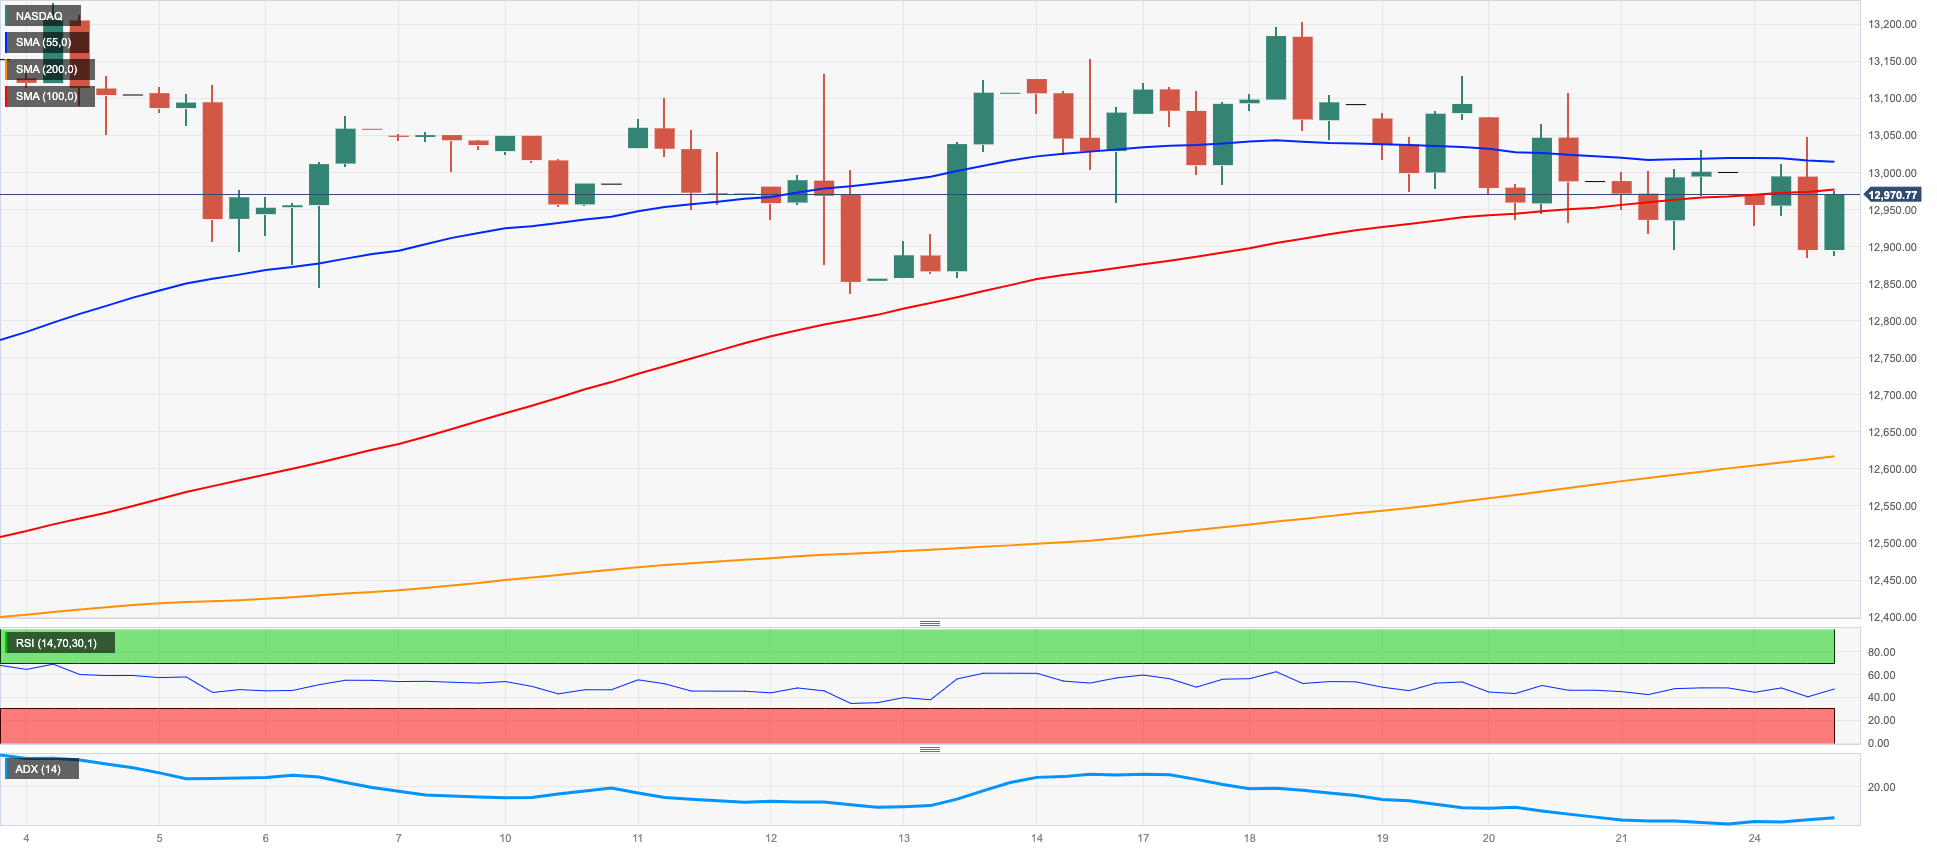
Indeed, the index faded Friday’s humble gains and probed the area of multi-session lows near 12900 before rebounding somewhat at the beginning of the week.
In the meantime, key data releases in the US calendar as well as a heavy week in terms of the publication of earnings reports (Alphabet, Meta, Amazon, Microsoft among other megacaps) are expected to rule the sentiment in the tech sector amidst firm prospects for another rate hike by the Fed as soon as at the May 3 gathering.
If losses accelerate, the Nasdaq 100 could weaken to the April low at 12846 (April 6) ahead of a potential drop to the provisional 55-day SMA at 12569 and the weekly low at 12517 (March 28). Further down lines up the key 200-day SMA at 12031 ahead of the March low at 11695 (March 13) and weekly lows at 11550 (January 25) and 11251 (January 19). A move lower could retest the 2023 low at 10696 (January 6). Instead, the immediate hurdle comes at the 2023 peak at 13204 (April 4) prior to the August 2022 high at 13720 (August 16) and the round level at 14000. The breakout of the latter could put a probable move to the March 2022 high at 15265 (March 29) back on the investors’ radar. The daily RSI lost further momentum and approached 53.
Top Gainers: Zoom Video, Baker Hughes, Diamondback
Top Losers: PDD Holdings DRC, JD.com Inc Adr, Tesla
Resistance levels: 13204 13720 14277 (4H chart)
Support levels: 12833 12517 12071 (4H chart)
DOW JONES
US stocks tracked by the three major indices traded in a mixed fashion at the beginning of the week.
Indeed, investors’ steady prudence ahead of key corporate earnings reports scheduled throughout the week in combination with recession concerns and expectations of further tightening by the Federal Reserve, all left the price action in the Dow Jones largely directionless on Monday.
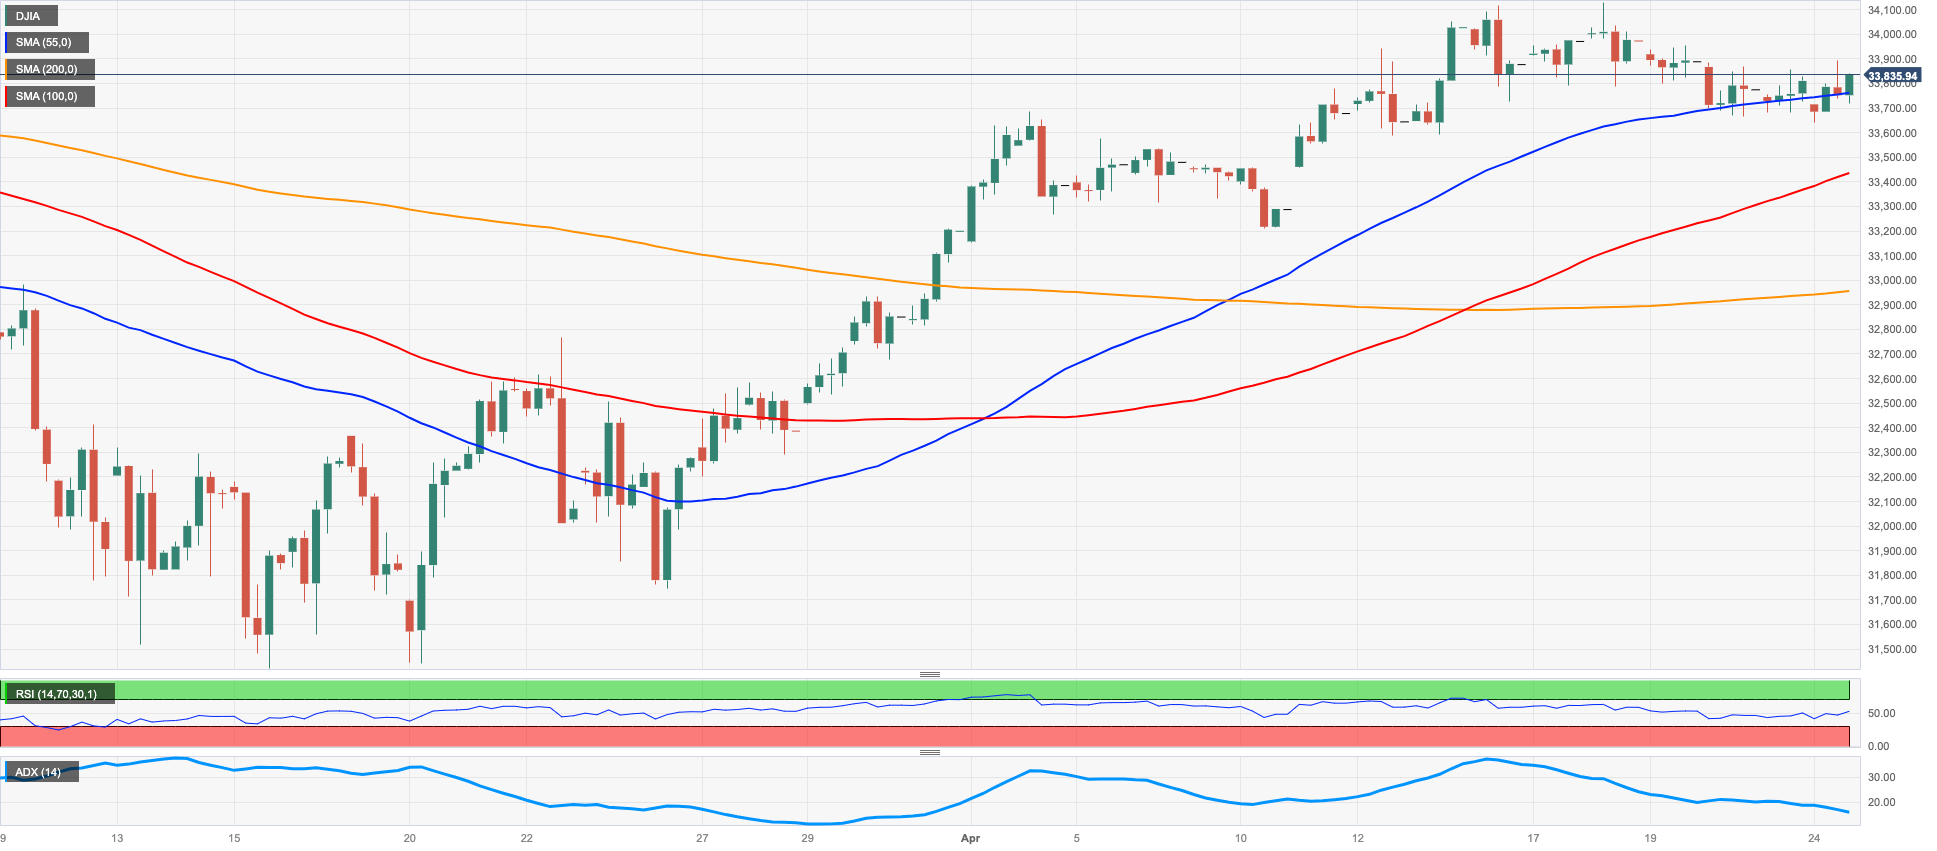
On the whole, the Dow Jones advanced 0.04% to 33821, the S&P500 retreated 0.08% to 4130 and the tech-heavy Nasdaq Composite deflated 0.51% to 12011.
In case sellers regain the initiative, the Dow Jones could slip back to the 100- and 55-day SMAs at 33371 and 33170, respectively, prior to the key 200-day SMA at 32607 and the 2023 low at 31429 (March 15). The loss of the latter could leave the index vulnerable to a deeper retracement to the 30000 level before the 2022 low at 28660 (October 13). To the contrary, the April peak at 34082 aligns as the next resistance level seconded by the 2023 high at 34342 (January 13) and the December 2022 top at 34712 (December 13). The breakout of this level could open the door to a potential test of the April 2022 peak at 35492 (April 21) ahead of the February 2022 high at 35824 (February 9). The daily RSI kept the range near 60.
Top Performers: Chevron, Caterpillar, Goldman Sachs
Worst Performers: Salesforce Inc, Intel, Microsoft
Resistance levels: 34082 34334 34712 (4H chart)
Support levels: 33677 33356 31805 (4H chart)
MACROECONOMIC EVENTS


