
- Contact Us:
-

-

-

-


Daily Market Updates
26 Apr 2023
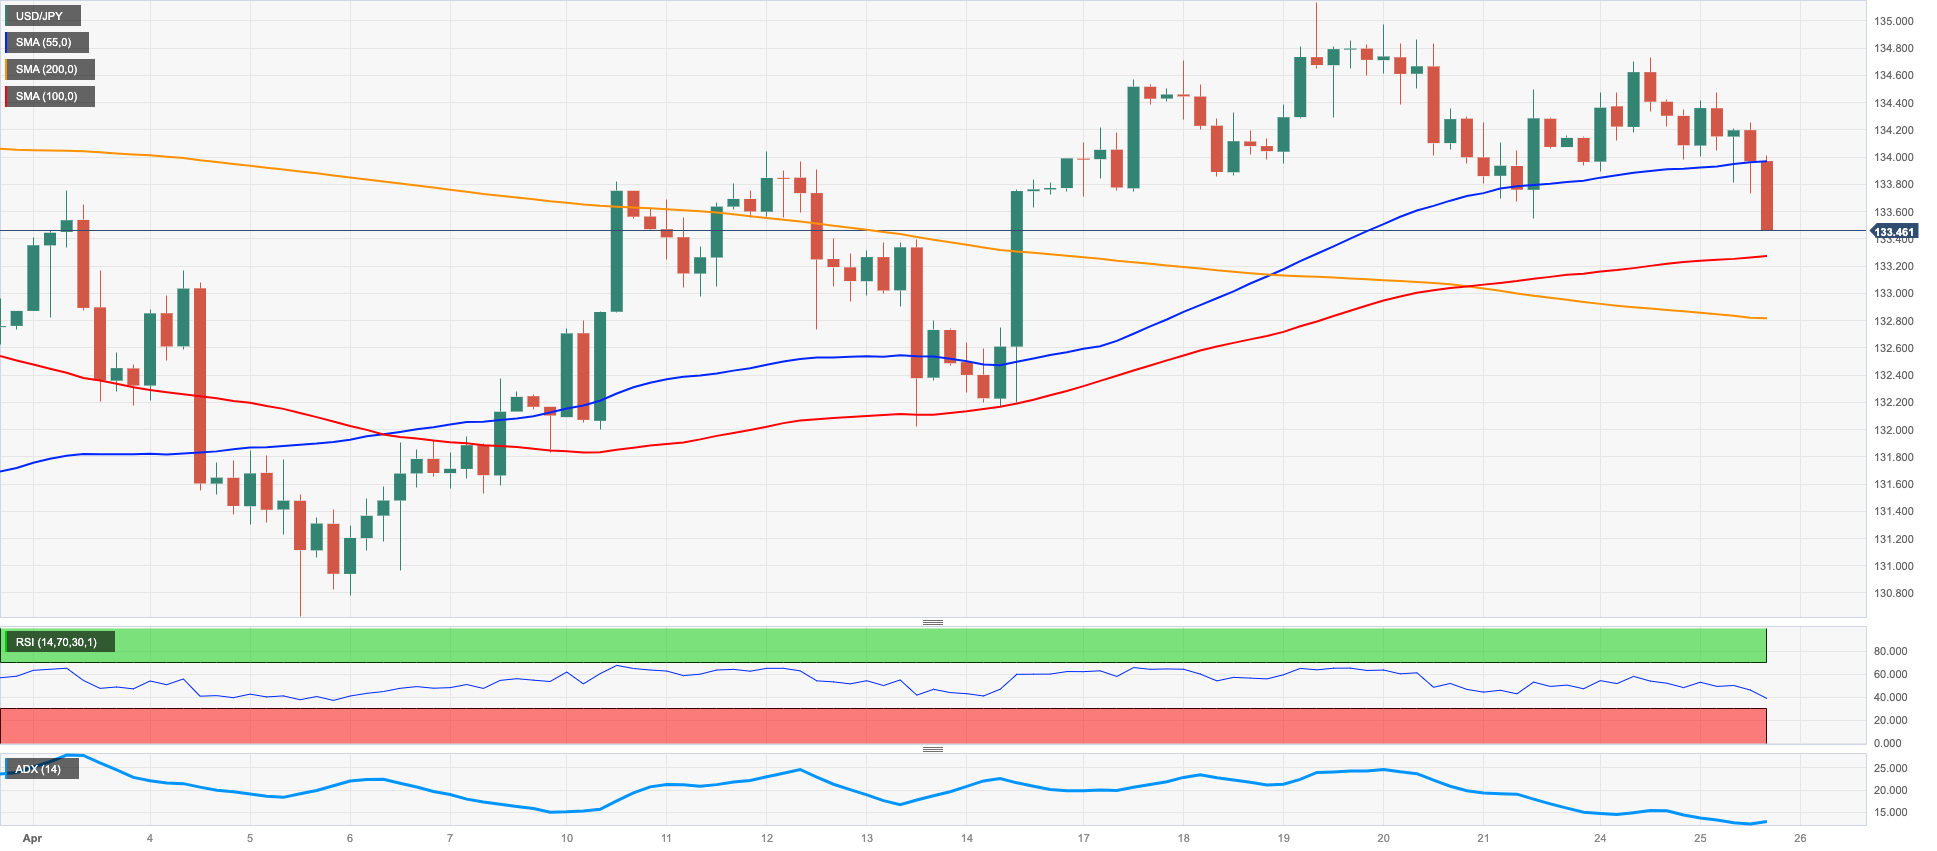
USDJPY
The strong resumption of the risk-off sentiment triggered a bout of fresh demand for the safe haven universe, which in turn morphed into extra support for the Japanese yen.
Against that, USD/JPY dropped well south of the 134.00 support to print new multi-day lows in a move also accompanied by declining US yields across the curve and further side-line trading in the JGB 10-year yields.
At his testimony before Parliament, BoJ Governor K. Ueda said that the Japanese yield curve is now smooth, adding that it seems reasonable to keep the YCC’s easy monetary policy given the current economic, price and financial trends.
Ueda suggested that rates could go up in case wages and inflation grow faster than estimated. Regarding inflation, Ueda noted that cost-push factors are behind higher consumer prices in Japan, at the time when he added that the effects of monetary easing are also driving the gradual increase in inflation trends.
The Japanese calendar remained empty on Tuesday.
Once USD/JPY breaks above the current consolidation, it could challenge the April peak at 135.13 (April 19) prior to the key 200-day SMA at 137.01 and the 2023 high at 137.91 (March 8). The surpass of this level exposes a move to weekly tops at 139.89 (November 30 2022) and 142.25 (November 21 2022). On the flip side, there is interim contention at the 100-day SMA at 132.92 ahead of the April low at 130.62 (April 5) and the March low at 129.63 (March 24). The breach of the latter could prompt the February low at 128.08 (February 2) to emerge on the horizon before the 2023 low at 127.21 (January 16). The daily RSI receded to the 50 neighbourhood.
Resistance levels: 134.73 135.13 136.99 (4H chart)
Support levels: 133.41 132.92 132.01 (4H chart)
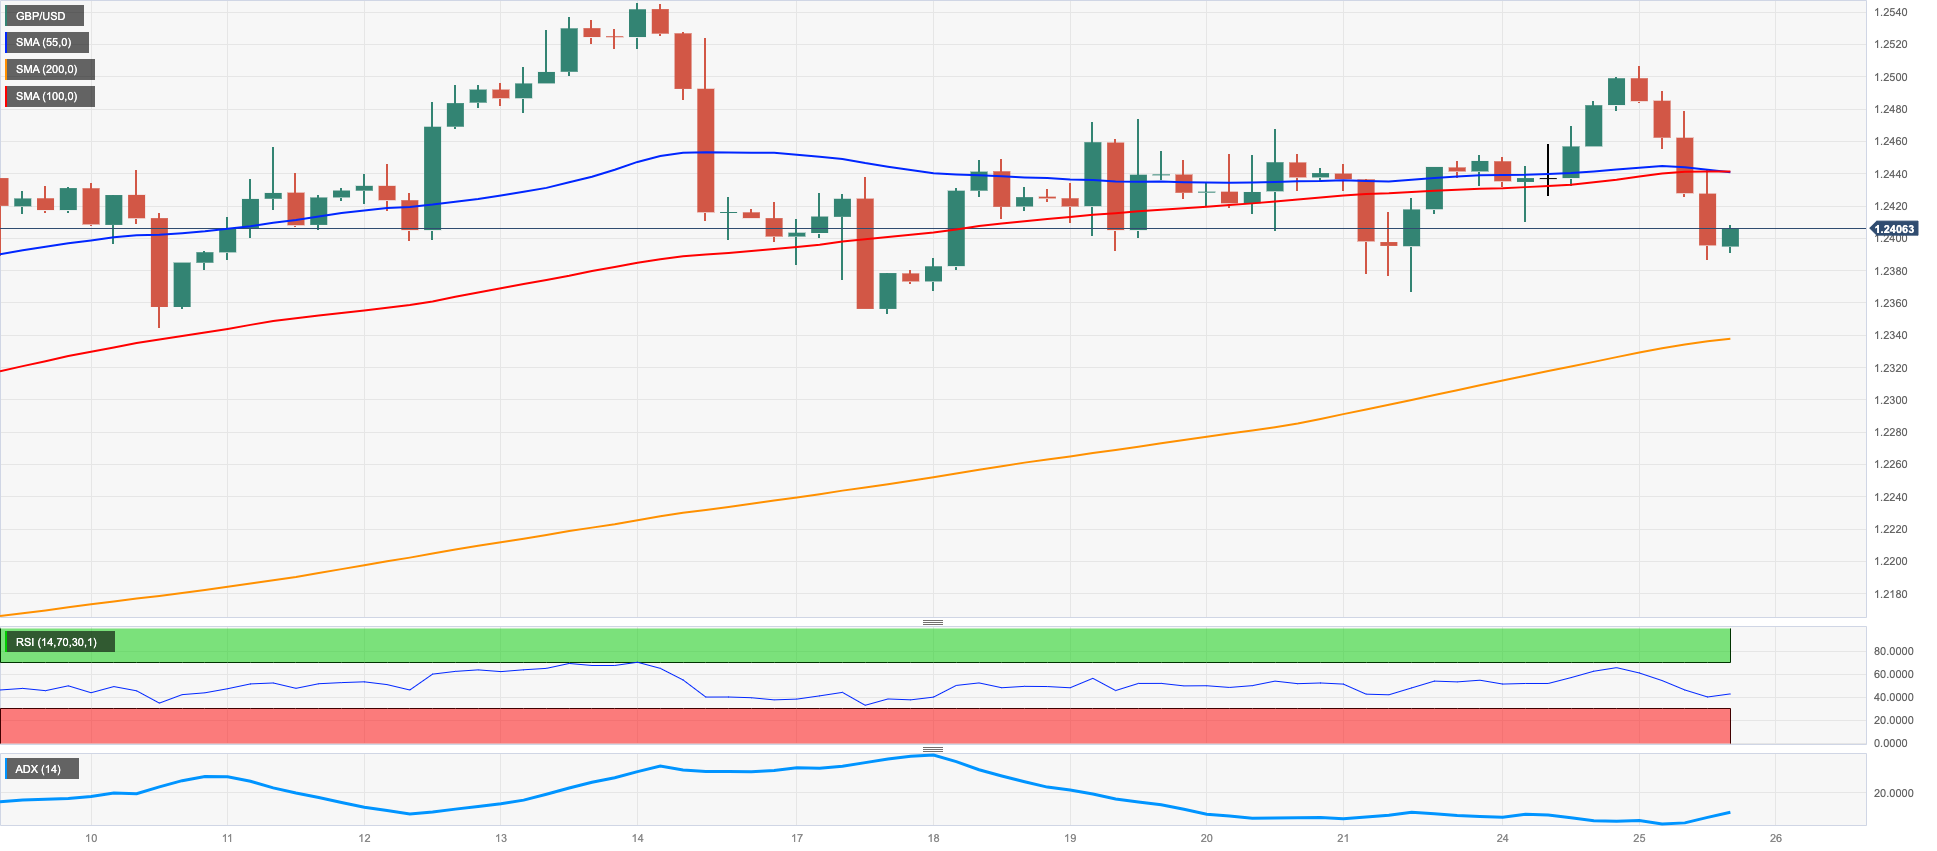
GBPUSD
The prevailing risk-off mood in the global markets lent support to the greenback and sponsored a move to 2-day highs in the USD Index (DXY), which rose to levels just shy of the 102.00 mark on Tuesday.
Against that environment, GBP/USD initially climbed to multi-day peaks just above 1.2500 the figure to end up collapsing to the sub-1.2400 region towards the end of the NA session on Tuesday.
Around the BoE, Deputy Governor B. Broadbent said that inflation was not stoked by QE, adding that the increase in consumer prices in the last couple of years seems outside the view of inflation driven by money supply. Broadbent argued that the BoE policy has not been optimal and hinted at some initial, albeit so far insufficient, easing in wage pressures.
In the UK, Public Sector Net Borrowing rose to £20.71B in March, while the CBI Business Optimism Index improved to -2 in Q2 and Industrial Trends Orders held steady at -20 in April.
GBP/USD maintains the range bound trade so far. In case sellers regain control of the sentiment, Cable could retest the weekly low at 1.2344 (April 10) followed by the April low at 1.2274 (April 3) and the provisional 55-day SMA at 1.2209. South from here aligns the key 200-day SMA at 1.1929 before the 2023 low at 1.1802 (March 8). In opposition, the immediate resistance emerges at the 2023 high at 1.2546 (April 14) seconded by the May 2022 top at 1.2666 (May 27) and the 200-week SMA at 1.2864, all ahead of the psychological 1.3000 level. The daily RSI deflated markedly to the proximity of 53.
Resistance levels: 1.2507 1.2546 1.2599 (4H chart)
Support levels: 1.2386 1.2367 1.2353 (4H chart)
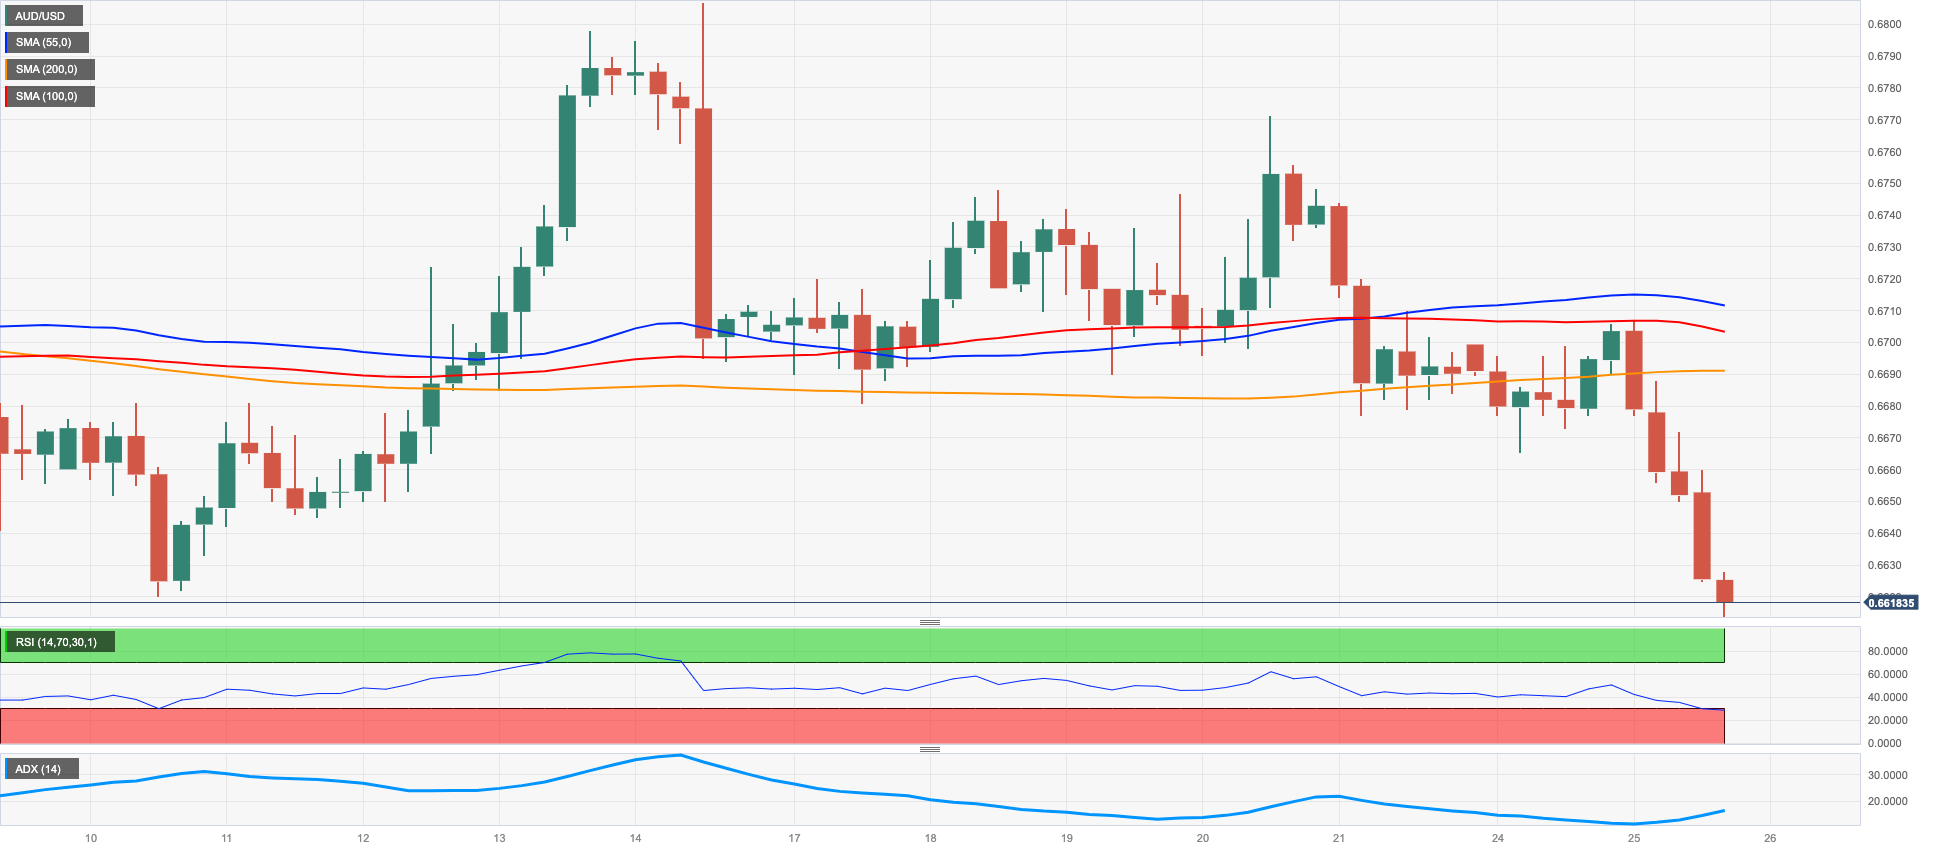
AUDUSD
The worsening conditions in the risk-linked galaxy weighed heavily on the Aussie dollar and dragged AUD/USD to the area of 6-week lows near 0.6610 on turnaround Tuesday.
Extra weakness hurting the pair came from another (very) negative session in the commodity universe, where both copper prices and the iron ore extended the ongoing leg lower.
There were no events/results in Australia due to the ANZAC Day holiday.
The breakdown of the April low at 0.6614 (April 25) could force AUD/USD to embark on a corrective decline to, initially, the 2023 low at 0.6563 (March 10) prior to the weekly low at 0.6386 (November 10 2022) and the November 2022 low at 0.6272 (November 3). Just the opposite, bulls need to clear the key 200-day SMA at 0.6739 in a convincing fashion to open the door to a probable visit to the weekly top at 0.6771 (April 20) before the April peak at 0.6805 (April 14) and the key round level at 0.7000. Further up emerges the weekly high at 0.7029 (February 14) followed by the 2023 top at 0.7157 (February 2). The daily RSI plummeted to the boundaries of 41.
Resistance levels: 0.6687 0.6771 0.6805 (4H chart)
Support levels: 0.6614 0.6589 0.6563 (4H chart)
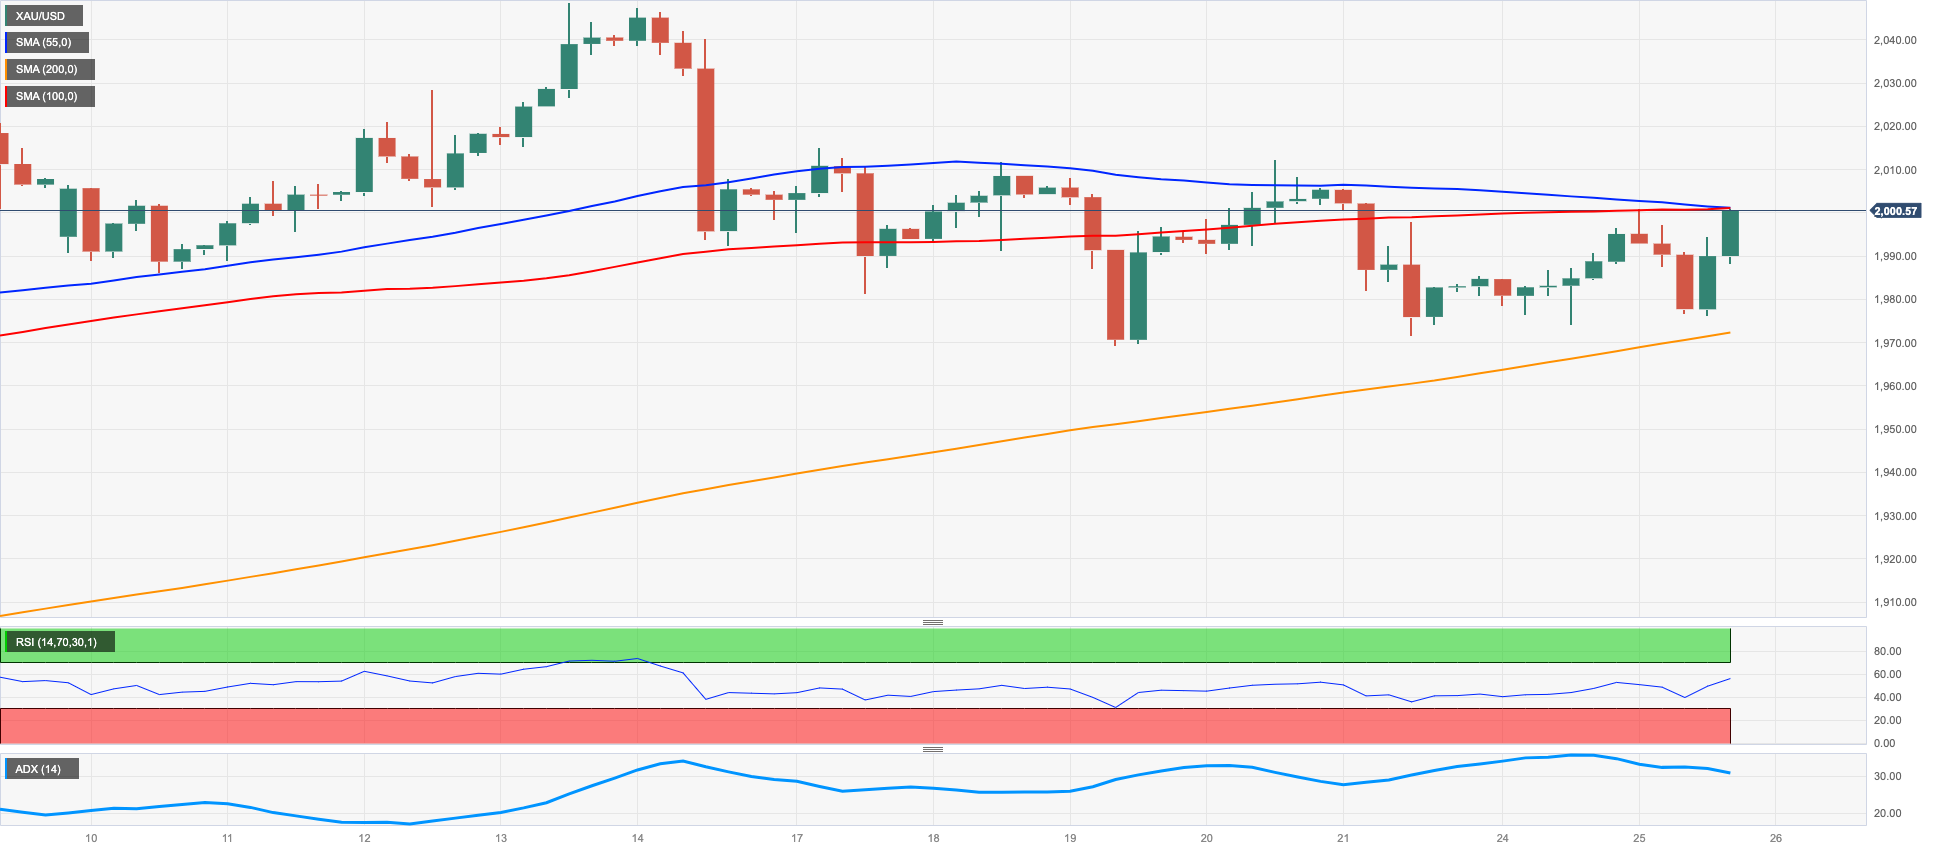
GOLD
Prices of the yellow metal managed to surpass the key $2000 mark per ounce troy on Tuesday, adding to Monday’s advance at the same time.
Despite the daily uptick, price action around bullion maintained the current side-lined trading in spite of the sharp rebound in the greenback, while the persistent risk-off mood underpinned the demand for the precious metal.
In addition, another negative session in US yields across the curve propped up the upside in gold, while fresh banking concerns added to the demand for the safe haven metal.
Immediately to the upside for gold comes the 2023 top at $2048 (April 13) ahead of the 2022 peak at $2070 (March 8) and seconded by the all-time high at $2075 (August 7 2020). On the contrary, there is an initial support at the weekly low at $1969 (April 19) followed by the April low at $1949 (April 3). Down from here appears provisional contention at the 55- and 100-day SMAs at $1919 and $1890, respectively, ahead of the March low at $1809 (March 8) and the 2023 low at $1804 (February 28).
Resistance levels: $2015 $2048 $2070 (4H chart)
Support levels: $1966 $1949 $1934 (4H chart)
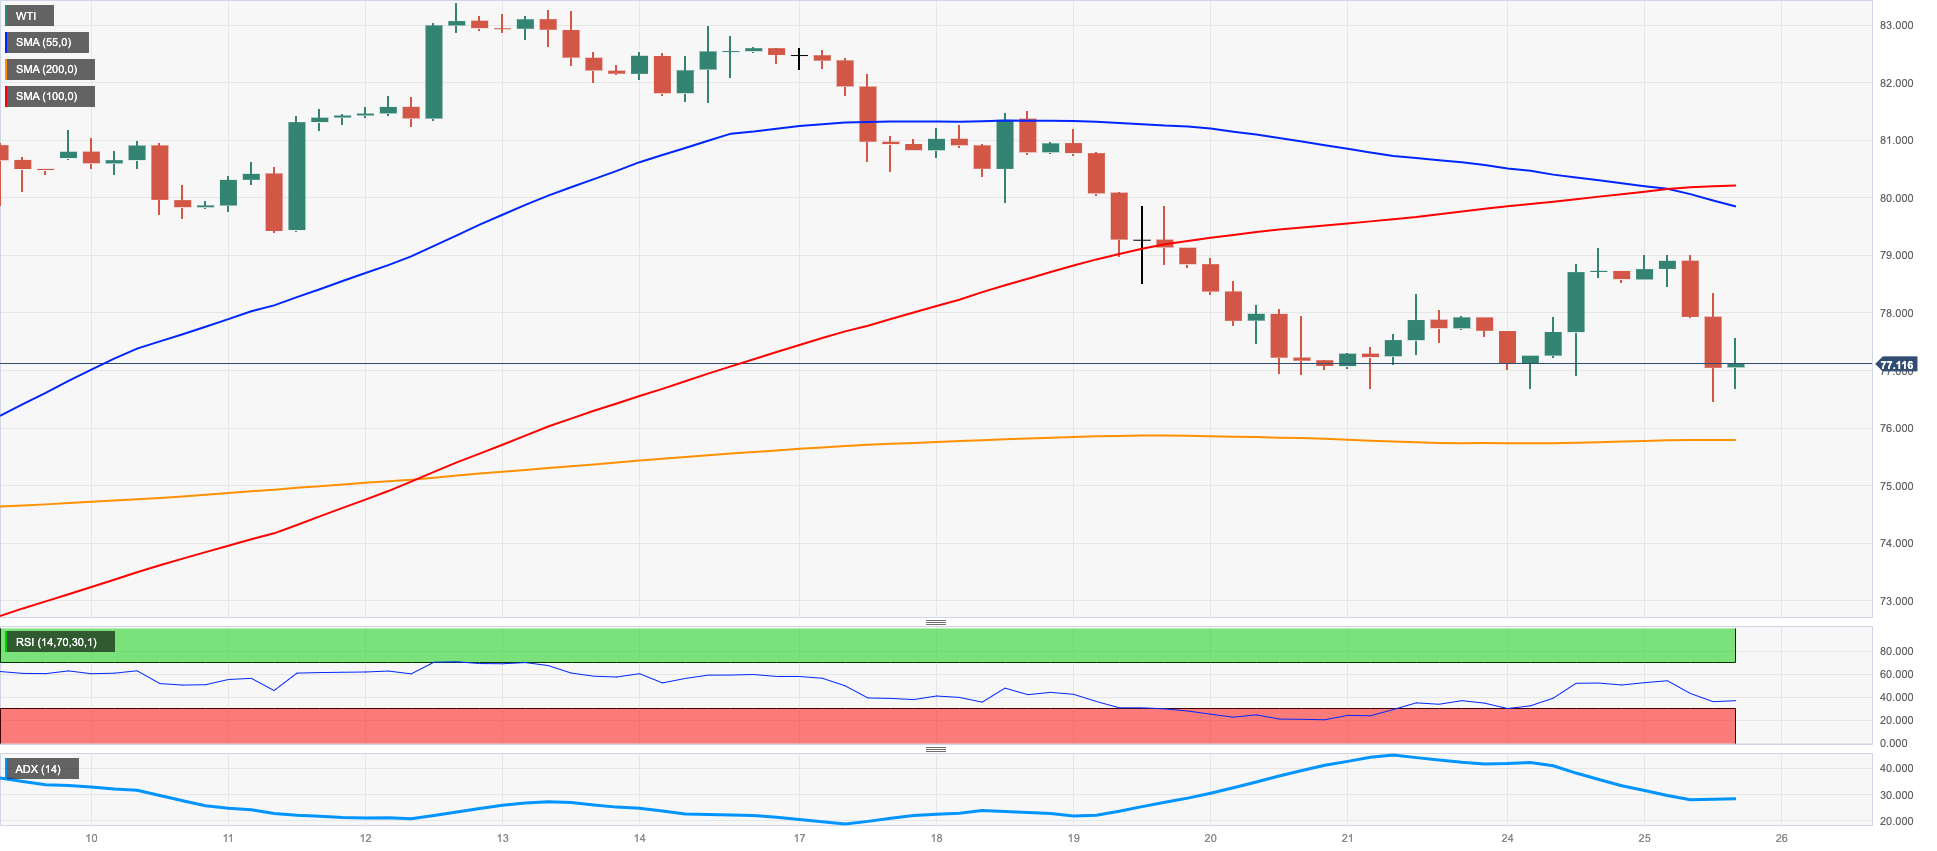
CRUDE WTI
The resurgence of recession concerns in combination with the strong recovery in the dollar and the broad-based sentiment tilted towards the risk-off trade, all forced prices of the WTI to drop to 4-week lows near $76.50 on Tuesday.
Furthermore, the commodity faded the early optimism surrounding a recovery in China and its impact on the demand for crude oil, prompting prices of the American reference for the sweet light crude oil to set aside two consecutive daily advances.
Later in the session, the API will report on the weekly US oil supplies in the week to April 21 (-1.7M barrels exp.) ahead of Wednesday’s report by the EIA.
The WTI has practically filled the post-OPEC+ meeting gap seen earlier in the month. The continuation of the decline could now see the temporary 55-day SMA at $76.44 revisited ahead of the key $70.00 mark and the $66.86 level (March 24). Further south emerges the 2023 low at $64.41 (March 20) prior to the December 2021 low at $62.46 (December 2) seconded by the key $60.00 mark per barrel. On the opposite side, the immediate hurdle appears at the key 200-day SMA at $82.31 before the 2023 peak at $83.49 (April 12) and the November 2022 high $93.73 (November 7).
Resistance levels: $79.14 $81.48 $83.37 (4H chart)
Support levels: $76.57 $75.76 $72.16 (4H chart)
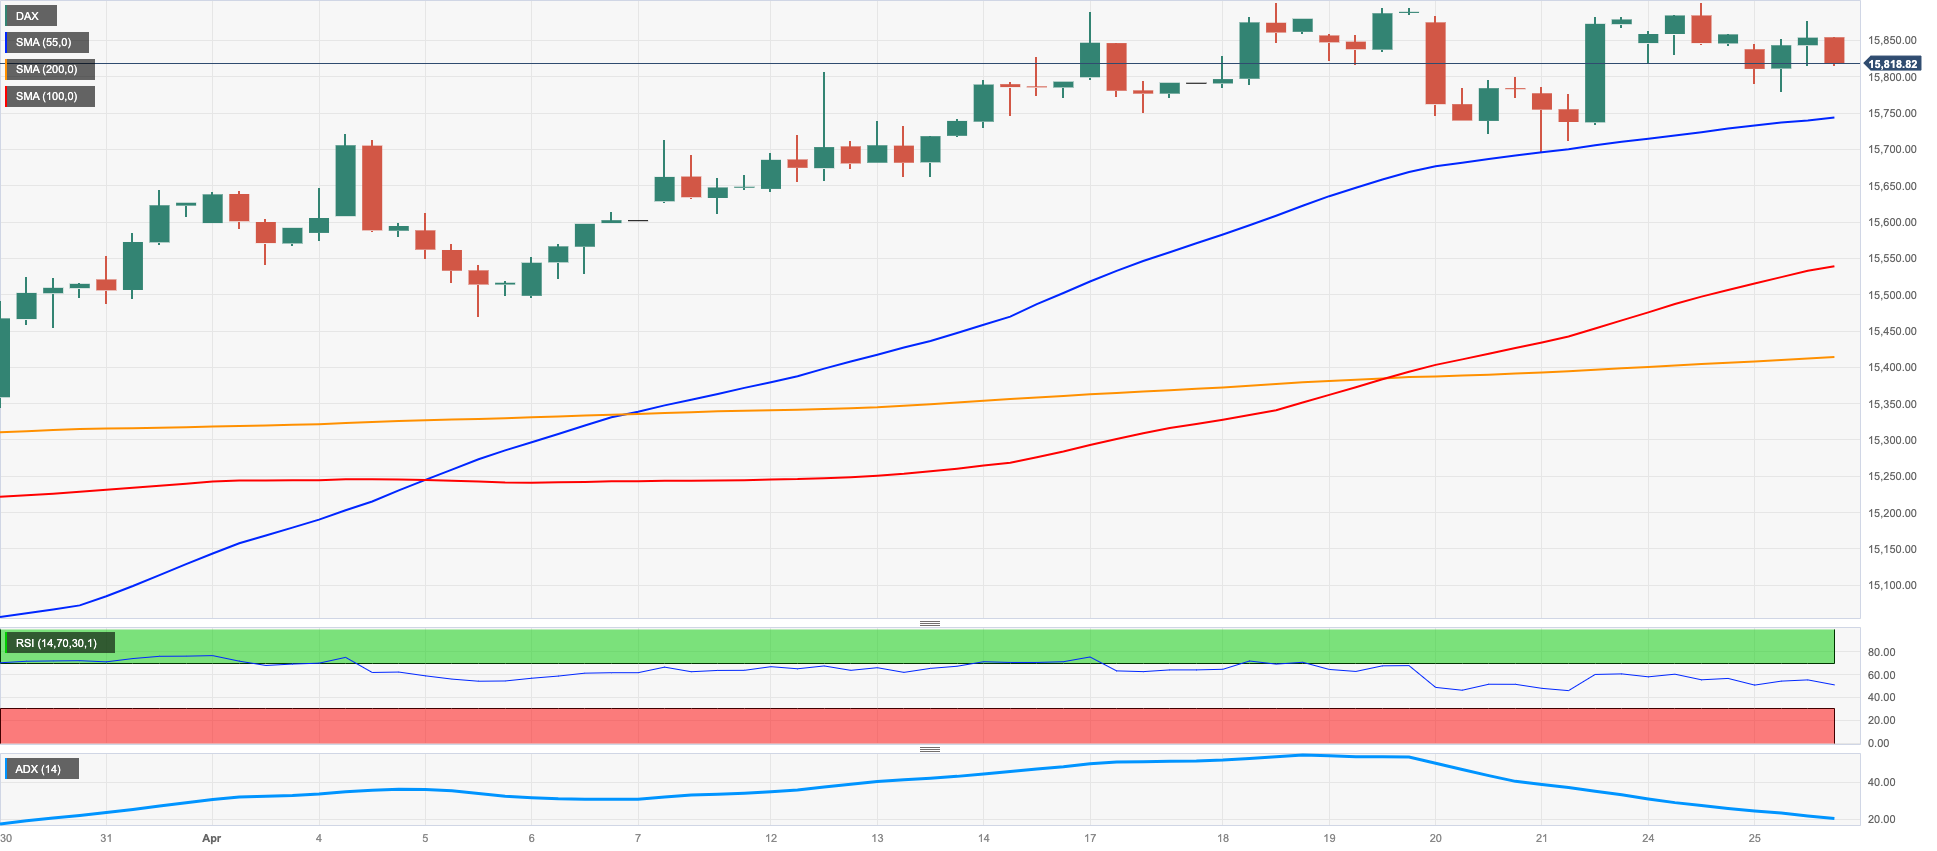
GER40
European markets closed Tuesday’s session mostly in the red territory, with the exception of the German reference DAX40 (+0.05%).
Disappointing results from corporate earnings reports weighed on investors’ mood along with fresh concerns around the banking sector on both sides of the Atlantic also kept European equities under pressure.
In addition, the 9-month drop in the US Consumer Confidence in April also fuelled concerns surrounding a potential recession in the US economy.
Following the prevailing risk aversion, the 10-year Bund yields corrected sharply lower to the 2.35%, or multi-session lows.
The DAX40 kept the range bound theme unchanged on Tuesday. That said, the next resistance remains at the 2023 peak at 15916 (April 18) just ahead of the round level at 16000 and the 2022 top at 16285 (January 5). To the contrary, the April low at 15482 (April 5) still looks underpinned by the provisional 55-day SMA at 15438, while the breach of this area could spark a deeper retracement to the interim 100-day SMA at 15060. South from here, a test of the minor support at 14809 (March 24) could start shaping up prior to the March low at 14458 (March 20) and the key 200-day SMA at 14149. The daily RSI remained around the 62 zone.
Best Performers: Daimler Truck Holdings, SAP, Deutsche Boerse
Worst Performers: Deutsche Bank AG, Sartorius AG VZO, Commerzbank
Resistance levels: 15919 16090 16285 (4H chart)
Support levels: 15706 15482 15387 (4H chart)
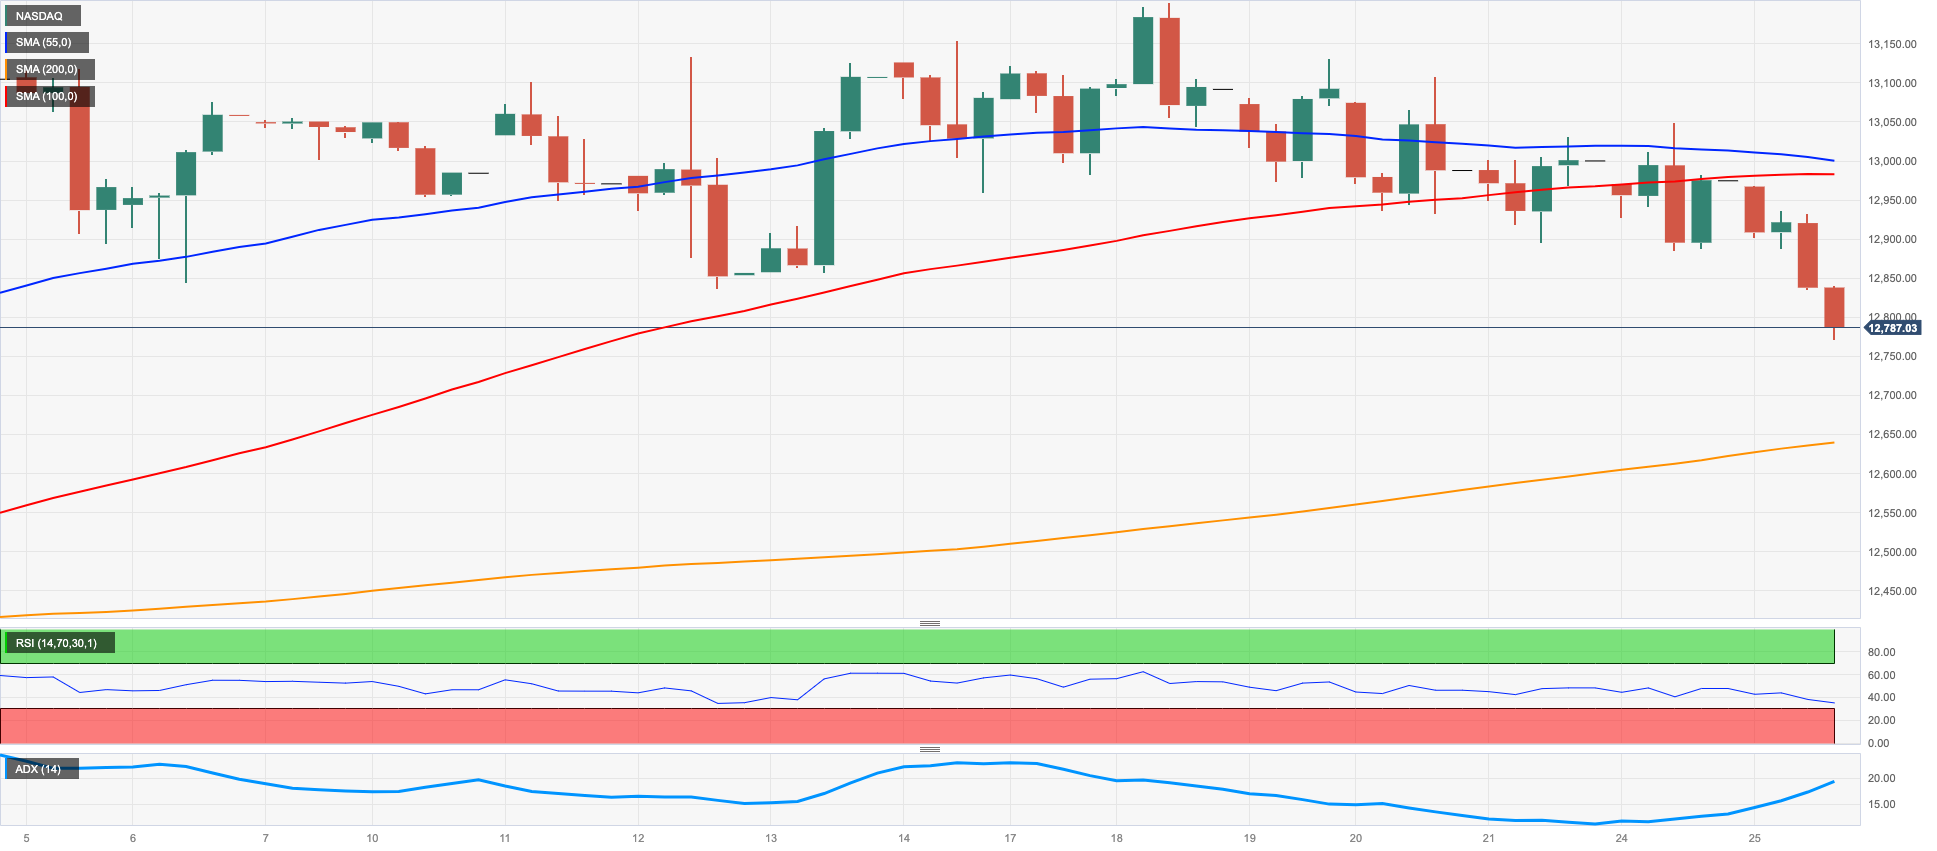
NASDAQ
Rising concerns over a potential economic slowdown, banking woes and the move higher in the greenback weighed on the tech sector and dragged the benchmark Nasdaq 100 to new 4-week lows near 12800.
In addition, prudence ahead of earnings reports from megacaps Alphabet and Microsoft (due following the closing bell in Wall St) also collaborated with the downside bias in the index.
Next on the downside for the Nasdaq 100 emerges the interim 55-day SMA at 12573 ahead of the weekly low at 12517 (March 28) and the key 200-day SMA at 12031. The loss of this zone could prompt the March low at 11695 (March 13) to emerge on the horizon ahead of weekly lows at 11550 (January 25) and 11251 (January 19), all prior to the 2023 low at 10696 (January 6). On the other hand, the 2023 high at 13204 (April 4) still emerges as the next up-barrier before the August 2022 top at 13720 (August 16) and the round level at 14000. North from here the index could retest the March 2022 top at 15265 (March 29). The daily RSI lost the grip and sank below 48.
Top Gainers: Fiserv, PepsiCo, Keurig Dr Pepper
Top Losers: Zscaler, Atlassian Corp Plc, Crowdstrike Holdings
Resistance levels: 13204 13720 14277 (4H chart)
Support levels: 12766 12517 12084 (4H chart)
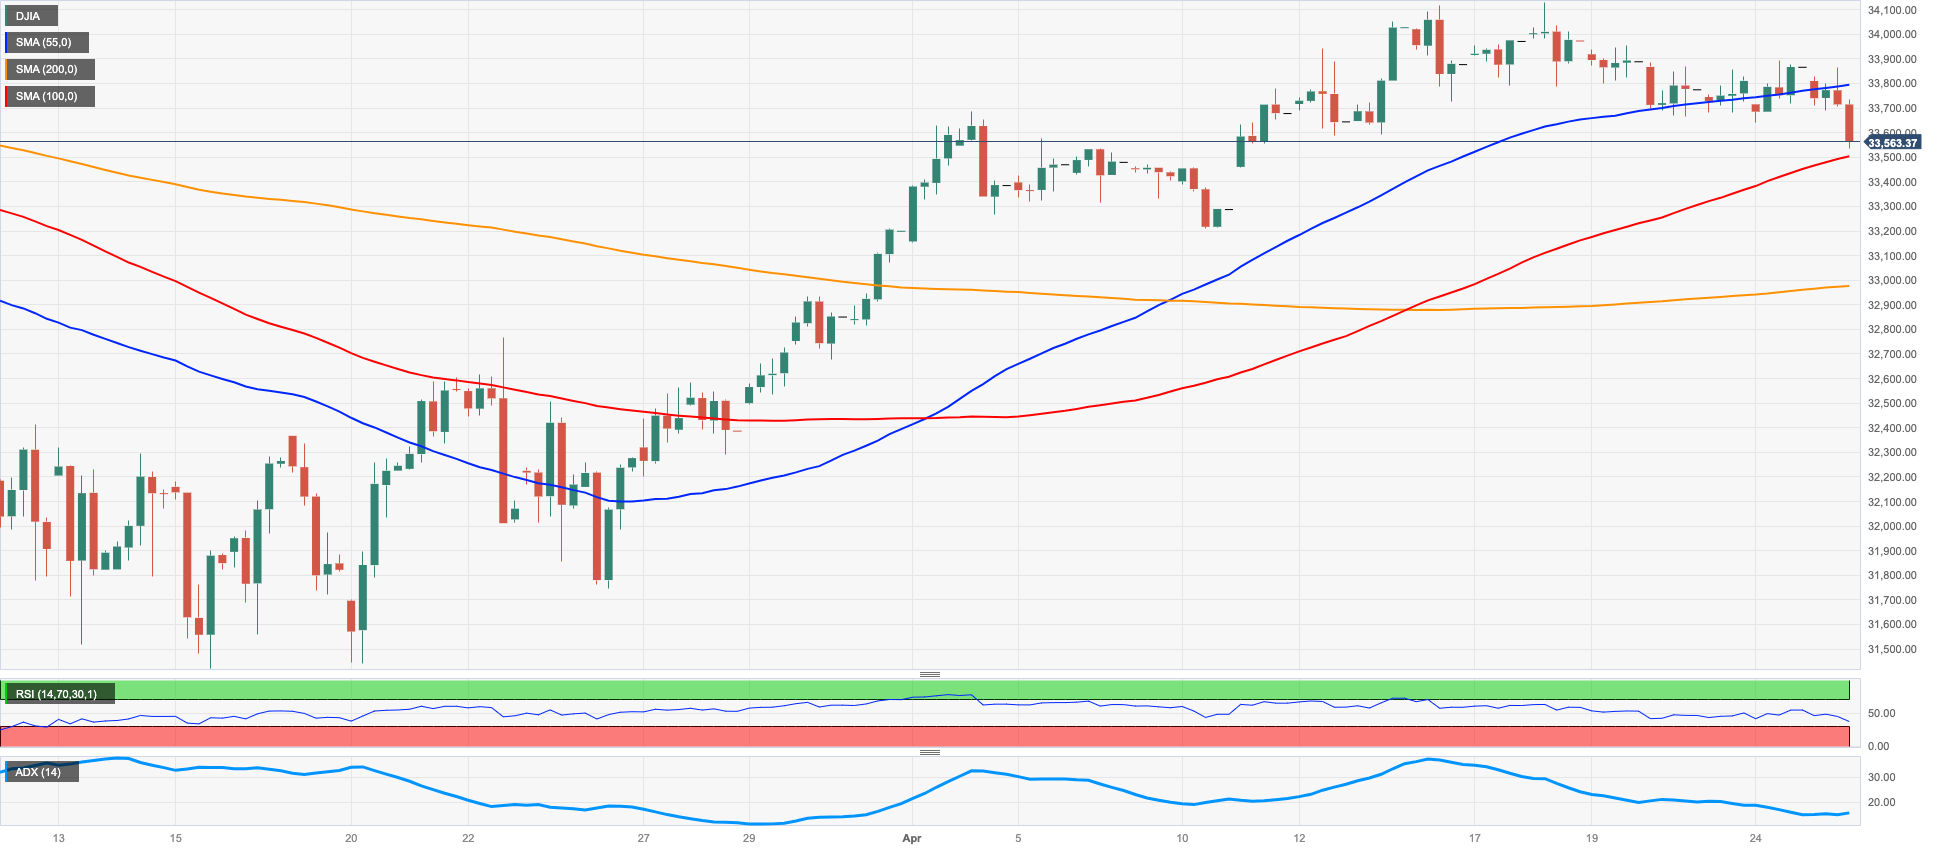
DOW JONES
Red was the prevailing colour among US equities on Tuesday, as the Dow Jones retreated 0.95% to 33552, the S&P500 lost 1.2443 to 4077 and the tech-benchmark Nasdaq Composite dropped 1.74% to 11827.
Persistent risk-off sentiment on the back of the re-emergence of banking concerns, the stronger dollar and recession fears coupled with disappointing corporate results to drag the three major US stocks to multi-day lows on Tuesday.
In addition, the unexpected drop in the US Consumer Confidence gauge to multi-month lows in April added to the sour mood among market participants in the first half of the week.
Extra retracement could motivate the Dow Jones to challenge interim contention levels at the 100- and 55-day SMAs at 33369 and 33165, respectively, ahead of the key 200-day SMA at 32619. Once this region is cleared, the index could spark a deeper decline to the 2023 low at 31429 (March 15) ahead of the 30000 level and the 2022 low at 28660 (October 13). By contrast, the April high at 34082 comes first prior to the 2023 top at 34342 (January 13) and the December 2022 peak at 34712 (December 13). The surpass of the latter could pave the way for a move to the April 2022 high at 35492 (April 21) seconded by the February 2022 top at 35824 (February 9). The daily RSI dropped markedly to the 54 region.
Top Performers: J&J, UnitedHealth, Amgen
Worst Performers: Dow, Nike, American Express
Resistance levels: 34082 34334 34712 (4H chart)
Support levels: 33553 33354 31805 (4H chart)
MACROECONOMIC EVENTS

All Information & Updates provided by:

All information relating to the financial markets available on this page has been prepared and issued by FXStreet (Forexstreet SL, Spain, Reg: B62498233) on the basis of publicly available information and all information believed to be reliable and does not conflict with Kuwaiti local laws, and all necessary care has been taken to before the company to ensure that the facts mentioned are correct from the source.
NCM Investment nor any of its directors or employees shall in any way be held responsible for the contents of this news, and the information contained on this page is intended only to provide clients with publicly available information and should not be construed as investment advice, report or analysis and/or constitute an offer or invitation to buy or sell financial instruments of any kind.
RISK WARNING: Forex and CFDs are highly risky leveraged products, as losses can exceed deposits. Please ensure you understand all the risks and take independent advice if necessary. NCM will segregate the clients based on the criteria of the regulator and its bylaws. NCM does not provide any advisory service; the material published does not constitute advice or a recommendation for a transaction in any financial instrument. NCM accepts no responsibility for any use of the content presented and any consequences of that use. Anyone acting on the information provided does so at their own risk.