
- Contact Us:
-

-

-

-


Daily Market Updates
27 Apr 2023
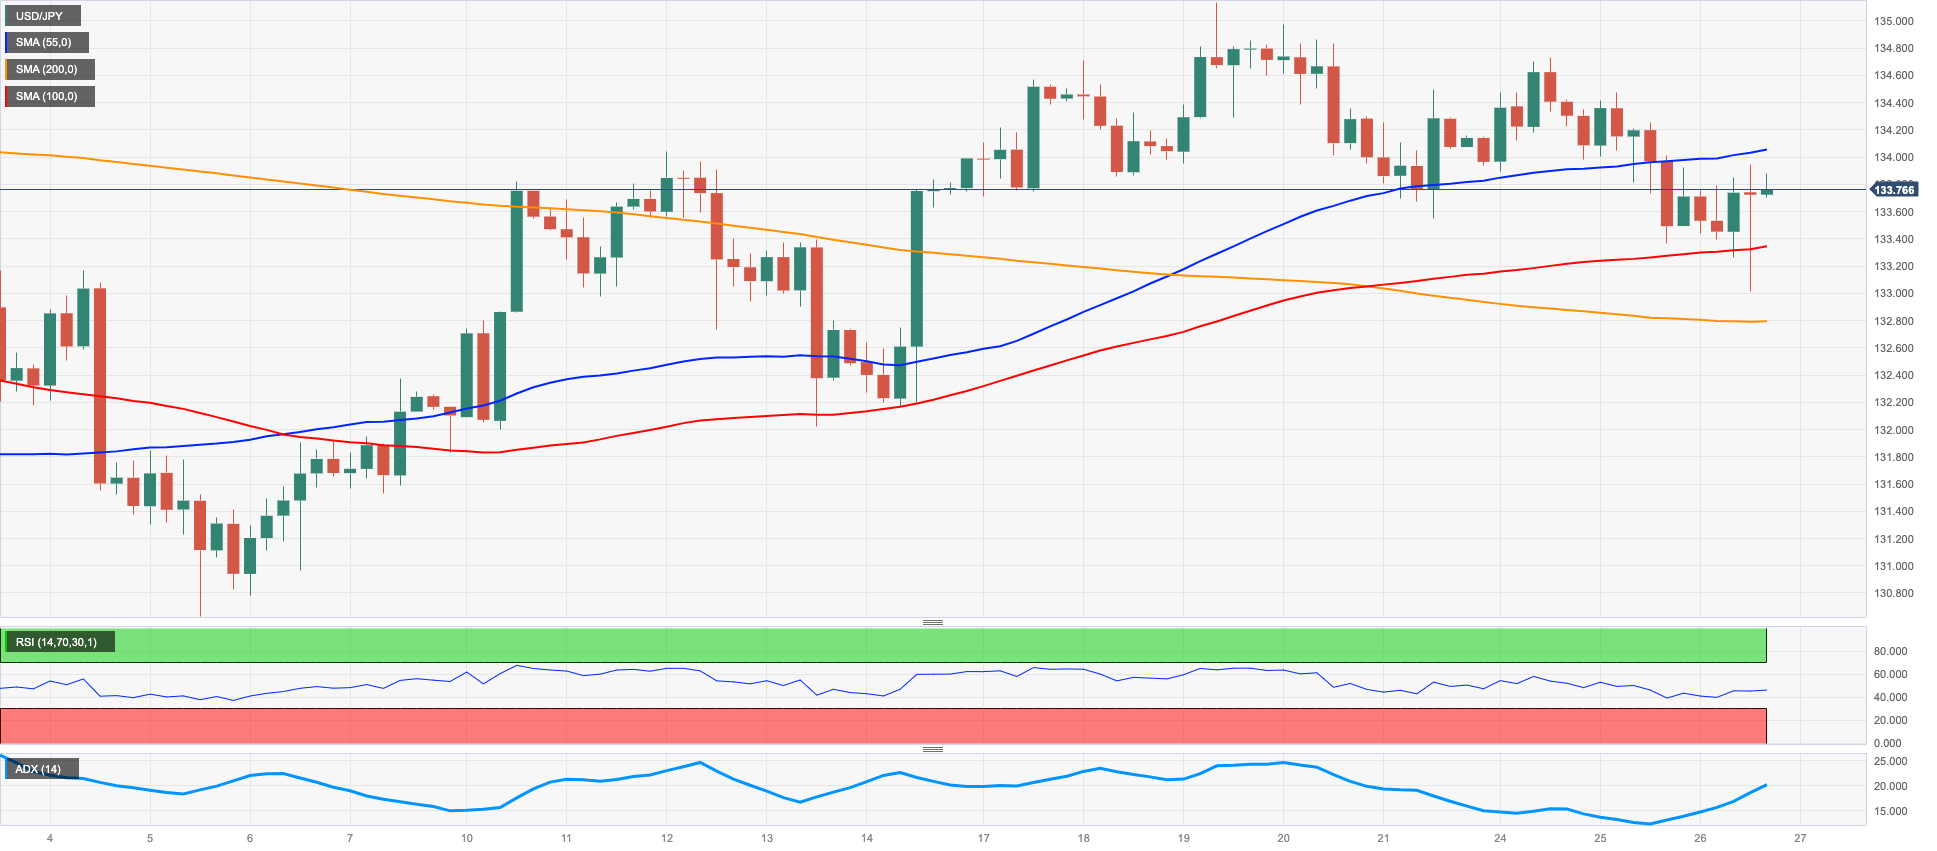
USDJPY
The re-emergence of the appetite for the risk-linked galaxy in combination with the U-turn in US yields prompted USD/JPY to partially fade Tuesday’s advance and climb to the boundaries of the 134.00 hurdle on Wednesday.
That improvement, however, lacked follow through and left spot trading within a vacillating mood towards the end of the NA session.
In addition, dwindling risk aversion also collaborated with further selling in the Japanese yen.
Around the BoJ, Governor K. Ueda argued that monetary easing is not intended to subsidize public spending, adding that the government’s debt-financing costs will not impede required monetary policy movements. He also suggested that cost-push inflation is reaching a climax.
There were no data releases scheduled in the Japanese docket on Wednesday.
In case USD/JPY loses the grip, it could extend the downtrend to, initially, the weekly low at 133.01 (April 26), an area reinforced by the 100-day SMA at 132.89 and followed by the minor level at 132.01 (April 13). The loss of the latter exposes a move to the April low at 130.62 (April 5) prior to the March low at 129.63 (March 24) and the February low at 128.08 (February 2). Down from here aligns the 2023 low at 127.21 (January 16). In opposition, the immediate up-barrier emerges at the April high at 135.13 (April 19) seconded by the key 200-day SMA at 136.99 and the 2023 top at 137.91 (March 8). North from here appears weekly tops at 139.89 (November 30 2022) and 142.25 (November 21 2022). The daily RSI picked up pace and approached 53.
Resistance levels: 134.73 135.13 136.99 (4H chart)
Support levels: 133.01 132.85 132.01 (4H chart)
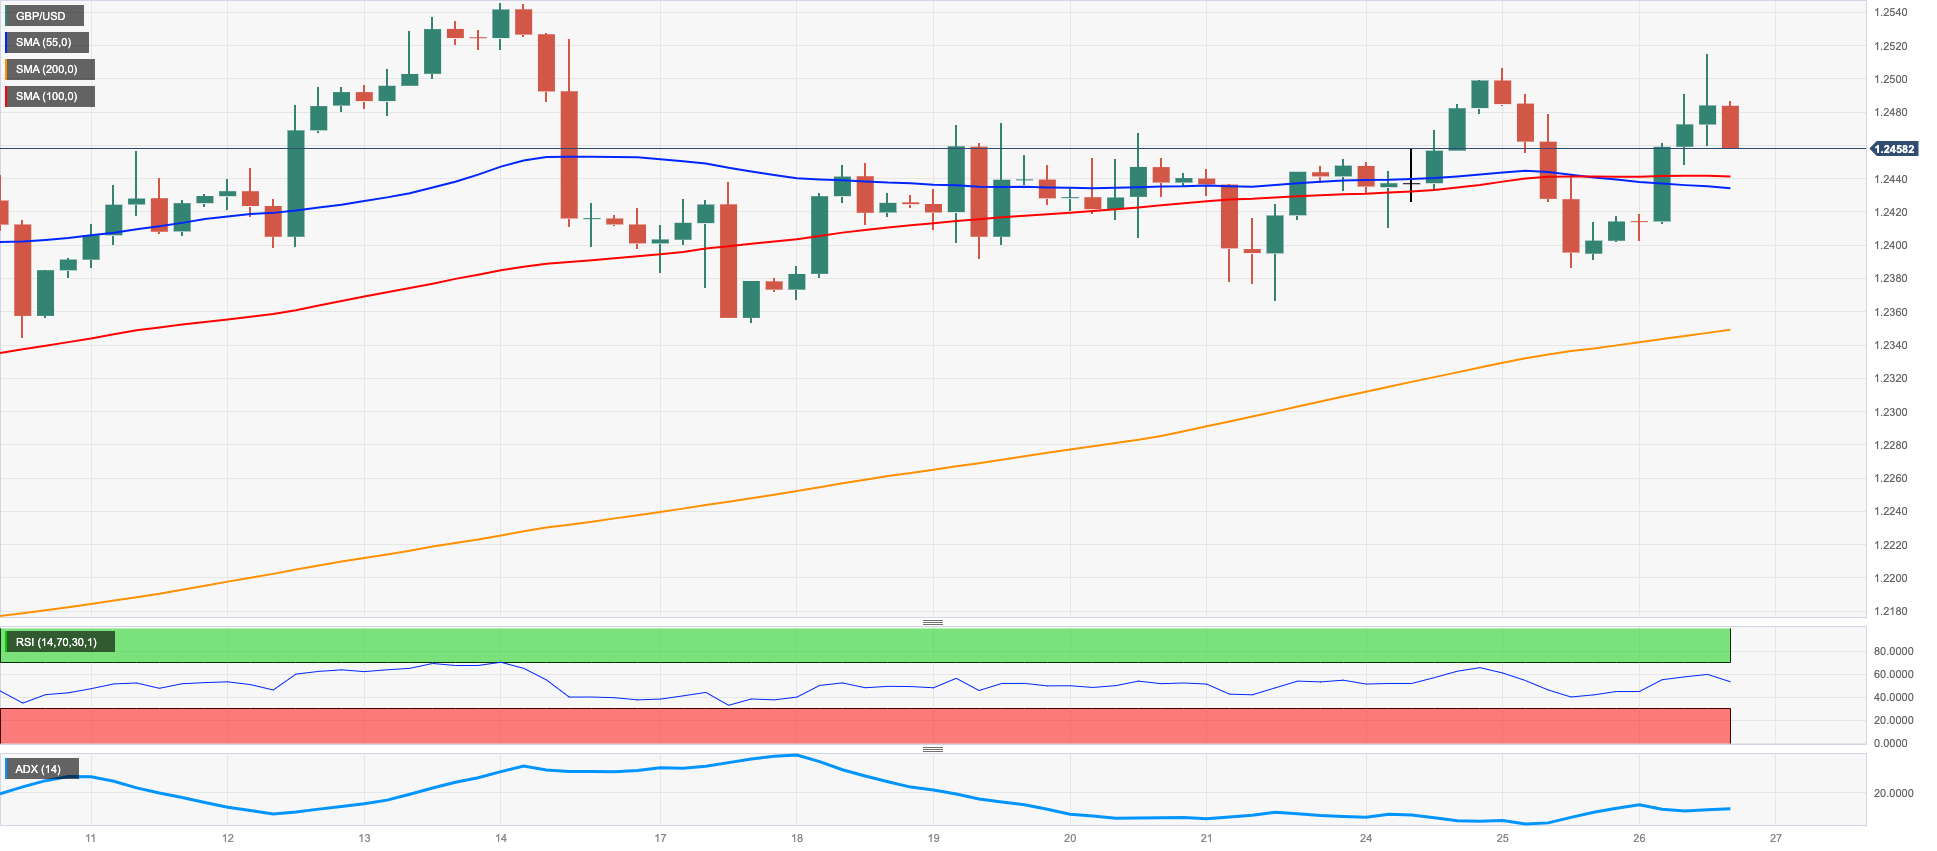
GBPUSD
Following the generalized upbeat sentiment in the risk complex, GBP/USD reversed Tuesday’s strong retracement and managed to briefly advance past the key 1.2500 the figure and hit multi-day highs on Wednesday. Part of this advance, however, fizzled out afterwards.
Indeed, mitigating risk aversion coupled with the loss of momentum around a (most likely) 25 bps rate hike by the Fed next week weighed on the greenback and sparked an intense rebound in Sterling and the rest of its risky peers midweek.
In the UK calendar, minor releases saw CBI Distributive Trades rise to 5 in April (from 1) and final Labour Productivity expanded 0.4% QoQ in Q4.
GBP/USD keeps the consolidative mood well in place and the break of this theme could shift the attention to the 2023 top at 1.2546 (April 14) ahead of the May 2022 peak at 1.2666 (May 27) and the 200-week SMA at 1.2864, all seconded by the psychological 1.3000 yardstick. Instead, the weekly low at 1.2344 (April 10) should hold the initial test before the April low at 1.2274 (April 3) and the provisional 55-day SMA at 1.2216. The breach of the latter could put the key 200-day SMA at 1.1931 to the test prior to the 2023 low at 1.1802 (March 8). The daily RSI rebounded past the 56 mark.
Resistance levels: 1.2515 1.2546 1.2599 (4H chart)
Support levels: 1.2386 1.2367 1.2339 (4H chart)
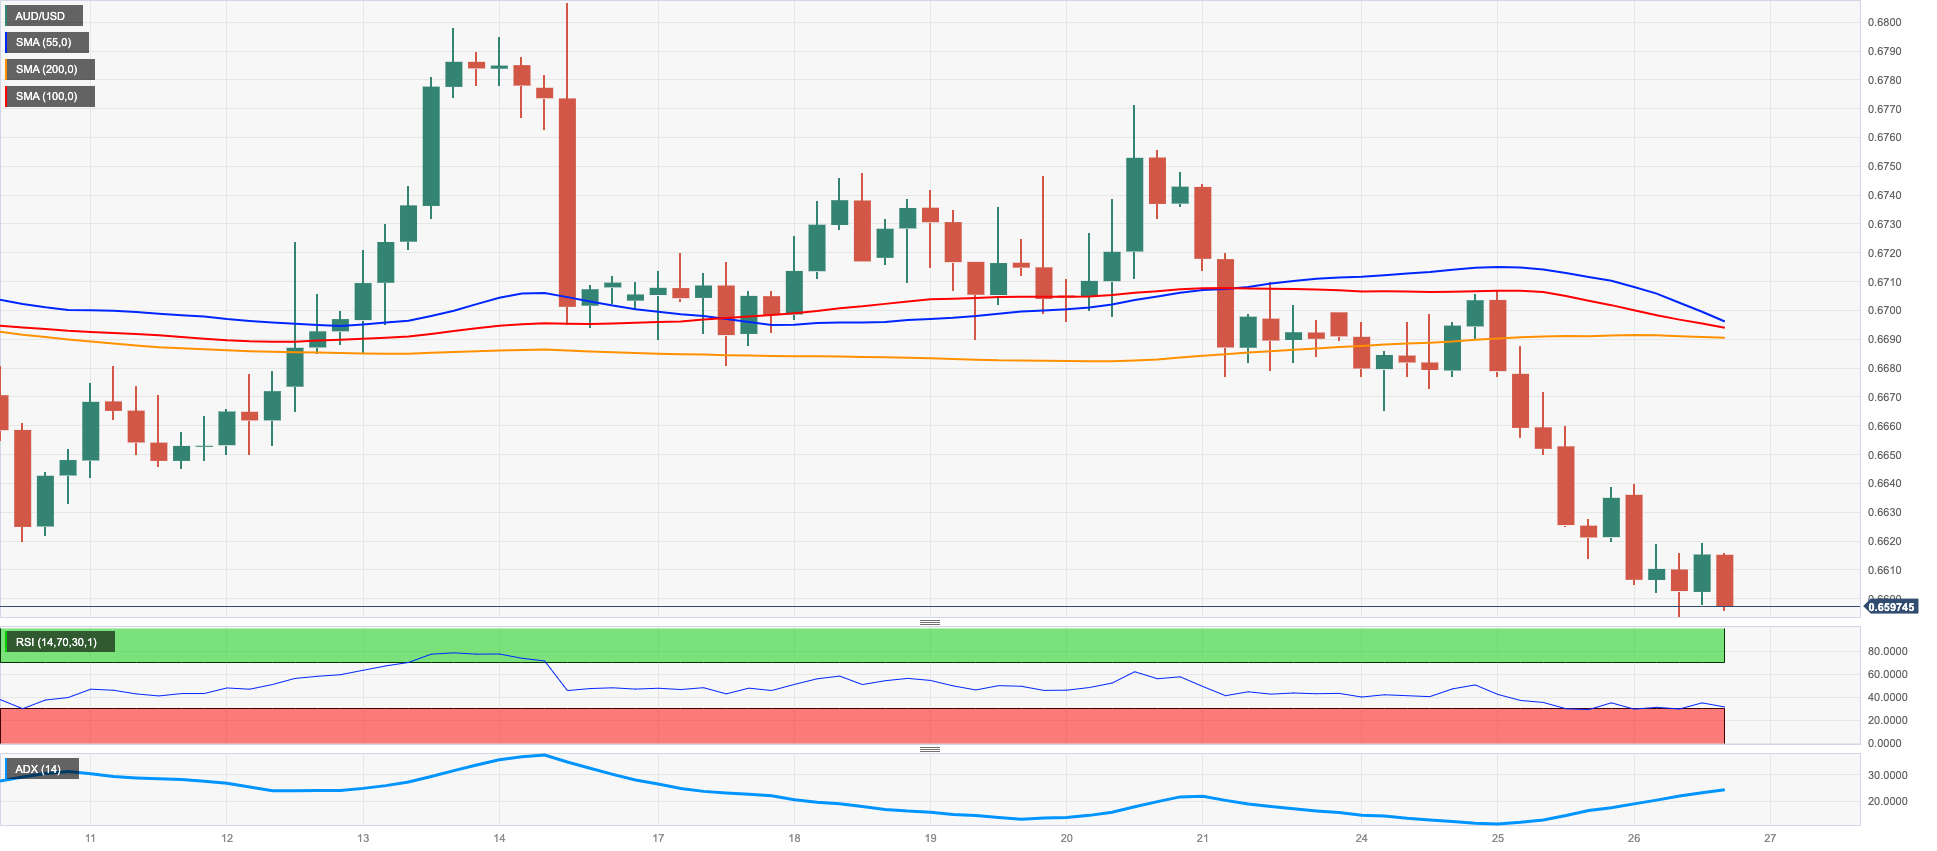
AUDUSD
Despite the bearish tone in the greenback and the sharp pullback in the USD Index (DXY), AUD/USD plummeted to new 6-week lows in the area just below the 0.6600 support on Wednesday.
In addition, the modest recovery in the commodity complex – where copper prices and the iron ore managed to reverse many consecutive sessions with losses – did nothing to help the Aussie dollar, which instead came under renewed and heavy pressure following lower-than-expected inflation figures, which in turn opened the door to a potential end of the RBA’s tightening cycle in place since May 2022.
On the latter, the Inflation Rate rose at an annualized 7.0% in Q1 and 1.4% vs. the previous quarter. In addition, the Monthly CPI Indicator rose 6.3% in March.
AUD/USD clocked a new April low at 0.6595 (April 26). If the pair breaks below this level it could trigger a rapid drop to the 2023 low at 0.6563 (March 10) ahead of the weekly low at 0.6386 (November 10 2022) and the November 2022 low at 0.6272 (November 3). On the flip side, a sustained breakout of the key 200-day SMA at 0.6738 could pave the way for a visit to the weekly peak at 0.6771 (April 20) prior to the April high at 0.6805 (April 14) and the key round level at 0.7000. Once this region is cleared, spot could then challenge the weekly top at 0.7029 (February 14) ahead of the 2023 top at 0.7157 (February 2). The daily RSI slipped back below the 40 region.
Resistance levels: 0.6687 0.6771 0.6805 (4H chart)
Support levels: 0.6593 0.6563 0.6386 (4H chart)
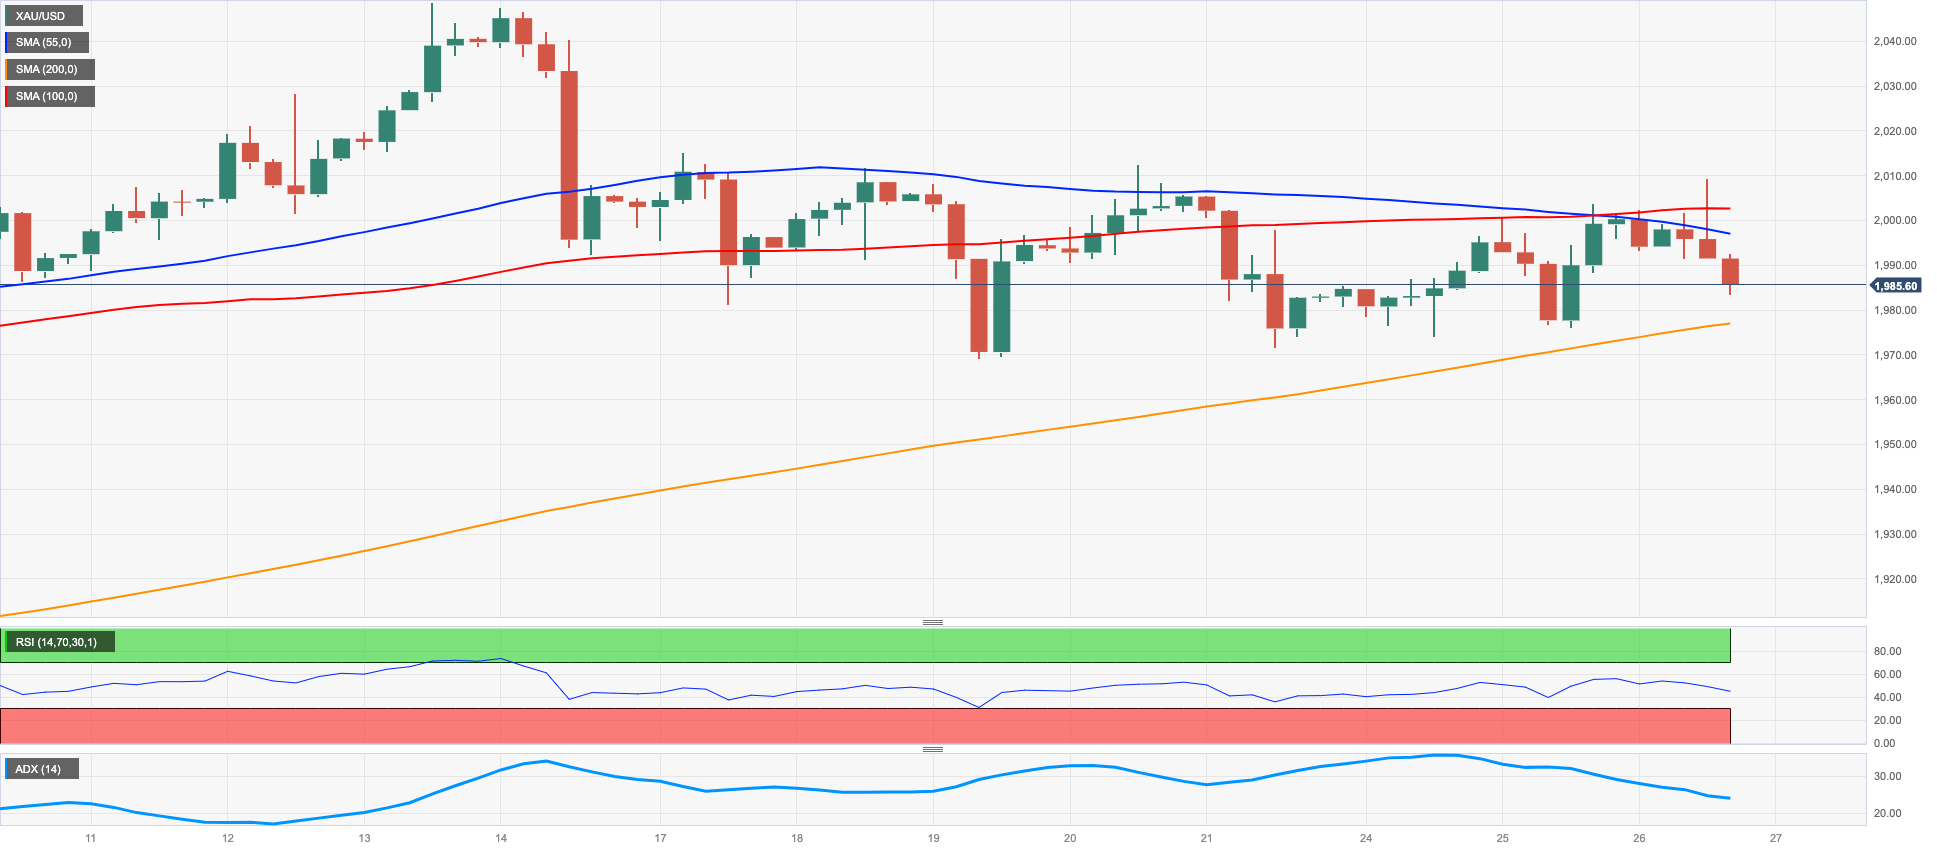
GOLD
The change of direction in US yields seems to have been enough to keep the price action around the yellow metal depressed on Wednesday.
Indeed, bullion remained unable to add to the weekly recovery in spite of the pronounced sell-off in the greenback, while the resumption of the appetite for the risk complex also played against extra gains in the precious metal midweek.
No news when it came to the monetary policy scenario, where both the Federal Reserve and the ECB are predicted to raise rates by 25 bps at their May meetings.
Once gold breaks above the ongoing range bound theme, it should shift the attention to the 2023 peak at $2048 (April 13) before the 2022 high at $2070 (March 8) and the all-time high at $2075 (August 7 2020). Just the opposite, the weekly low at $1969 (April 19) is expected to emerge as the initial contention ahead of the April low at $1949 (April 3) and the 55- and 100-day SMAs at $1921 and $1892, respectively. Down from here appears the March low at $1809 (March 8) followed by the 2023 low at $1804 (February 28).
Resistance levels: $2015 $2048 $2070 (4H chart)
Support levels: $1985 $1971 $1949 (4H chart)
CRUDE WTI
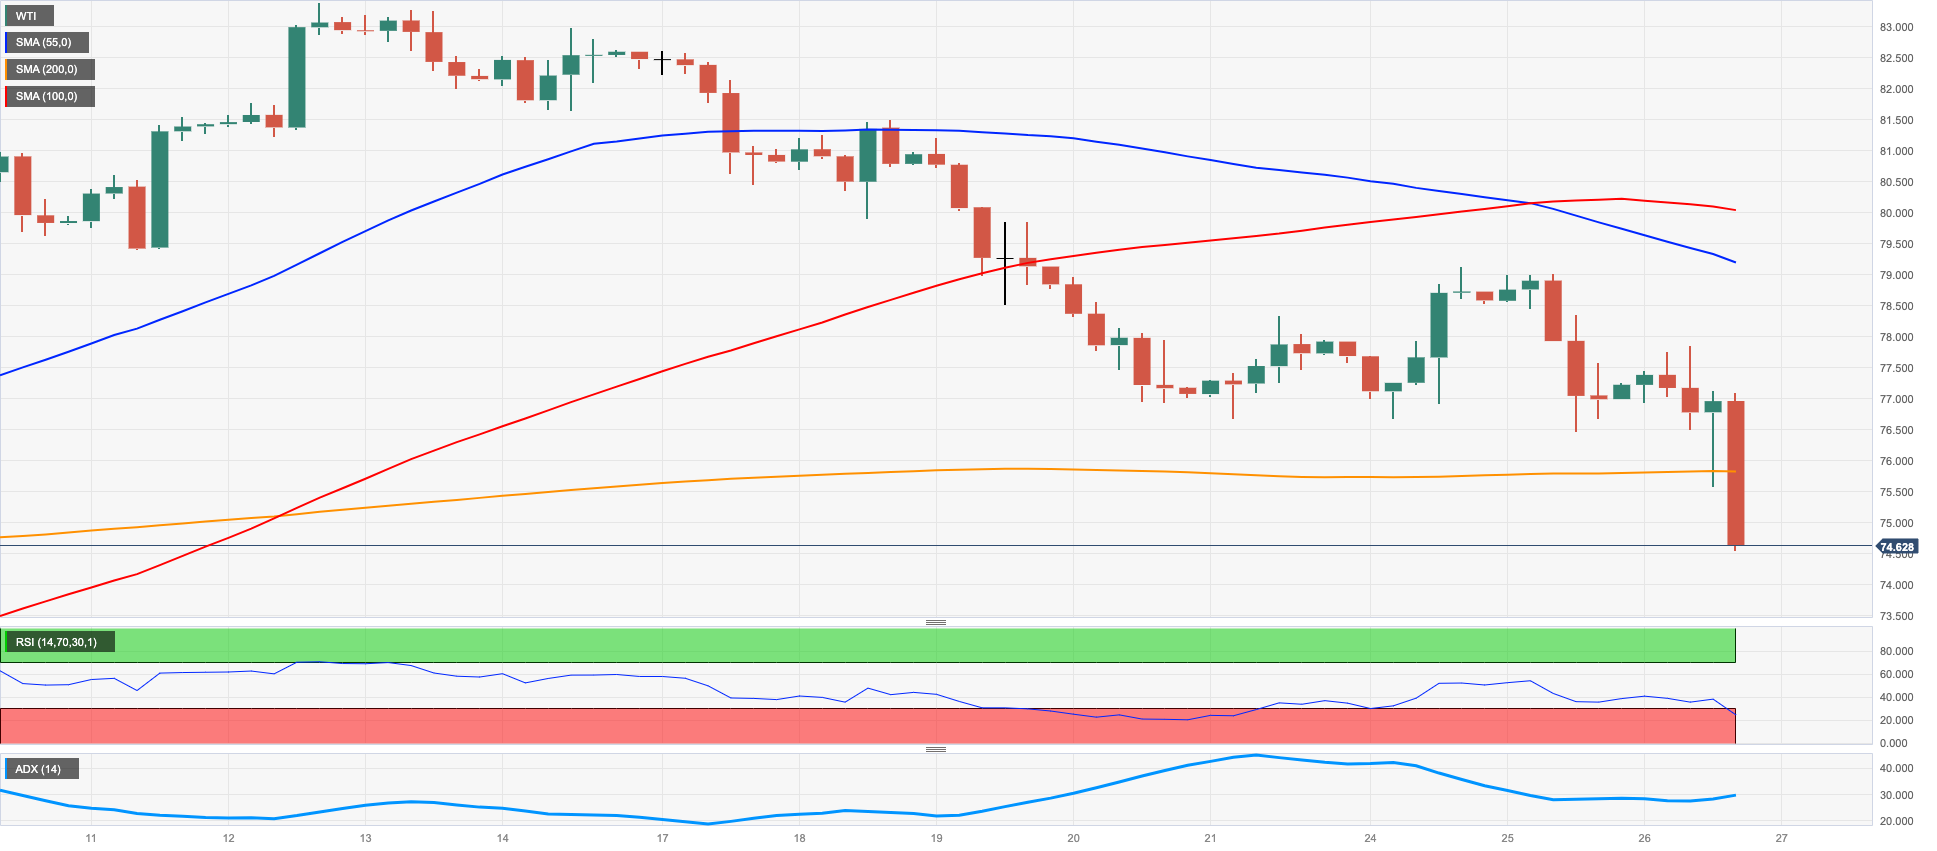
Prices of the barrel of the West Texas Intermediate (WTI) remained on the defensive for the second straight session and briefly breached the $76.00 mark to print new 4-week lows on Wednesday.
In fact, crude oil prices now filled the post-OPEC+ gap and traded in a negative fashion as recession concerns continued to weigh on traders’ sentiment amidst firmer conviction of another 25 bps rate hike by the Fed at the May 3 event.
Those jitters were enough to offset any bullish sign after the weekly report by the EIA showed US crude oil inventories dropped more than expected by 5.054M barrels in the week to April 21, while supplies at Cushing increased by 0.319M barrels, Weekly Distillate Stocks shrank by 0.576M barrels and gasoline stockpiles went down by 2.408M barrels.
The breakdown of the weekly low at $75.69 (April 26) could prompt the WTI to dispute the key $70.00 mark ahead of the $66.86 level (March 24). Once this area is cleared, a potential test of the 2023 low at $64.41 (March 20) could re-emerge on the horizon before the December 2021 low at $62.46 (December 2) and the key $60.00 mark per barrel. The other way around, a minor hurdle comes at the weekly high at $79.14 (April 24) ahead of the key 200-day SMA at $82.21 and the 2023 high at $83.49 (April 12). Beyond this level, there are no targets of note until the November 2022 top $93.73 (November 7).
Resistance levels: $77.89 $79.14 $81.48 (4H chart)
Support levels: $75.69 $72.57 $66.79 (4H chart)
GER40
The Spanish benchmark IBEX35 was the sole outperformer among its peers on Wednesday.
Indeed, most European markets closed with losses following the resumption of banking concerns on both sides of the Atlantic on Wednesday, while further hawkish messages from ECB’s rate setters continued to favour extra interest rate hikes in the next months.
In Germany, the Consumer Confidence gauged by GfK improved a tad to -25.7 for the month of May.
In the money market, the 10-year Bund yields reversed part of Tuesday’s strong drop and regained the 2.40% region.
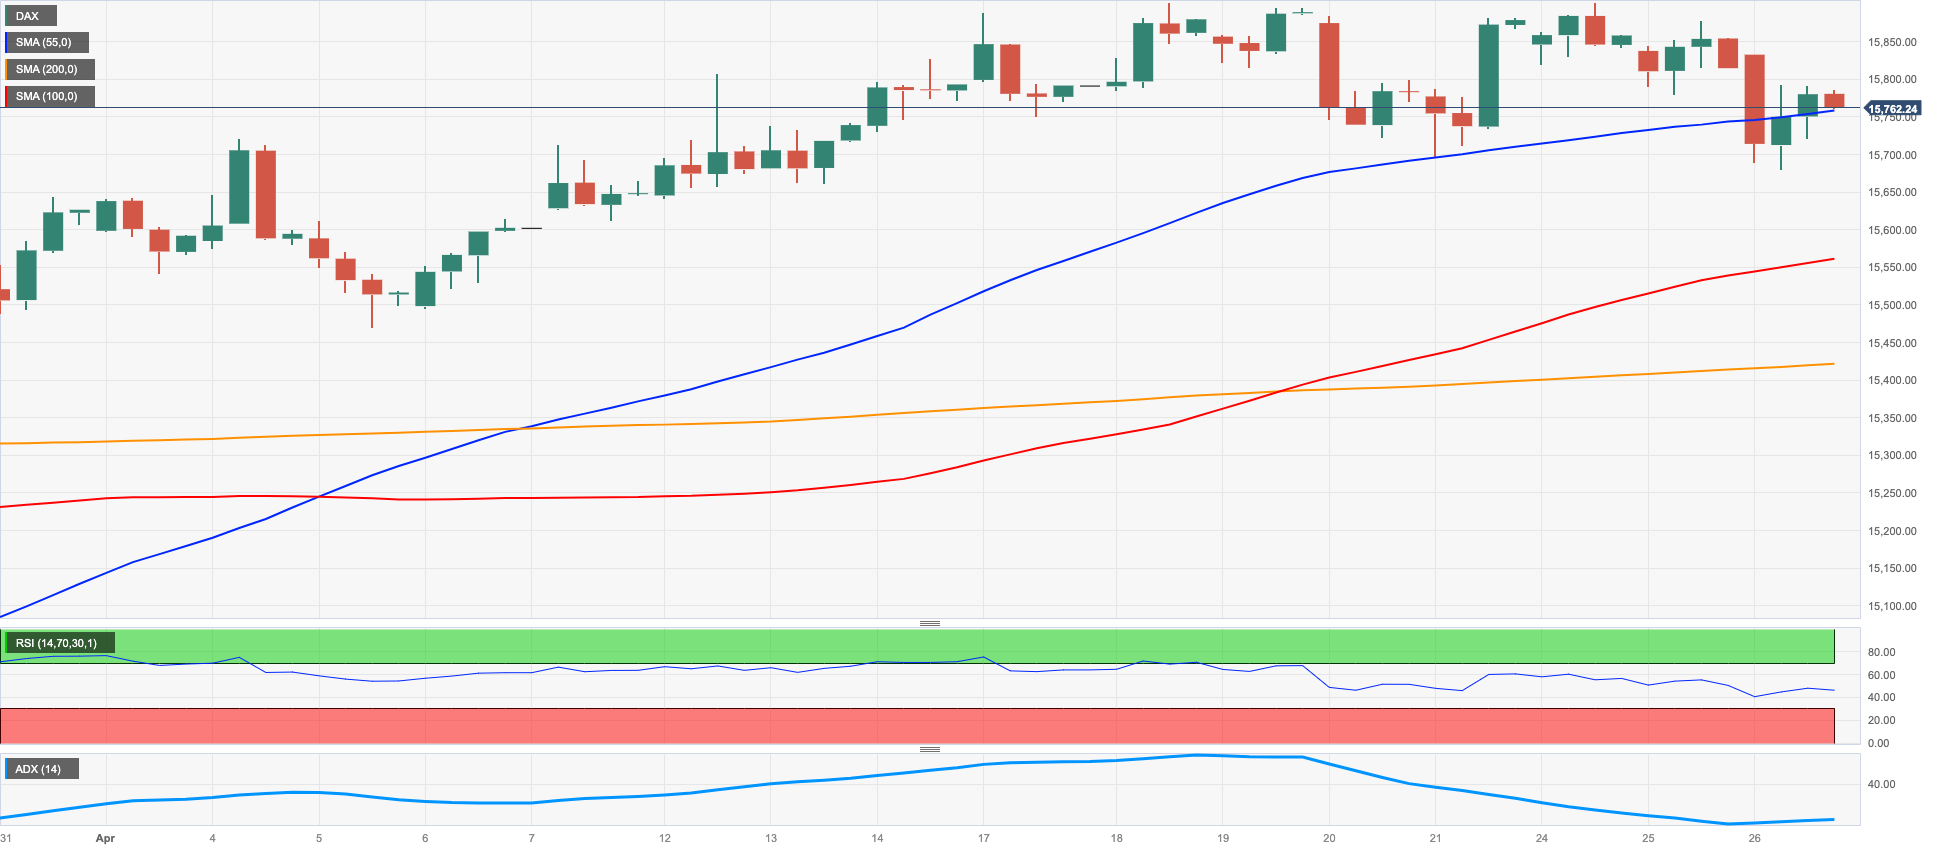
The DAX40 prolonged the consolidation phase for yet another day. Against that, the immediate hurdle on the upside emerges at the 2023 high at 15916 (April 18) before the round level at 16000 and the 2022 peak at 16285 (January 5). By contrast, the initial support lines up at the April low at 15482 (April 5) followed by the temporary 100-day SMA at 15073 and the minor support at 14809 (March 24). The breach of this level could spark a probable retracement to the March low at 14458 (March 20) prior to the key 200-day SMA at 14149. The daily RSI receded to the proximity of 58.
Best Performers: Vonovia, Covestro, Zalando SE
Worst Performers: Rheinmetall AG, Brenntag AG, Qiagen
Resistance levels: 15919 16090 16285 (4H chart)
Support levels: 15694 15482 15399 (4H chart)
NASDAQ
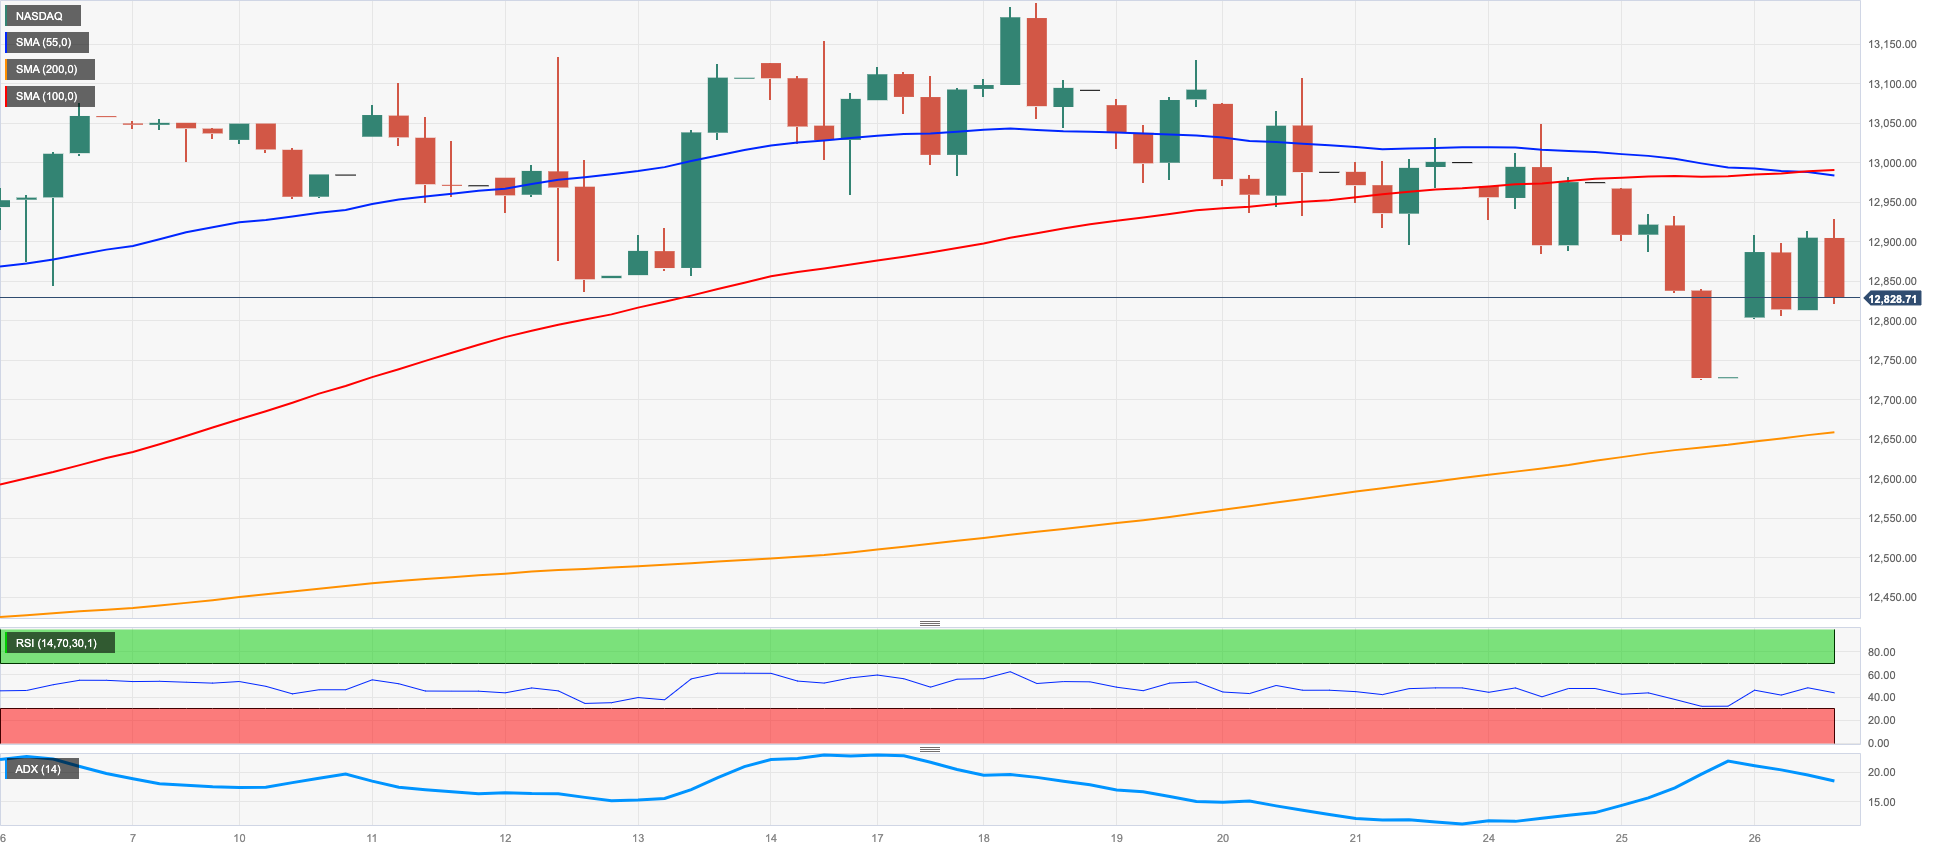
Auspicious results from megacaps Alphabet and Microsoft lent much-needed oxygen to the US tech sector and sponsored at the same time the rebound in the reference Nasdaq 100 to the vicinity of the 13000 mark following Tuesday's steep pullback.
In the meantime, the bearish note in the greenback favoured the recovery in the risk complex, although the U-turn in US yields across the curve somewhat limited potential gains on Wednesday.
In case the Nasdaq 100 embarks on a serious recovery, the next barrier of note remains at the 2023 top at 13204 (April 4) prior to the August 2022 peak at 13720 (August 16) and the round level at 14000. Further north come the March 2022 high at 15265 (March 29). To the contrary, a drop below the April low at 12724 (April 25) could put the provisional 55-day SMA at 12579 back on the radar before the weekly low at 12517 (March 28) and the key 200-day SMA at 12039. Below the latter emerges the March low at 11695 (March 13) seconded by weekly lows at 11550 (January 25) and 11251 (January 19). Down from here the index could see the 2023 low at 10696 (January 6) revisited. The daily RSI bounced to the 50 region.
Top Gainers: Datadog, Lucid Group, Microsoft
Top Losers: Enphase, Activision Blizzard, Old Dominion Freight Line Inc
Resistance levels: 13204 13720 14277 (4H chart)
Support levels: 12818 12517 12097 (4H chart)
DOW JONES
US equities measured by the three major stock indices traded in a mixed fashion on Wednesday after the Dow Jones retreated 0.23% to 33453, the S&P500 rose 0.09% to 4075 and the tech-heavy Nasdaq Composite advanced 1.00% to 11916.
Banking concerns – mainly stemming from First Republic Bank – seem to have weighed on investors’ mood along with persevering concerns surrounding the likelihood that the US economy could slip into recession in the next months.
Underpinning these fears, the Federal Reserve is largely anticipated to hike rates by 25 bps next week.
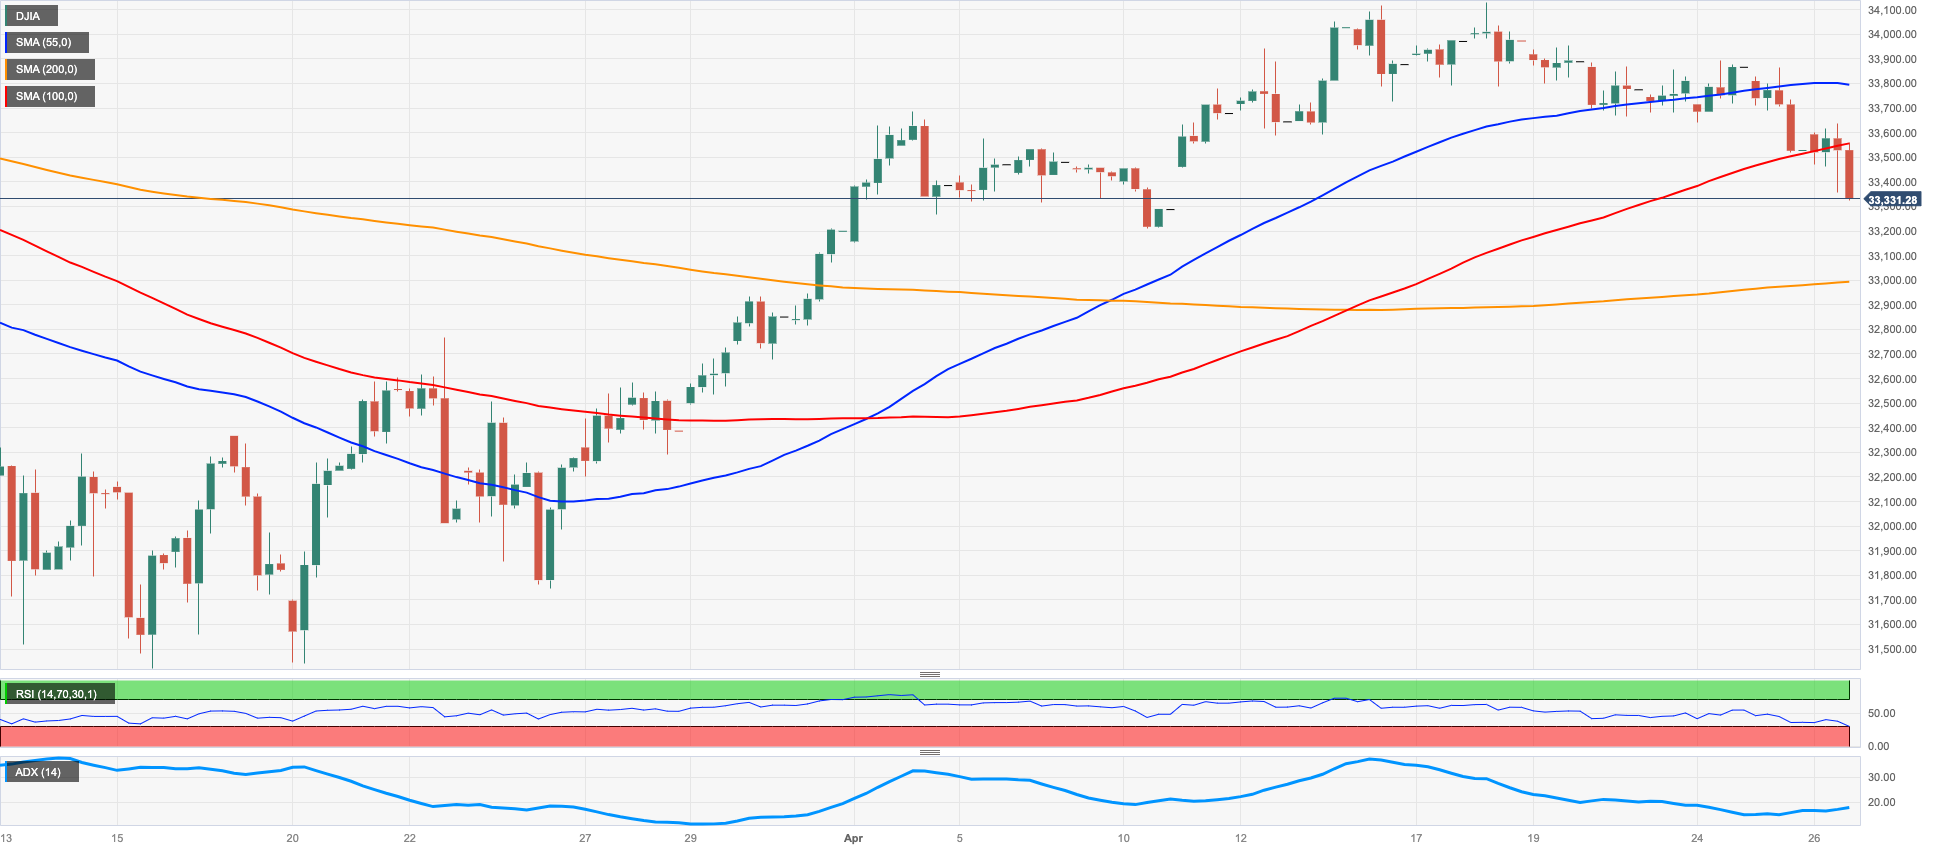
The continuation of the downward bias could force the Dow Jones to revisit the provisional 55-day SMA at 33156 ahead of the more significant 200-day SMA at 32630. The breach of the latter could pave the way for a probable test of the 2023 low at 31429 (March 15) prior to the 30000 level and ahead of the 2022 low at 28660 (October 13). On the opposite side, there are no changes to the topside, as the April top at 34082 still emerges as the immediate barrier before the 2023 peak at 34342 (January 13), which is closely followed by the December 2022 high at 34712 (December 13). Up from here comes the April 2022 top at 35492 (April 21) ahead of the February 2022 peak at 35824 (February 9). The daily RSI deflated and flirted with the 50 mark.
Top Performers: Microsoft, Boeing, Intel
Worst Performers: Merck&Co, Honeywell, UnitedHealth
Resistance levels: 34082 34334 34712 (4H chart)
Support levels: 33360 33200 31805 (4H chart)
MACROECONOMIC EVENTS

All Information & Updates provided by:

All information relating to the financial markets available on this page has been prepared and issued by FXStreet (Forexstreet SL, Spain, Reg: B62498233) on the basis of publicly available information and all information believed to be reliable and does not conflict with Kuwaiti local laws, and all necessary care has been taken to before the company to ensure that the facts mentioned are correct from the source.
NCM Investment nor any of its directors or employees shall in any way be held responsible for the contents of this news, and the information contained on this page is intended only to provide clients with publicly available information and should not be construed as investment advice, report or analysis and/or constitute an offer or invitation to buy or sell financial instruments of any kind.
RISK WARNING: Forex and CFDs are highly risky leveraged products, as losses can exceed deposits. Please ensure you understand all the risks and take independent advice if necessary. NCM will segregate the clients based on the criteria of the regulator and its bylaws. NCM does not provide any advisory service; the material published does not constitute advice or a recommendation for a transaction in any financial instrument. NCM accepts no responsibility for any use of the content presented and any consequences of that use. Anyone acting on the information provided does so at their own risk.