
- Contact Us:
-

-

-

-


Daily Market Updates
28 Apr 2023
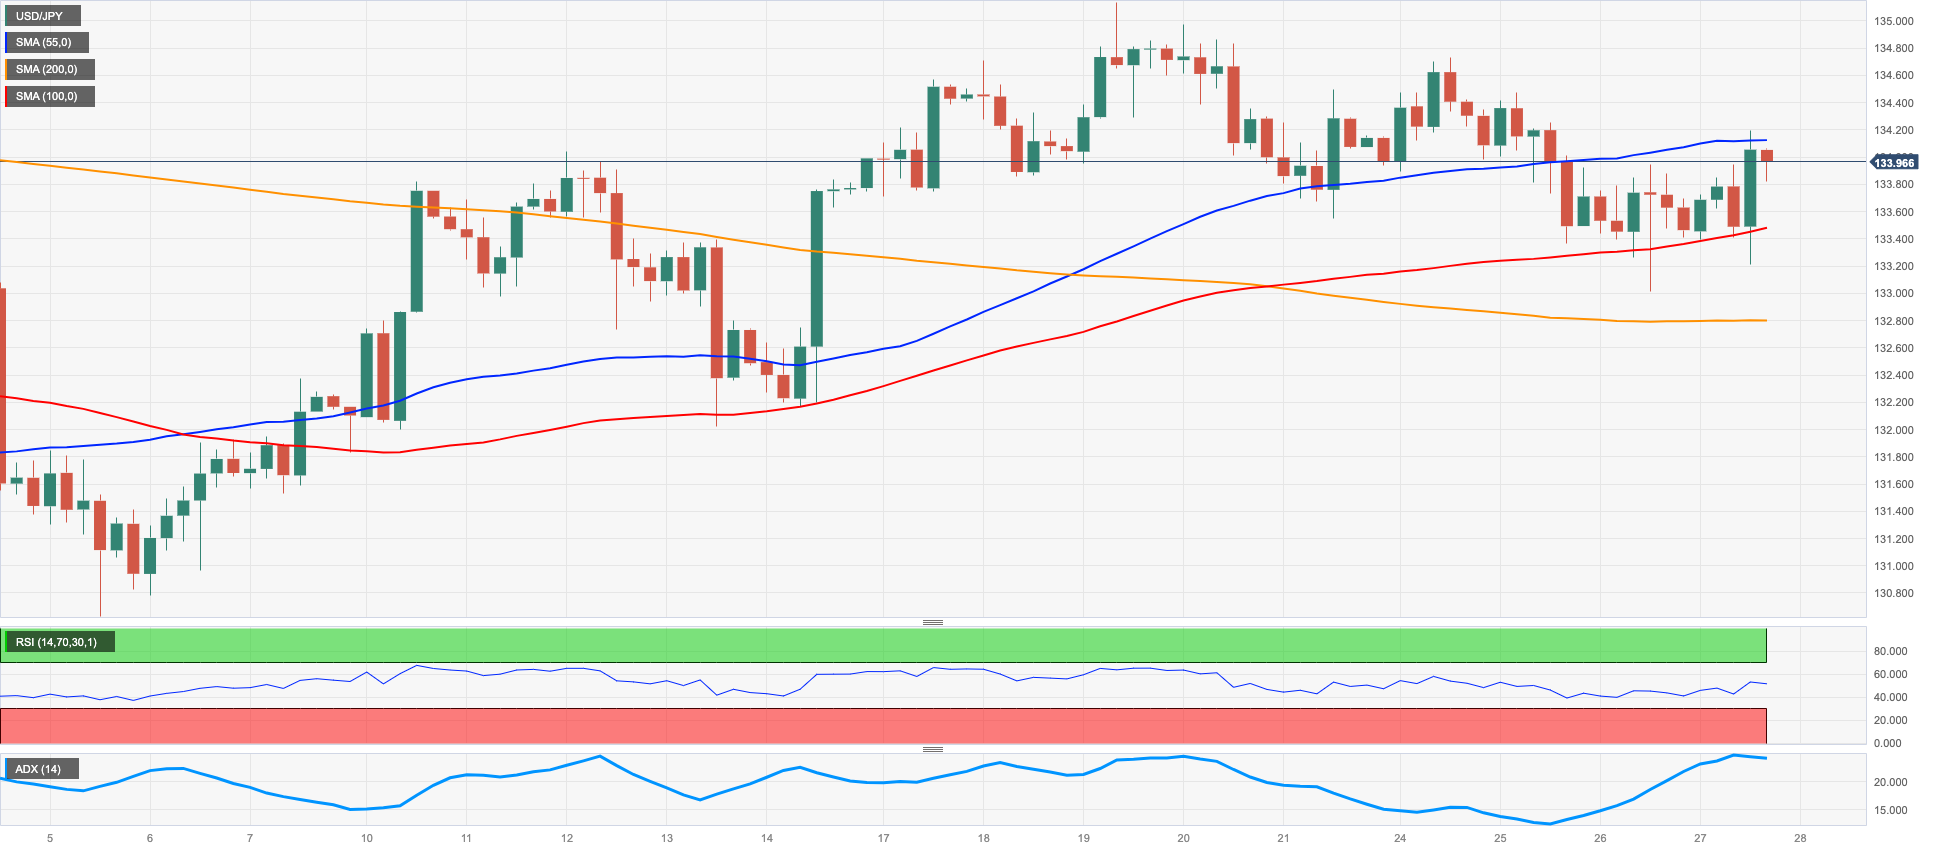
USDJPY
USD/JPY reversed two consecutive sessions with losses and reclaimed the area beyond the 134.00 hurdle on Thursday.
The pair’s recovery came hand in hand with the bounce in the greenback – particularly following advanced Q1 GDP figures – and the persistent march north in US yields across the curve.
No news from the Japanese money market, where the JGB 10-year yields remained side-lined around the 0.45% region.
In the calendar, Foreign Bond Investment shrank to ¥1059.5B in the week to April 22, while final prints saw the Coincident Index and the Leading Economic Index at 98.6 and 98.0, respectively, during February.
The resumption of the bullish bias could motivate USD/JPY to revisit the April top at 135.13 (April 19) prior to the key 200-day SMA at 136.97 and the 2023 peak at 137.91 (March 8). The surpass of the latter could put a probable test of weekly peaks at 139.89 (November 30 2022) and 142.25 (November 21 2022) back on the investors’ radar, respectively. Instead, there is initial contention at the weekly low at 133.01 (April 26) just before the temporary 100-day SMA at 132.86. The breach of this level exposes a deeper retracement to the minor level at 132.01 (April 13) ahead of the April low at 130.62 (April 5) and the March low at 129.63 (March 24). Further down comes the February low at 128.08 (February 2) seconded by the 2023 low at 127.21 (January 16). The daily RSI gathered some pace and approached 54.
Resistance levels: 134.73 135.13 136.99 (4H chart)
Support levels: 133.01 132.82 132.01 (4H chart)
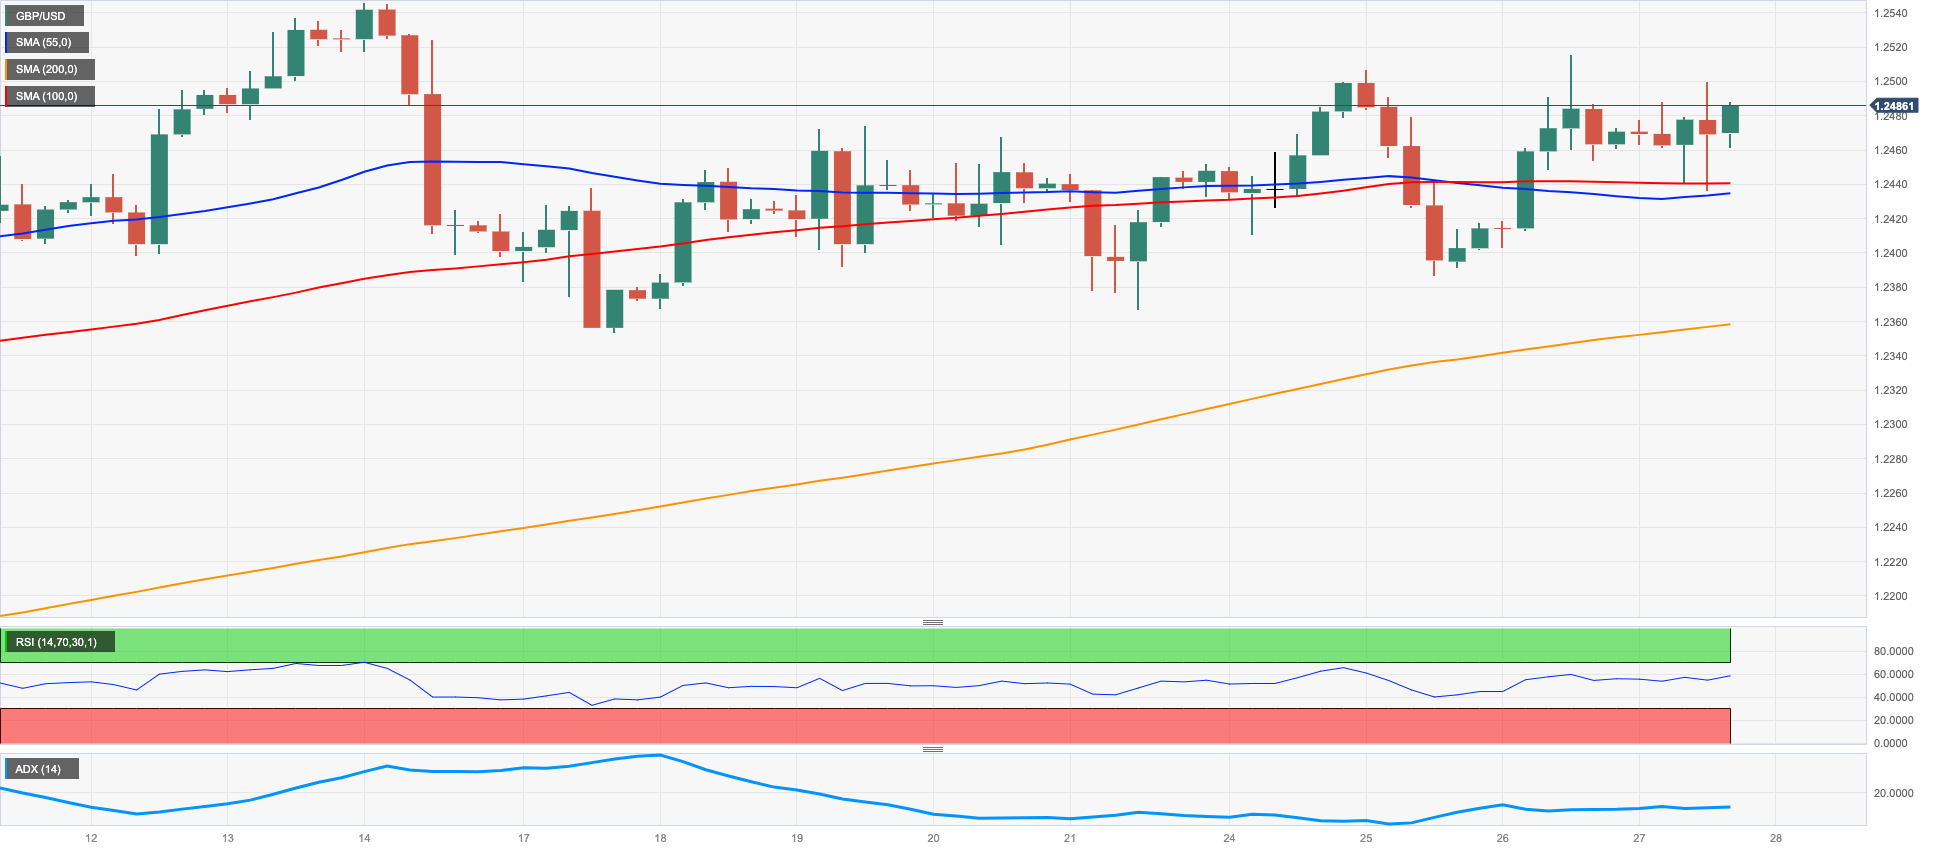
GBPUSD
GBP/USD traded with modest gains following an unsuccessful attempt to surpass the key 1.2500 barrier earlier in the European trading hours on Thursday.
In fact, Cable – and the rest of the risk complex – succumbed to the data-driven bounce in the greenback after the USD Index (DXY) left behind the initial selling bias in response to disappointing GDP results and higher-than-expected inflation prints during the January-March period.
In the UK bond market, the 10-year Gilt yields added to Wednesday’s uptick and revisited the 3.80% zone.
The UK calendar was empty on Wednesday.
Extra gains in GBP/USD continue to target the 2023 peak at 1.2546 (April 14) prior to the May 2022 high at 1.2666 (May 27) and the 200-week SMA at 1.2864, all before the psychological 1.3000 level. On the other hand, initial contention emerges at the weekly low at 1.2344 (April 10) seconded by the April low at 1.2274 (April 3) and the interim 55-day SMA at 1.2223. If Cable breaks below this level it could then challenge the key 200-day SMA at 1.1934 ahead of the 2023 low at 1.1802 (March 8). The daily RSI advanced marginally past the 58 yardstick.
Resistance levels: 1.2515 1.2546 1.2599 (4H chart)
Support levels: 1.2386 1.2367 1.2351 (4H chart)
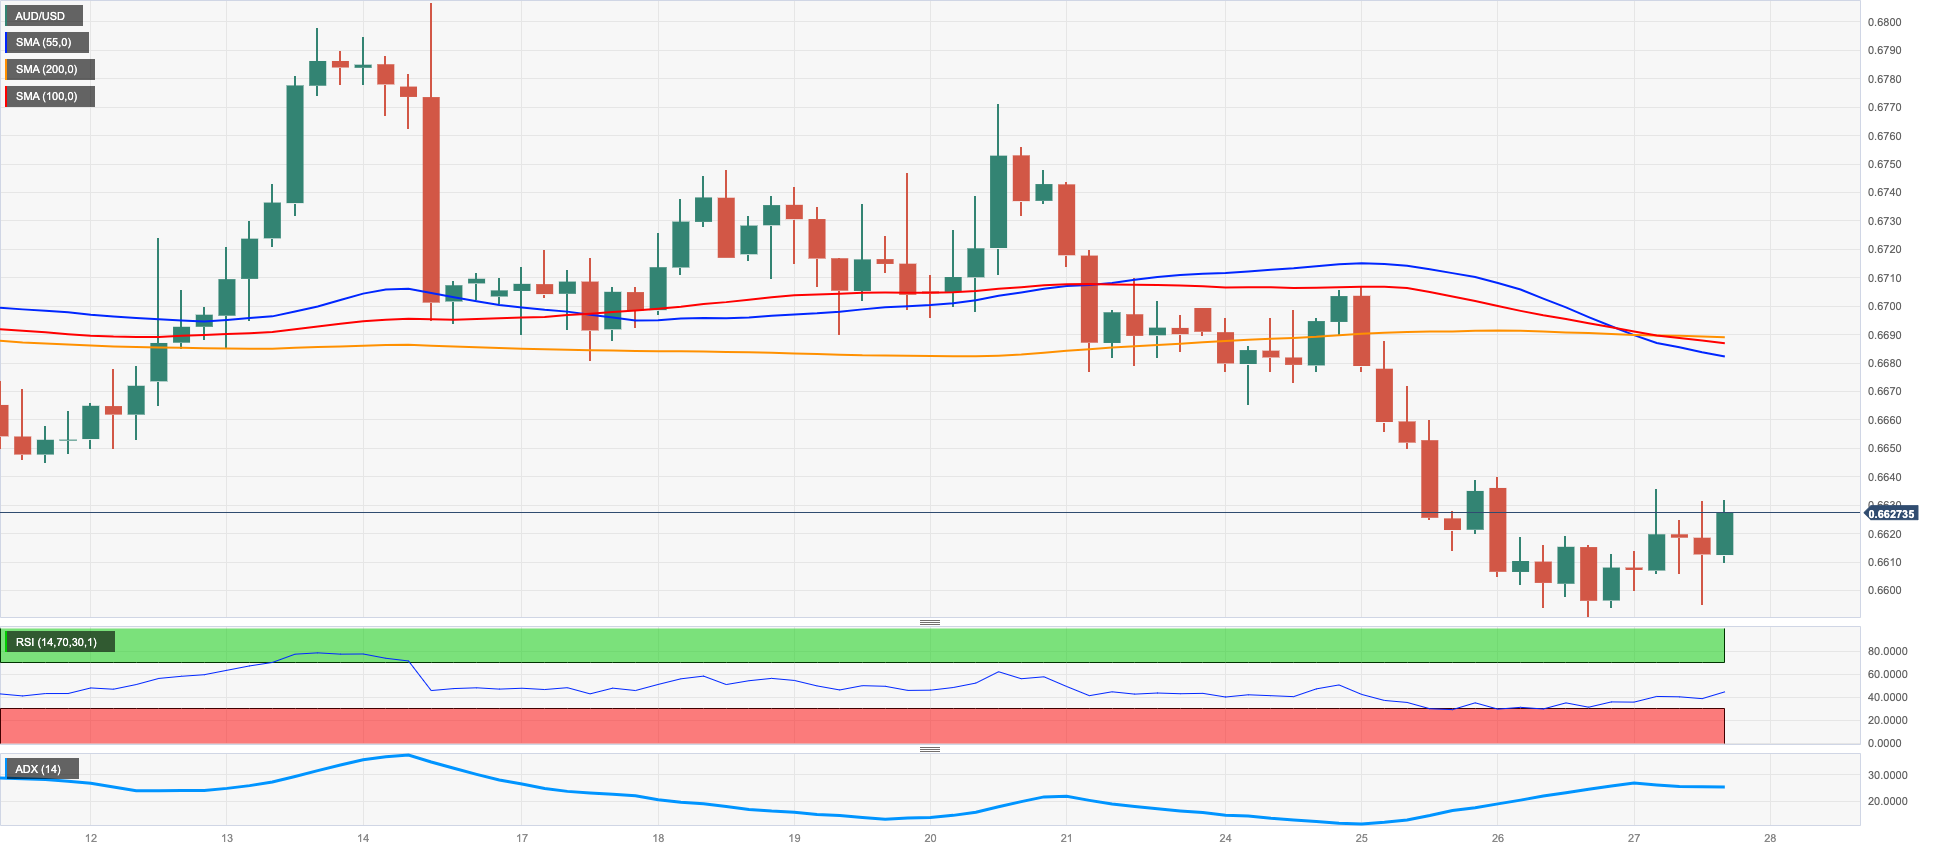
AUDUSD
Following two consecutive sessions with marked losses and a drop to multi-week lows, AUD/USD finally managed to regain some upside traction on Thursday.
The daily improvement in spot came in spite of the rebound in the greenback and the generalized mixed performance in the commodity complex – with the exception of the advance in copper prices – and seems to have been supported by bargain hunters.
Moving forward, the aussie dollar is predicted to remain under scrutiny ahead of the key RBA meeting on May 2, where the central bank is seen keeping the OCR unchanged at 3.60%. This view was reinforced earlier in the week by further signs of disinflation Down Under.
In Oz, Export Prices rose 1.6% QoQ in Q1 and Import Prices dropped 4.2% QoQ.
AUD/USD risks a deeper drop in case the April low at 0.6591 (April 26) is cleared. In fact, the pair could revisit the 2023 low at 0.6563 (March 10) prior to the weekly low at 0.6386 (November 10 2022) and seconded by the November 2022 low at 0.6272 (November 3). In opposition, the next up-barrier is seen at the key 200-day SMA at 0.6736 ahead of the weekly high at 0.6771 (April 20) and the April top at 0.6805 (April 14). North from here aligns the key round level at 0.7000 followed by the weekly peak at 0.7029 (February 14) and the 2023 high at 0.7157 (February 2). The daily RSI improved to the proximity of the 43 barrier.
Resistance levels: 0.6635 0.6687 0.6771 (4H chart)
Support levels: 0.6591 0.6563 0.6386 (4H chart)
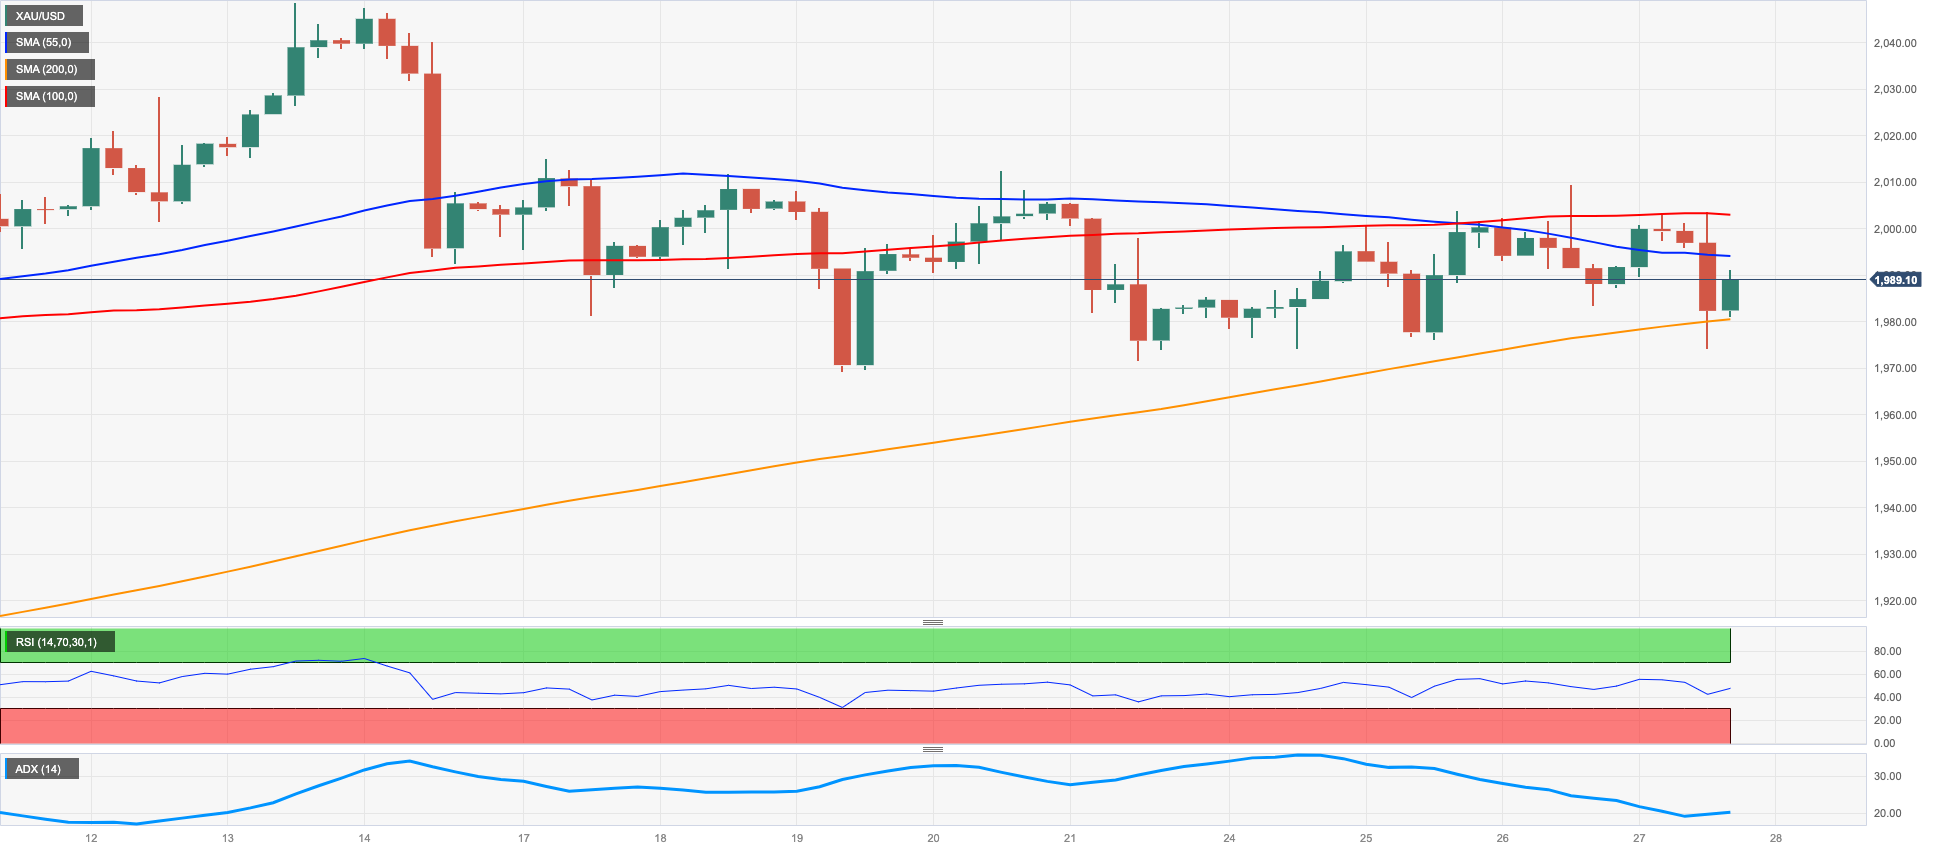
GOLD
The daily bounce in the dollar in combination with firm upside momentum in US yields across the curve encouraged gold bears to remain in control for the second session in a row on Thursday.
Indeed, prices of the ounce troy of the precious metal dropped to 3-day lows near $1975 before rebounding in a context dominated by the renewed buying interest in the greenback, particularly exacerbated following the still elevated inflation figures shown by the flash Q1 GDP readings.
In the meantime, bullion is seen under the. Microscope in the next sessions ahead of the key FOMC event on May 3, where investors largely anticipate another 25 bps rate hike.
Further consolidation appears to be the name of the game for gold for the time being. Occasional bullish attempts are expected to face the next hurdle at the 2023 high at $2048 (April 13) ahead of the 2022 top at $2070 (March 8), which precedes the all-time top at $2075 (August 7 2020). On the flip side, next support emerges at the weekly low at $1969 (April 19) prior to the April low at $1949 (April 3) and followed by interim contention levels at the 55- and 100-day SMAs at $1923 and $1894, respectively. Further losses from here could put the March low at $1809 (March 8) to the test ahead of a potential visit to the 2023 low at $1804 (February 28).
Resistance levels: $2015 $2048 $2070 (4H chart)
Support levels: $1974 $1949 $1934 (4H chart)
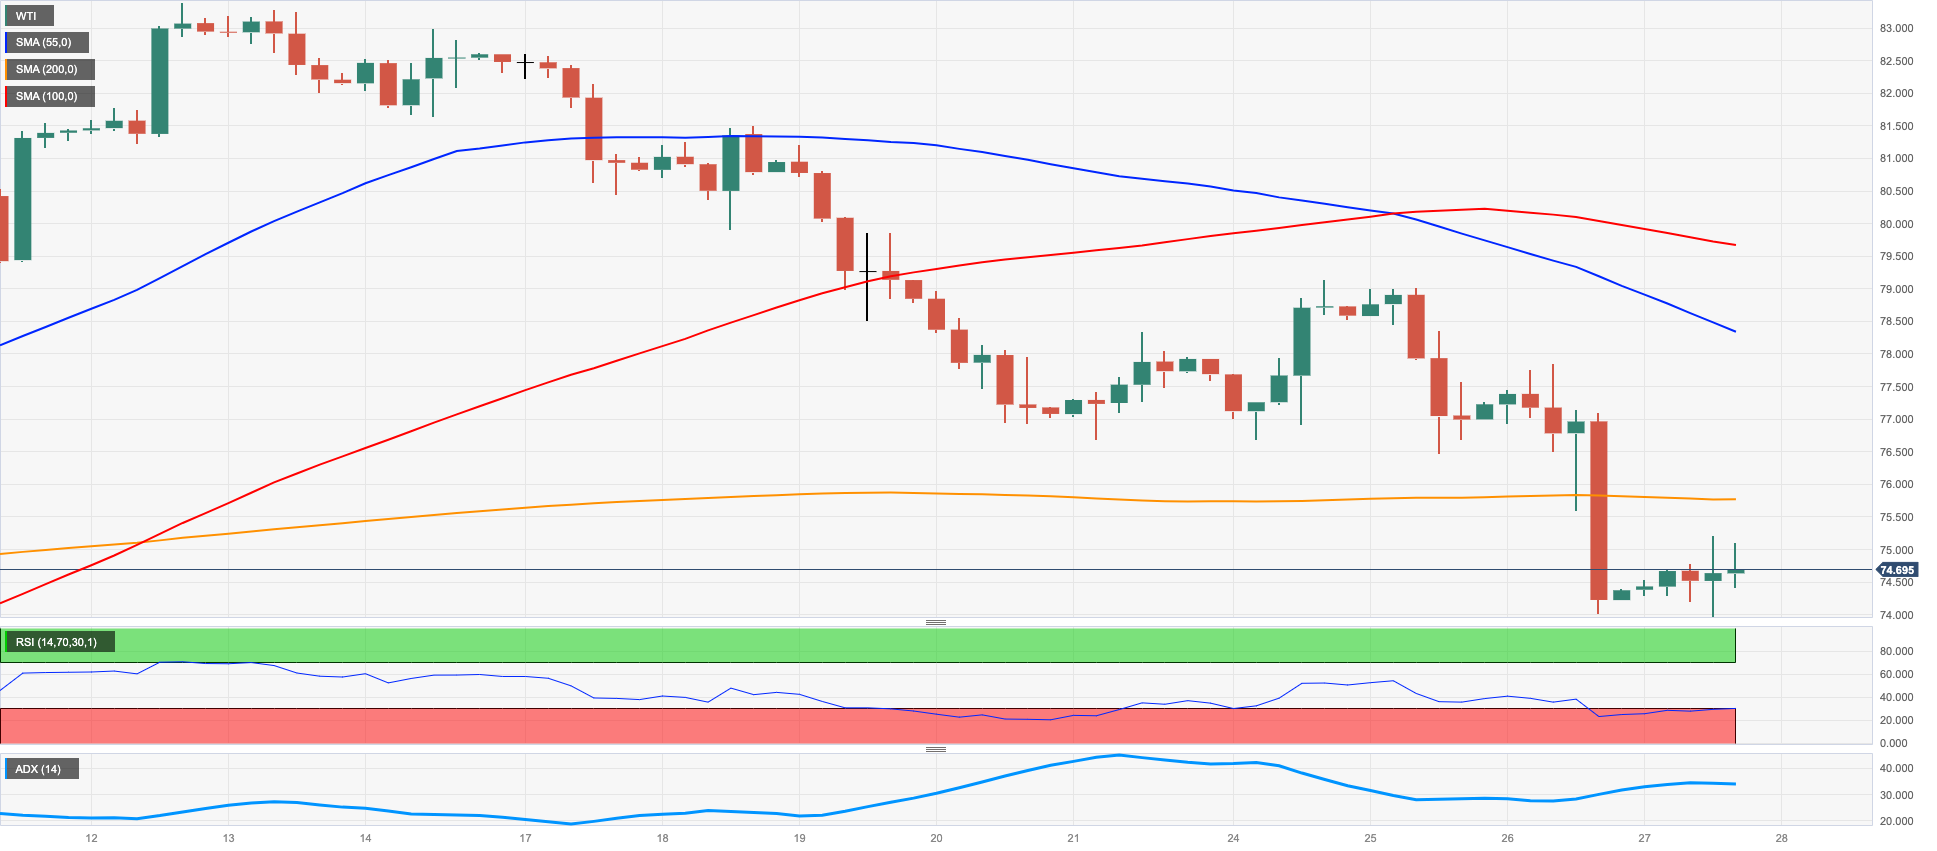
CRUDE WTI
Prices of the American reference for the sweet light crude oil advanced modestly past the $75.00 mark per barrel on Thursday.
Following two consecutive sessions with strong losses, the commodity looks en route to close the second consecutive week in the negative territory, as the correction from post-OPEC+ peaks seems to have further legs to go.
In the meantime, traders remain concerned over a potential economic slowdown and its negative impact on the demand for the commodity, all against the backdrop of rising conviction of a Fed’s rate hike at the May 3 gathering.
Somewhat bolstering the small gains in the WTI, Russia’s Deputy PM A. Novak said earlier in the session that the OPEC+ sees no need for extra oil output reduction despite Chinese demand is predicted to be lower than previously estimated. In addition, Novak argued that the oil market appears balanced following the cartel’s planned cuts starting next month.
WTI faces extra decline once the weekly low at $74.08 (April 27) is cleared, exposing at the same time a deeper pullback to, initially, the key $70.00 mark prior to the $66.86 level (March 24) and the 2023 low at $64.41 (March 20), all ahead of the December 2021 low at $62.46 (December 2) and before the key $60.00 mark per barrel. On the contrary, the weekly top at $79.14 (April 24) should offer a minor resistance level prior to the key 200-day SMA at $82.21 and the 2023 high at $83.49 (April 12). North from here emerges the November 2022 peak of $93.73 (November 7).
Resistance levels: $75.73 $77.89 $79.14 (4H chart)
Support levels: $74.08 $72.57 $66.79 (4H chart)
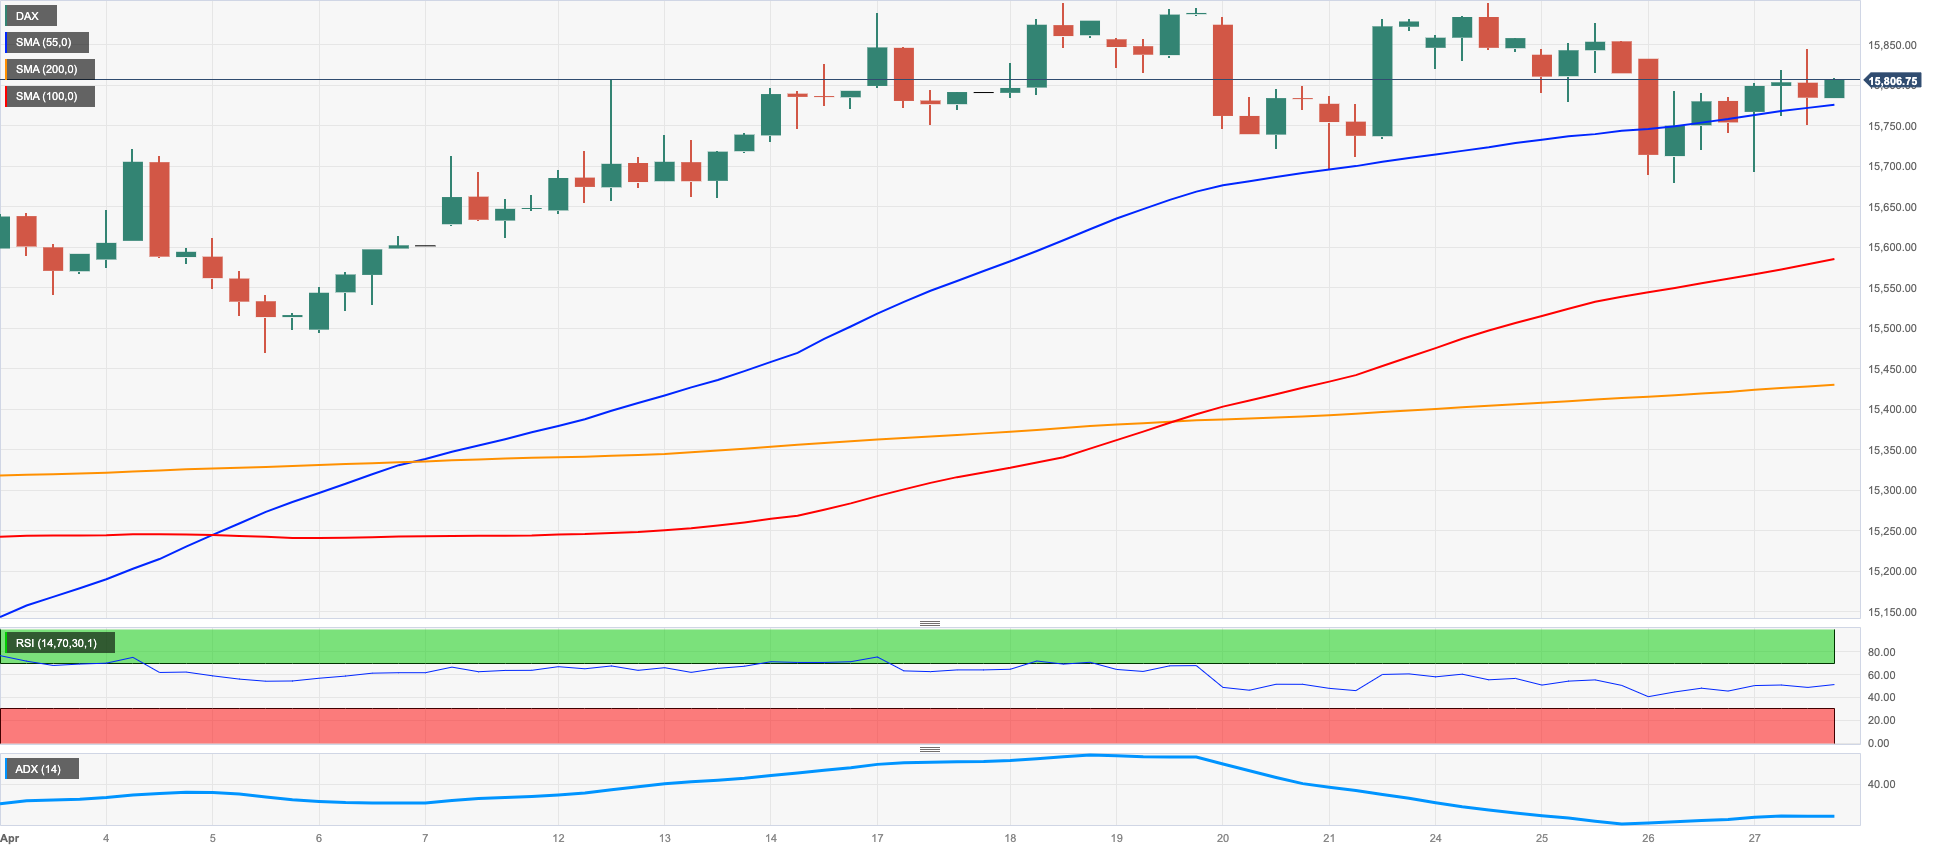
GER40
The German stock benchmark DAX40 edged higher and left behind Wednesday’s small pullback to revisit the area beyond the 15800 level on Thursday.
A positive session of the banking sector in the old continent in combination with positive earnings reports lifted spirits among investors and pushed European indices back to the positive territory with the exception of the UK reference FTSE100.
Looking at yields, the German 10-year Bund clinched the second advance in a row, this time surpassing the 2.45% level.
The DAX40 now trades at shouting distance from the 2023 top at 15916 (April 18). The breakout of this level could prompt the index to shift the attention to the round level at 16000 ahead of the 2022 high at 16285 (January 5). On the opposite side, bears face the immediate barrier at the April low at 15482 (April 5) seconded by the interim 100-day SMA at 15087 and the minor support at 14809 (March 24). Further weakness from here could motivate a potential test of the March low at 14458 (March 20) to start shaping up ahead of the key 200-day SMA at 14178. The daily RSI climbed modestly past the 58 mark.
Best Performers: Siemens Energy, Deutsche Bank AG, Deutsche Post
Worst Performers: Deutsche Boerse, Infineon, BASF
Resistance levels: 15919 16090 16285 (4H chart)
Support levels: 15694 15482 15411 (4H chart)
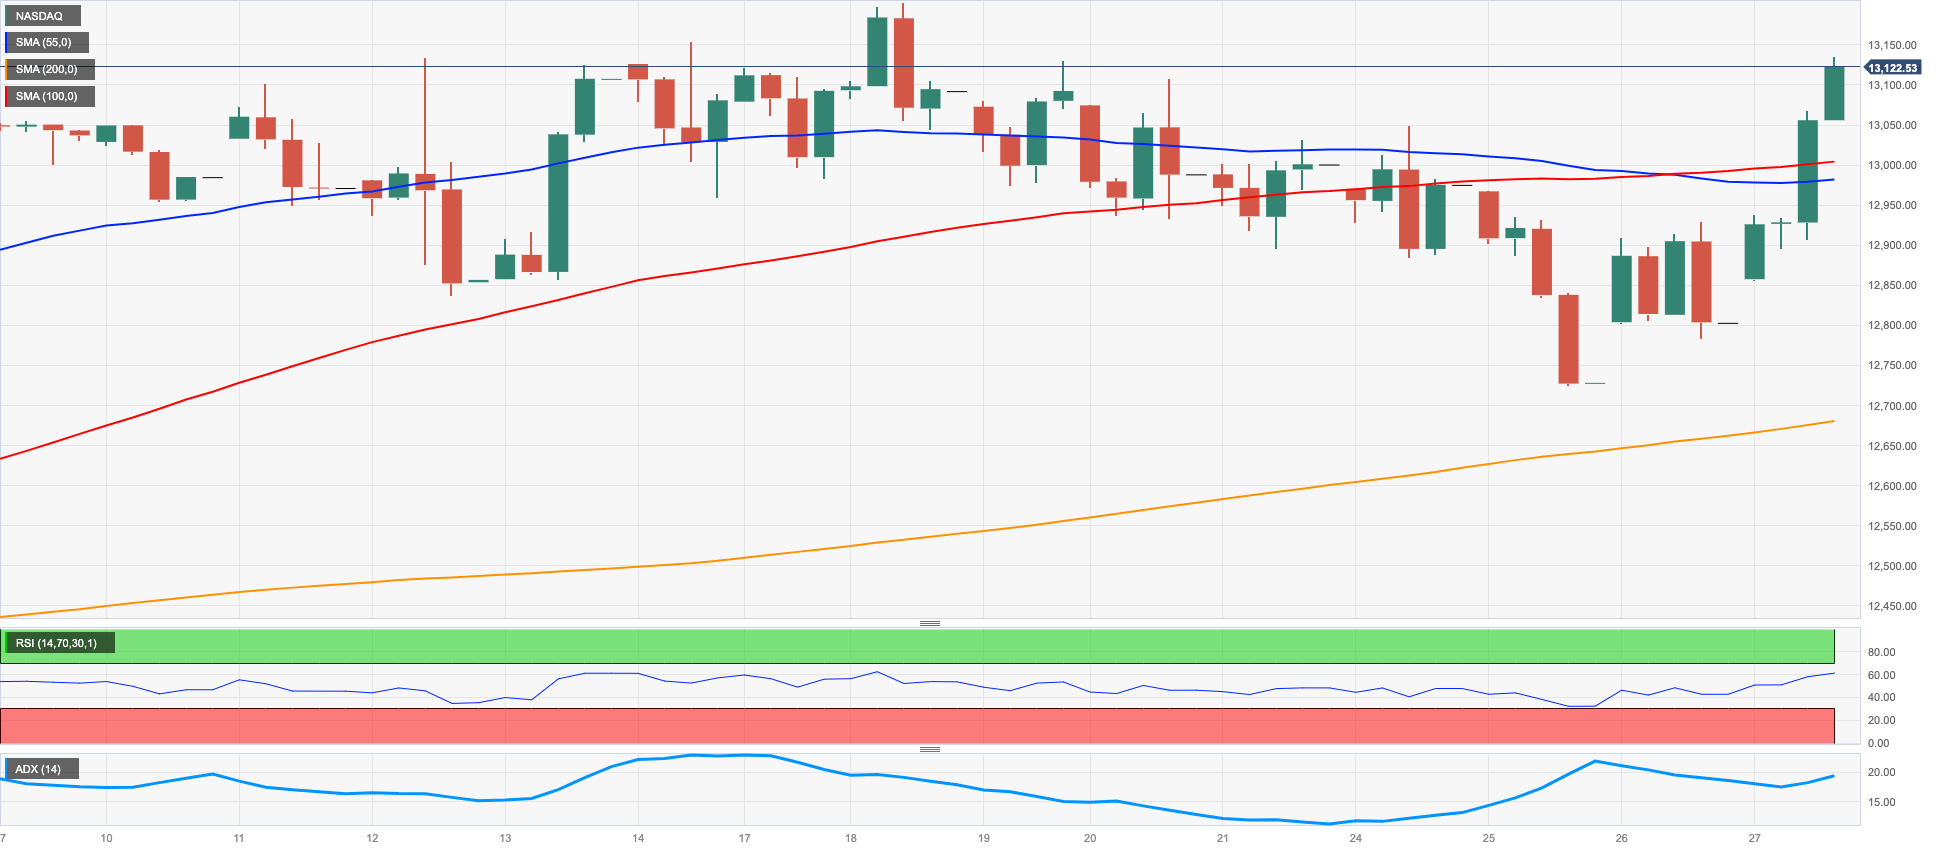
NASDAQ
A very positive session saw the tech reference Nasdaq 100 climb for the second day in a row to print multi-session peaks past the 13100 level on Thursday.
In fact, optimism among traders was magnified following a better-than-expected earnings report from megacap Meta Platforms, while hopes of an equally promising report from giant Amazon also collaborated with the upbeat mood.
If bulls push harder, then the Nasdaq 100 could revisit the 2023 peak at 13204 (April 4) sooner rather than later. The surpass of this level could put the index en route to a test of the August 2022 high at 13720 (August 16) seconded by the round level at 14000 and the March 2022 top at 15265 (March 29). By contrast, further decline appears likely below the April low at 12724 (April 25). That said, the next contention emerges at the interim 55-day SMA at 12586 prior to the weekly low at 12517 (March 28) and the key 200-day SMA at 12046. Down from here turns up the March low at 11695 (March 13) before weekly lows at 11550 (January 25) and 11251 (January 19), all ahead of the 2023 low at 10696 (January 6). The daily RSI jumped to the boundaries of the 59 level.
Top Gainers: Meta Platforms, Lucid Group, Comcast
Top Losers: Align, Keurig Dr Pepper, Illumina
Resistance levels: 13099 13204 13720 (4H chart)
Support levels: 12724 12517 12106 (4H chart)
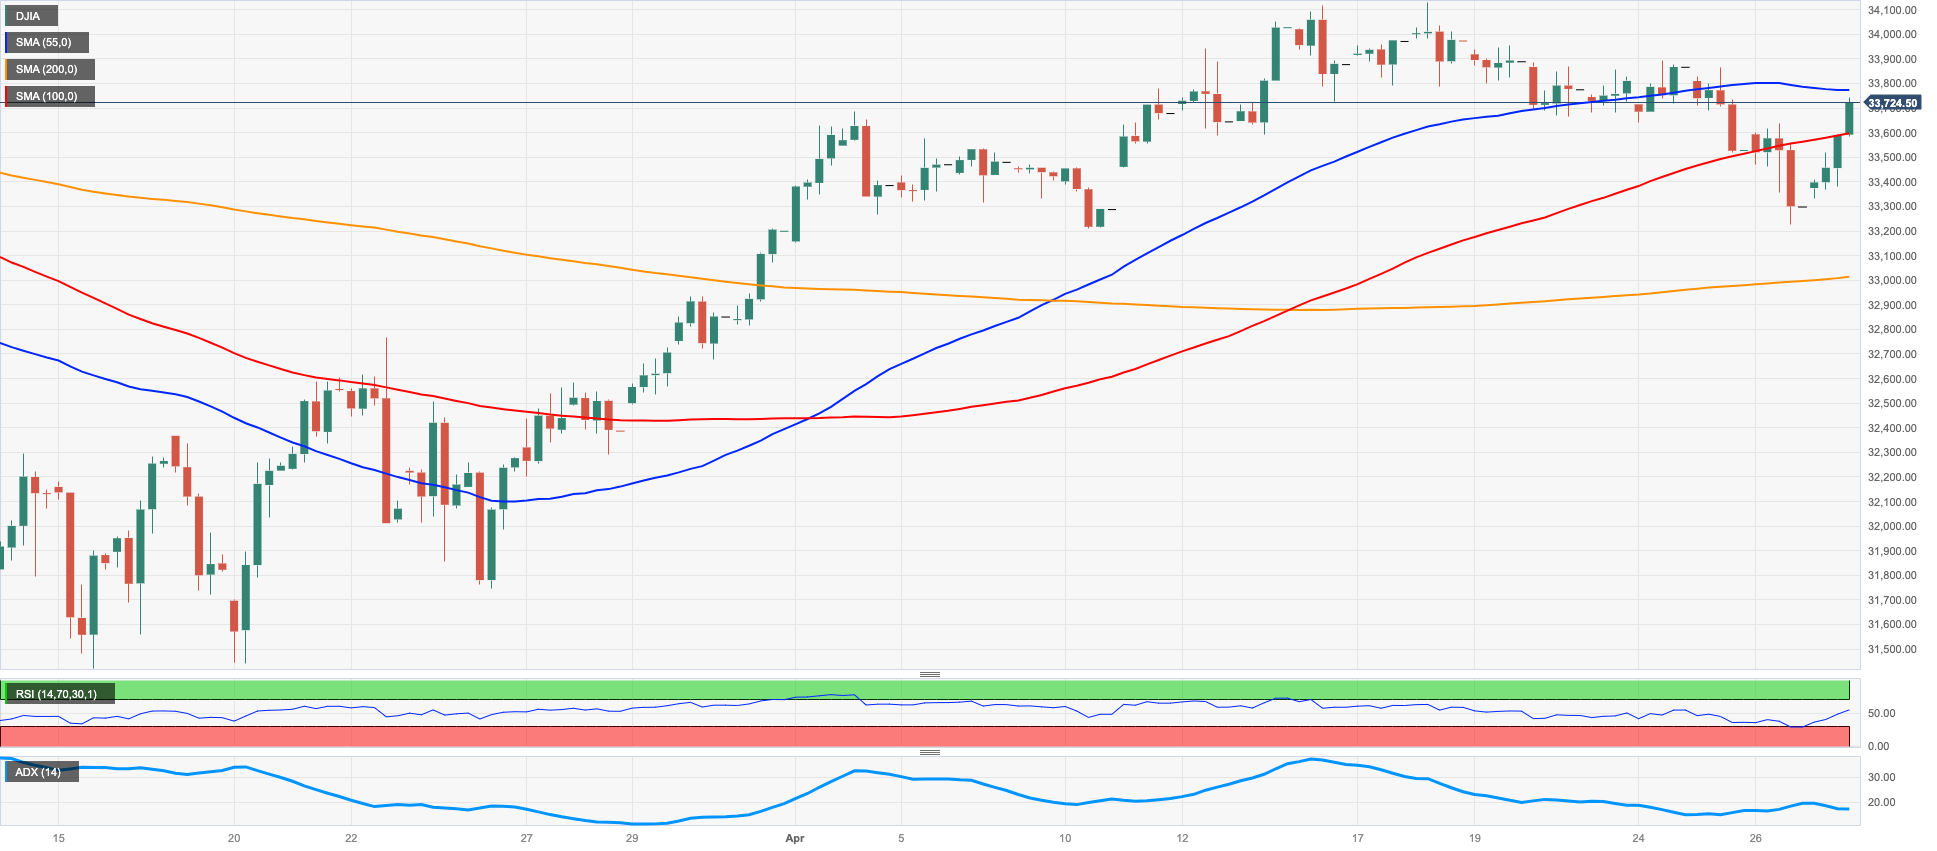
DOW JONES
US stocks tracked by the three major stock indices rebounded markedly on Thursday.
In fact, auspicious results from Meta Platforms boosted investors’ optimism and helped market participants set aside – albeit temporarily – recession concerns, particularly following lower-than-expected advanced prints from the GDP for the January-March period.
All in all, the Dow Jones rose 1.04% to 33648, the S&P500 advanced 1.44% to 4114 and the tech-benchmark Nasdaq Composite gained 2.08% to 12100.
If the recovery in the Dow Jones picks up pace, then the index could revisit the April peak at 34082 ahead of the 2023 high at 34342 (January 13) and the December 2022 high at 34712 (December 13). The surpass of this level could open the door to a potential move to the April 2022 peak at 35492 (April 21) before the February 2022 peak at 35824 (February 9). The other way around, the breakdown of the April low at 33235 (April 26) could rapidly expose a drop to the interim 55-day SMA at 33144 seconded by the key 200-day SMA at 32643. A deeper pullback could put the 2023 low at 31429 (March 15) to the test ahead of the 30000 yardstick and the 2022 low at 28660 (October 13). The daily RSI leapt past the 55 hurdle.
Top Performers: Verizon, Honeywell, Salesforce Inc
Worst Performers: Caterpillar, Cisco, Merck&Co
Resistance levels: 34082 34334 34712 (4H chart)
Support levels: 33235 33062 31805 (4H chart)
MACROECONOMIC EVENTS

All Information & Updates provided by:

All information relating to the financial markets available on this page has been prepared and issued by FXStreet (Forexstreet SL, Spain, Reg: B62498233) on the basis of publicly available information and all information believed to be reliable and does not conflict with Kuwaiti local laws, and all necessary care has been taken to before the company to ensure that the facts mentioned are correct from the source.
NCM Investment nor any of its directors or employees shall in any way be held responsible for the contents of this news, and the information contained on this page is intended only to provide clients with publicly available information and should not be construed as investment advice, report or analysis and/or constitute an offer or invitation to buy or sell financial instruments of any kind.
RISK WARNING: Forex and CFDs are highly risky leveraged products, as losses can exceed deposits. Please ensure you understand all the risks and take independent advice if necessary. NCM will segregate the clients based on the criteria of the regulator and its bylaws. NCM does not provide any advisory service; the material published does not constitute advice or a recommendation for a transaction in any financial instrument. NCM accepts no responsibility for any use of the content presented and any consequences of that use. Anyone acting on the information provided does so at their own risk.