
- Contact Us:
-

-

-

-


Daily Market Updates
01 May 2023
USDJPY
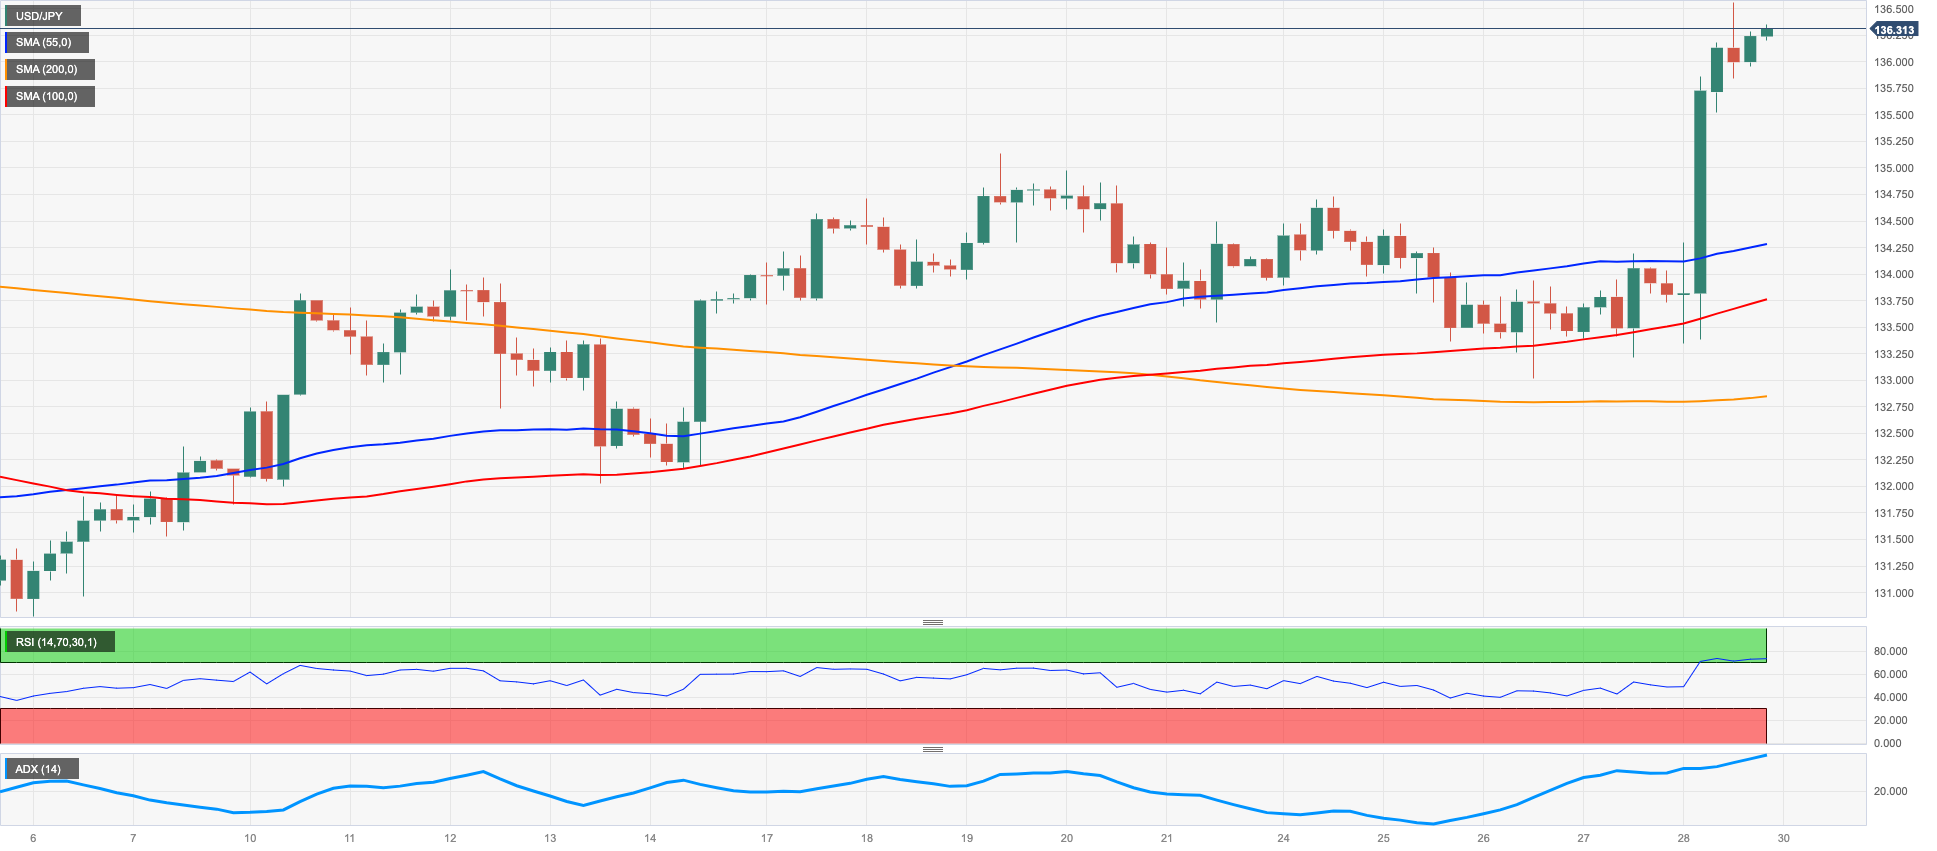
USD/JPY climbed nearly 2% to clinch fresh 7-week highs around 136.50 at the end of the week, extending the positive streak for the third week in a row at the same time.
Friday’s needle-like uptick in the pair came despite the move lower in US yields and was accompanied by the second consecutive session with gains in the greenback. In the Japanese bond market, the JGB 10-year yields dropped to the 0.37% region.
However, the main catalyst behind the pair’s jump was the unchanged message from the BoJ at its meeting early in the Asian trading hours. Indeed, the central bank left intact its policy rate at -0.10% although it removed from the statement its forward guidance for interest rates and announced a review of its monetary policy decisions that could take 12-18 months. Governor K. Ueda, in the meantime, did not rule out a shift of the policy during the above-mentioned period.
Other than the BoJ event, the Japanese docket showed an uptick in the Unemployment Rate to 2.8% in March. Additionally, preliminary readings expect the Industrial Production to have contracted 0.7% YoY in March, while Retail Sales expanded 7.2% and Housing Starts shrink 3.2% YoY also in March.
North from the April peak at 136.56 (April 28) aligns the key 200-day SMA at 136.97 seconded by the 2023 high at 137.91 (March 8). Once USD/JPY clears this level, it could dispute weekly highs at 139.89 (November 30 2022) and 142.25 (November 21 2022). On the other hand, the weekly low at 133.01 (April 26) precedes the interim 100-day SMA at 132.86 prior to the minor level at 132.01 (April 13) and the April low at 130.62 (April 5). The loss of this level could put the March low at 129.63 (March 24) back on the investors’ radar seconded by the February low at 128.08 (February 2) and the 2023 low at 127.21 (January 16). The daily RSI jumped past the 65 yardstick.
Resistance levels: 136.56 136.99 137.91 (4H chart)
Support levels: 133.01 132.89 132.01 (4H chart)
GBPUSD
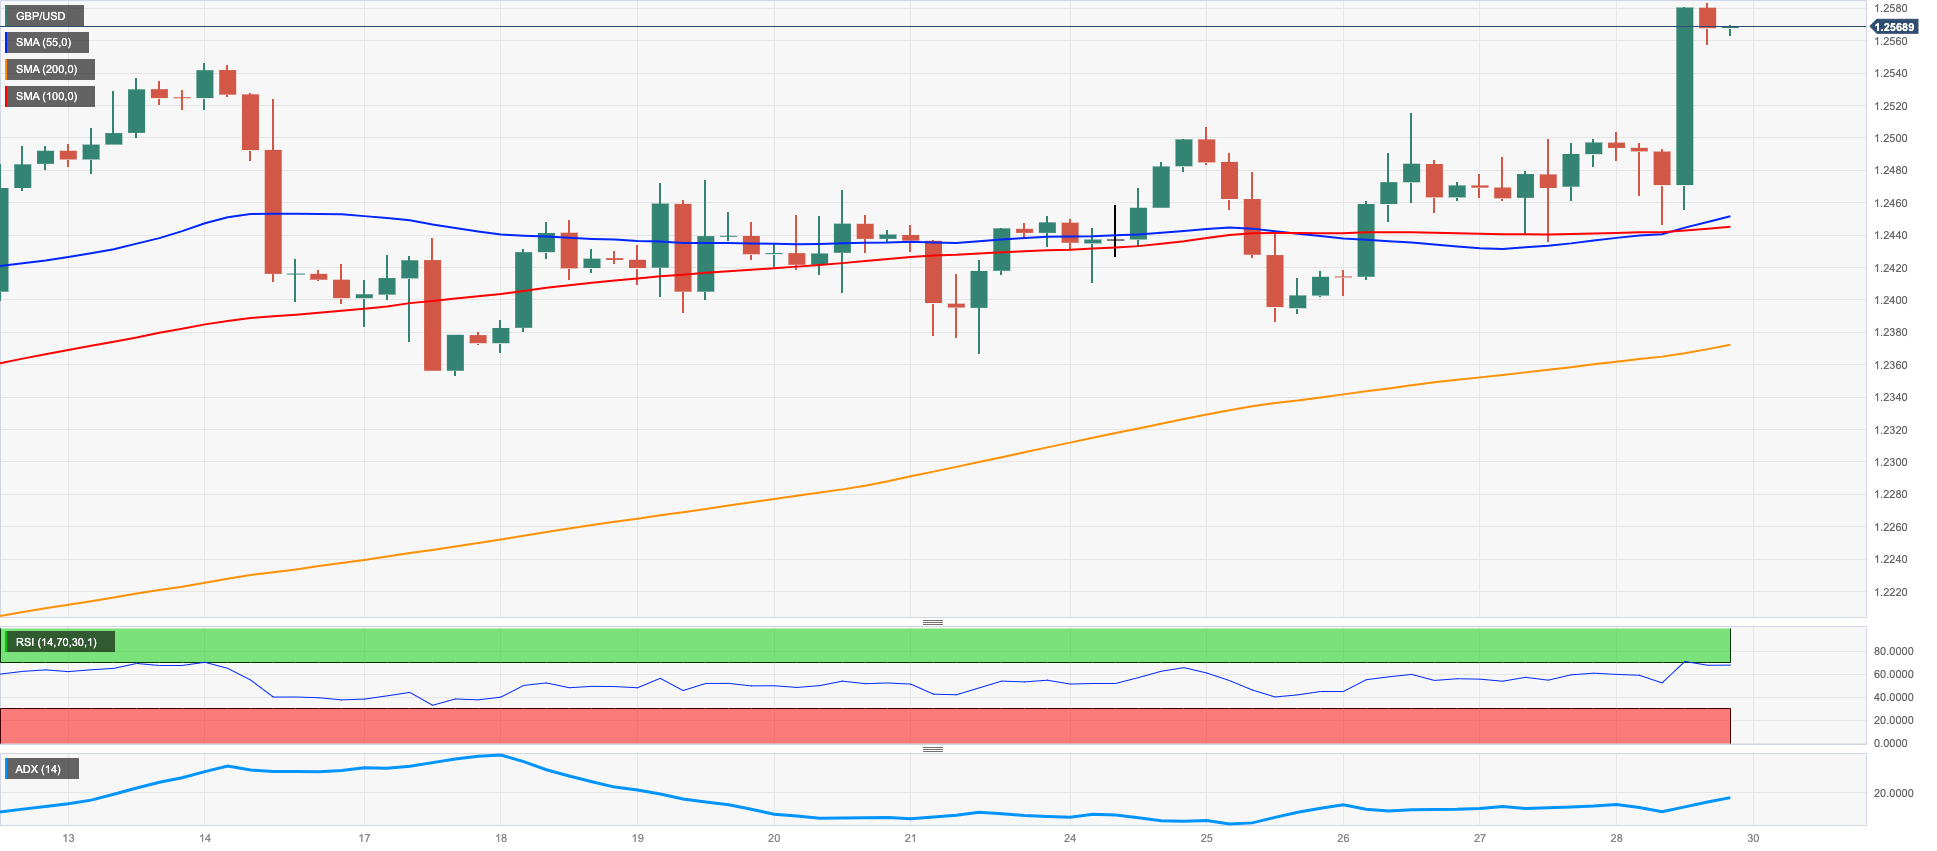
GBP/USD clinched the third consecutive daily advance despite further recovery in the greenback at the end of the week.
Looking at the weekly chart, the Sterling recorded the 7th advance in a row vs. the buck, up more than 5 big figures since the March lows near the 1.1800 neighbourhood.
In fact, Cable poked with levels just shy of the key 1.2600 the figure on Friday, an area last traded back in early June 2022, pari passu with the second daily gain in the USD Index (DXY) despite the corrective decline in US and UK yields.
In the UK, Car Production expanded 6.1% in the year to March in what was the only release across the Channel on Friday.
GBP/USD recorded a new 2023 high at 1.2583 (April 28). The surpass of this level could encourage spot to challenge the May 2022 high at 1.2666 (May 27) and the 200-week SMA at 1.2865, all ahead of the psychological 1.3000 mark. To the contrary, the weekly low at 1.2344 (April 10) is expected to hold occasional bearish moves ahead of the April low at 1.2274 (April 3) and the temporary 55-day SMA at 1.2233. South from here emerges the key 200-day SMA at 1.1937 followed by the 2023 low at 1.1802 (March 8). The daily RSI advanced leapt past the 63 hurdle.
Resistance levels: 1.2583 1.2599 1.2666 (4H chart)
Support levels: 1.2436 1.2386 1.2364 (4H chart)
AUDUSD
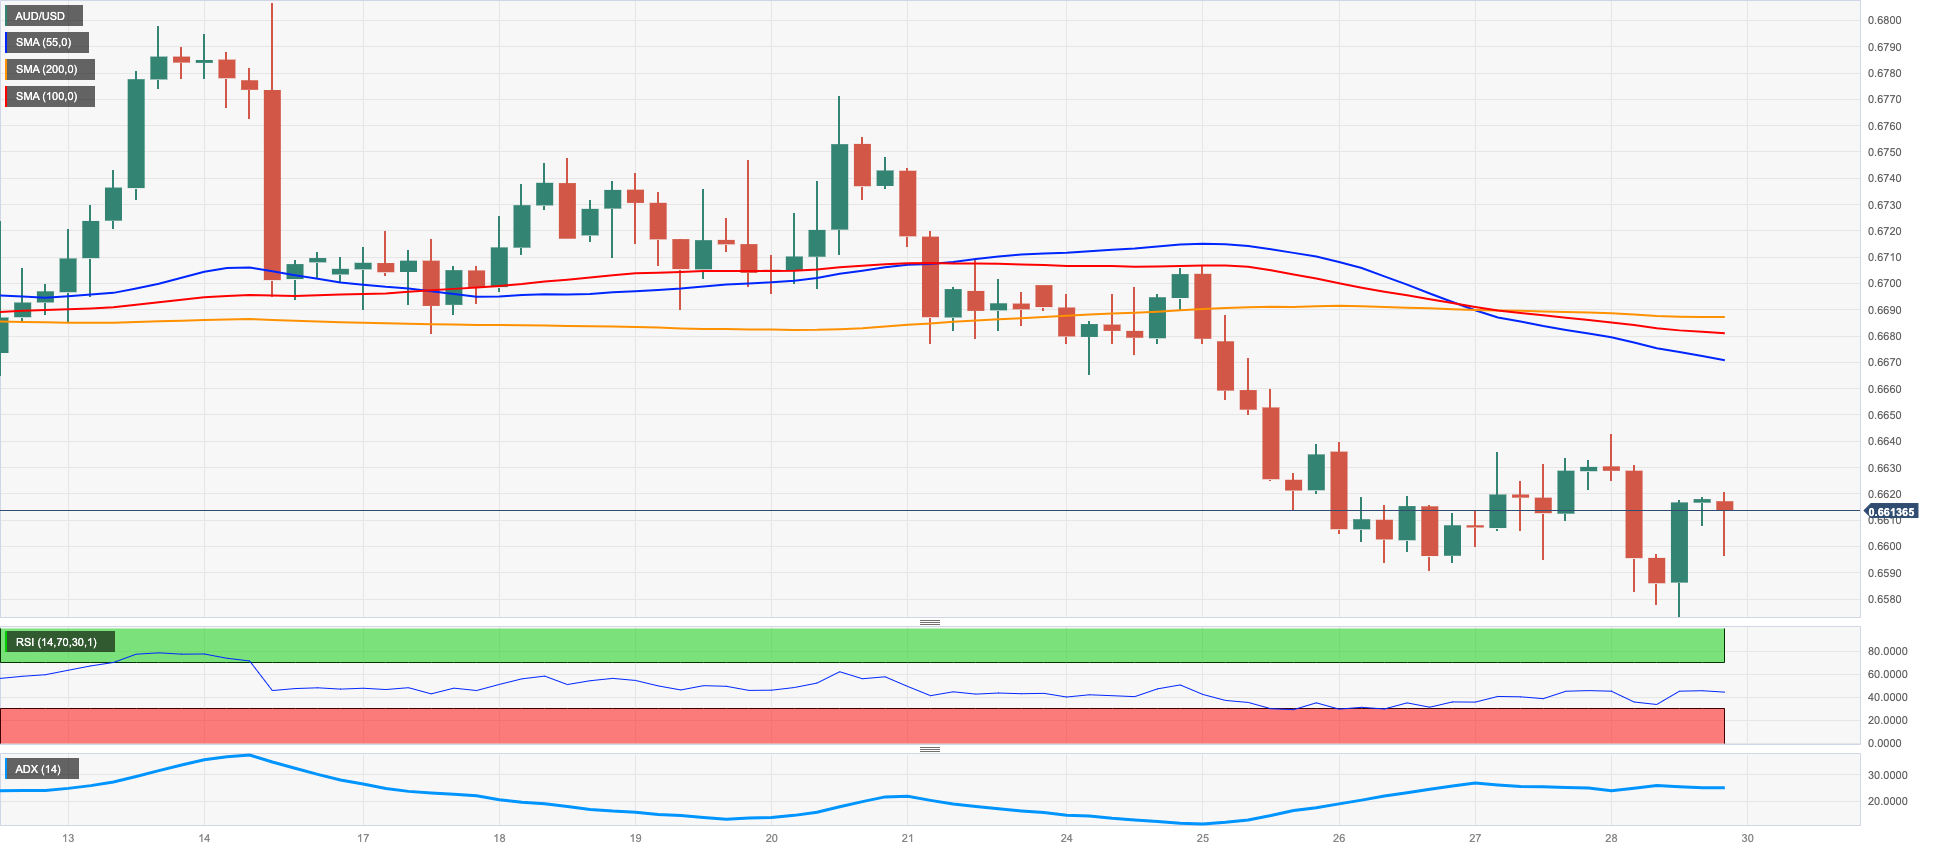
After dropping to new multi-week lows near 0.6570, AUD/USD managed to regain some composure, although it was insufficient to return to the positive territory and ended Friday’s session just above 0.6600 the figure.
The continuation of the buying pressure in the greenback weighed on the Aussie dollar and sponsored another mixed/bearish session in the commodity complex, where the irresolute price action in copper prices contrasted with the sharp pullback in the iron ore.
In the Australian docket, Housing Credit expanded 0.3% in March from the month earlier. Furthermore, Producer Prices rose 1.0% QoQ in Q1 and 5.2% over the last twelve months.
AUD/USD remains under pressure for the time being. Against that, a drop below the April low at 0.6573 (April 28) could prompt a potential test of the 2023 low at 0.6563 (March 10) to emerge on the horizon ahead of the weekly low at 0.6386 (November 10 2022) and the November 2022 low at 0.6272 (November 3). Instead, there is a temporary up-barrier at the 55-day SMA at 0.6716 just ahead of the key 200-day SMA at 0.6735 and the weekly top at 0.6771 (April 20). The breakout of the latter could trigger further recovery to the April peak at 0.6805 (April 14) seconded by the key round level at 0.7000 and the weekly high at 0.7029 (February 14). North from here lines up the 2023 top at 0.7157 (February 2). The daily RSI lost the grip and broke below 42.
Resistance levels: 0.6642 0.6685 0.6771 (4H chart)
Support levels: 0.6586 0.6563 0.6386 (4H chart)
GOLD
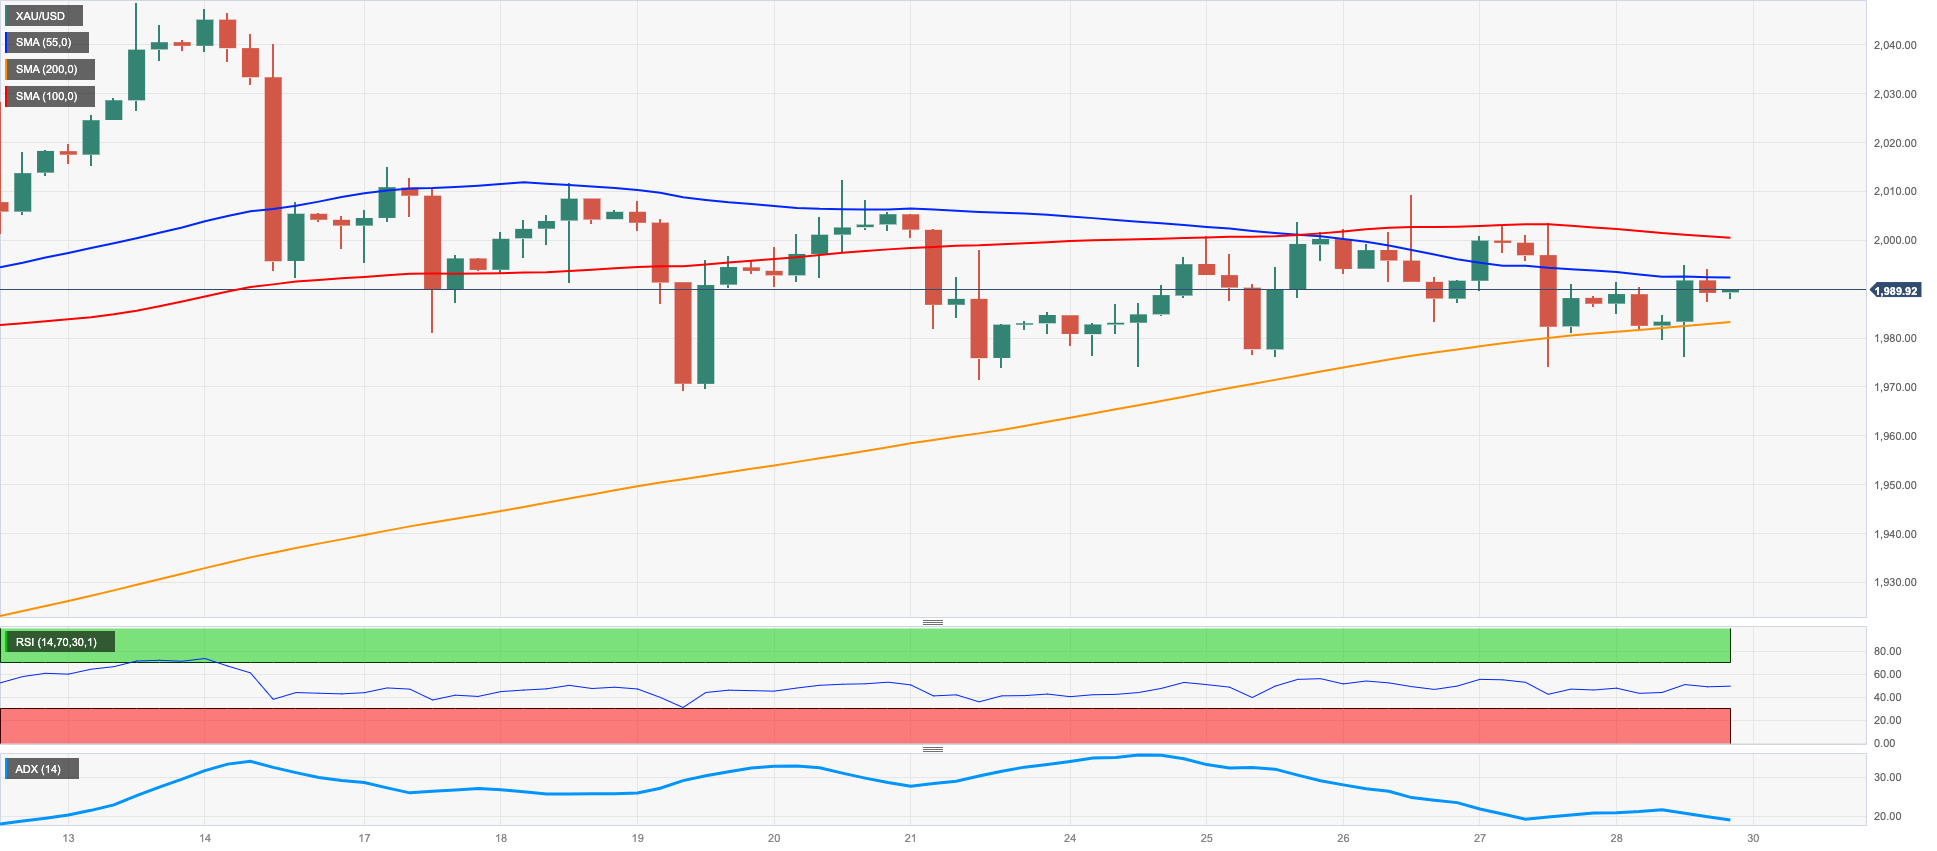
Gold prices managed to end the trading week with marginal gains near the $1990 mark per ounce troy. On a weekly basis, bullion also closed with modest gains after two consecutive pullbacks.
The continuation of the upside momentum in the greenback – despite losing some traction towards the end of the session – kept the price action around the yellow metal depressed, although the marked retracement in US yields across the curve underpinned the daily recovery.
Moving forward, gold is expected to keep the cautious trade well in place in light of the upcoming FOMC event on May 3. On this, market participants appear to have already priced in a 25 bps interest rate raise.
Gold prices remain within a consolidative phase for the time being. That said, the immediate up-barrier appears at the 2023 top at $2048 (April 13) prior to the 2022 peak at $2070 (March 8) and the all-time high at $2075 (August 7 2020). In opposition, the weekly low at $1969 (April 19) comes first followed by the April low at $1949 (April 3) and provisional contention levels at the 55- and 100-day SMAs at $1926 and $1898, respectively. Down from here, the metal could confront the March low at $1809 (March 8) before the 2023 low at $1804 (February 28).
Resistance levels: $2015 $2048 $2070 (4H chart)
Support levels: $1980 $1949 $1934 (4H chart)
CRUDE WTI
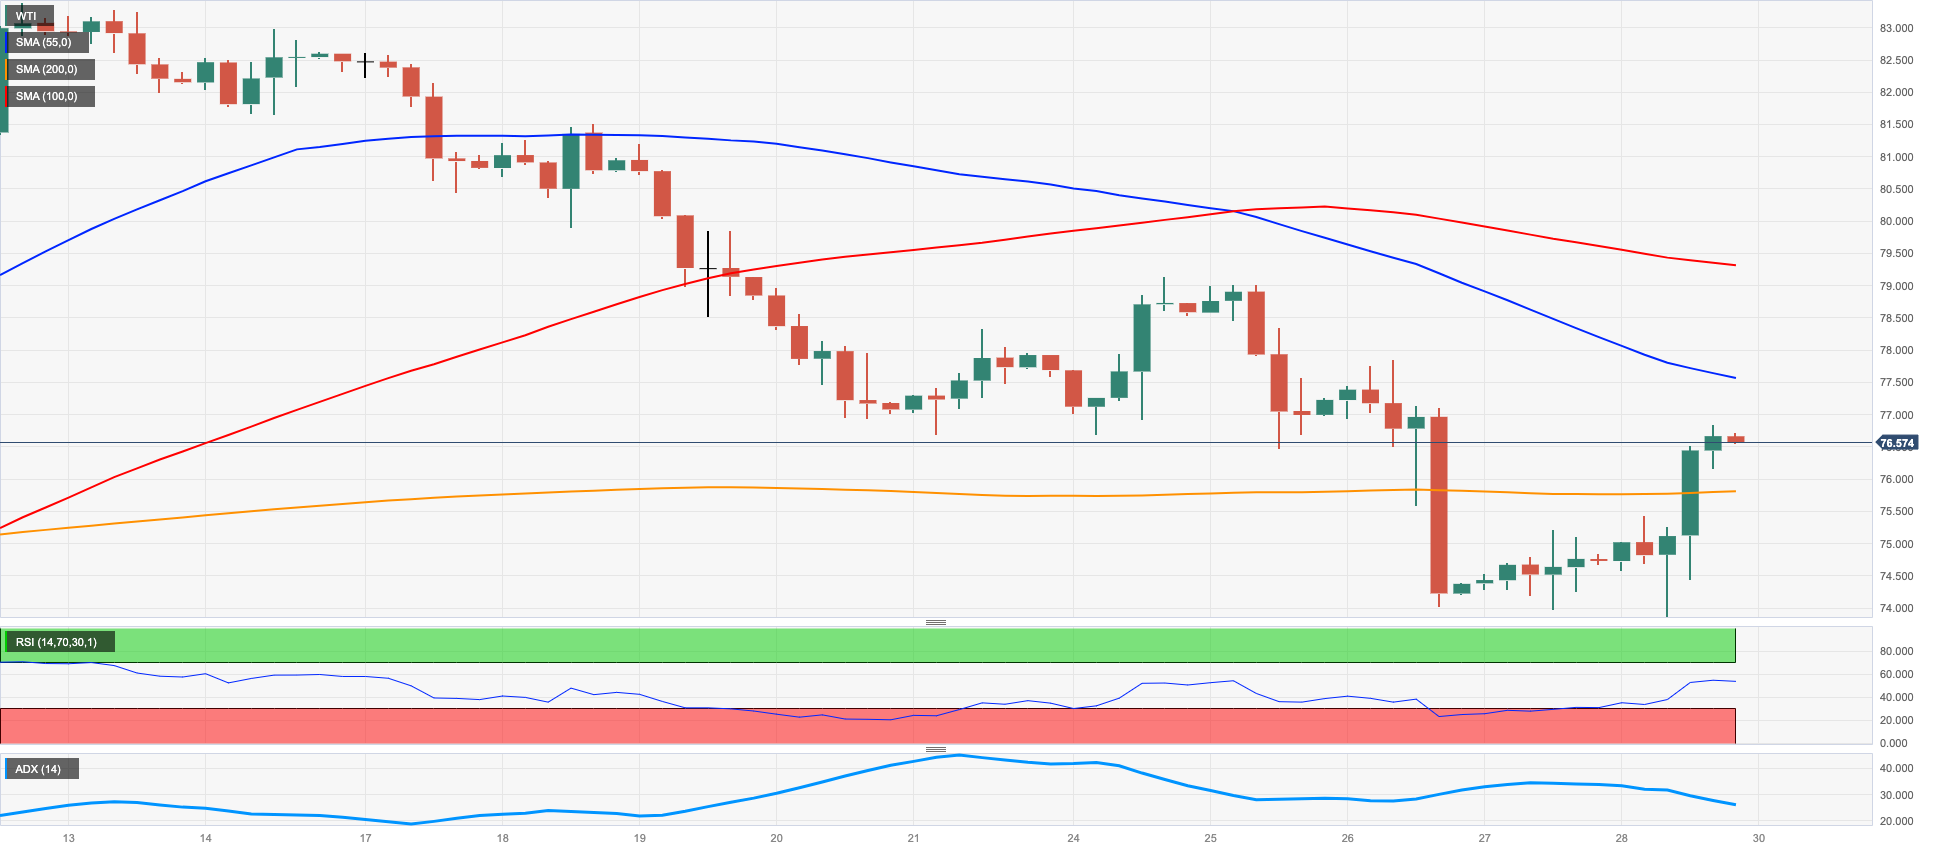
Prices of the barrel of the WTI advanced for the second session in a row on Friday, extending at the same time the recovery seen in the second half of the week. Despite this bounce, the commodity ended the second consecutive week with losses and covered the post-OPEC+ gap recorded early in April.
Further gains in the WTI came after traders shrugged off potential recession concerns, while the EIA’s report showing a drop in US crude oil production during February and a higher fuel demand also collaborated with the daily uptick.
In the docket, driller Baker Hughes said the US total active oil rigs remained unchanged at 591 in the week to April 28.
The breakdown of the April 27 low at $73.97 could see the WTI extend the decline to, initially, the weekly low at $73.84 (28 April) prior to the key $70.00 mark and the $66.86 level (March 24). Further weakness carries the potential to retest the 2023 low at $64.41 (March 20) before the December 2021 low at $62.46 (December 2) and the key $60.00 mark per barrel. Just the opposite, there is an initial hurdle at the weekly peak at $79.14 (April 24) ahead of the key 200-day SMA at $81.92. North from here emerges the 2023 top at $83.49 (April 12) before the November 2022 peak $93.73 (November 7).
Resistance levels: $76.89 $77.89 $79.14 (4H chart)
Support levels: $73.97 $72.57 $66.79 (4H chart)
GER40
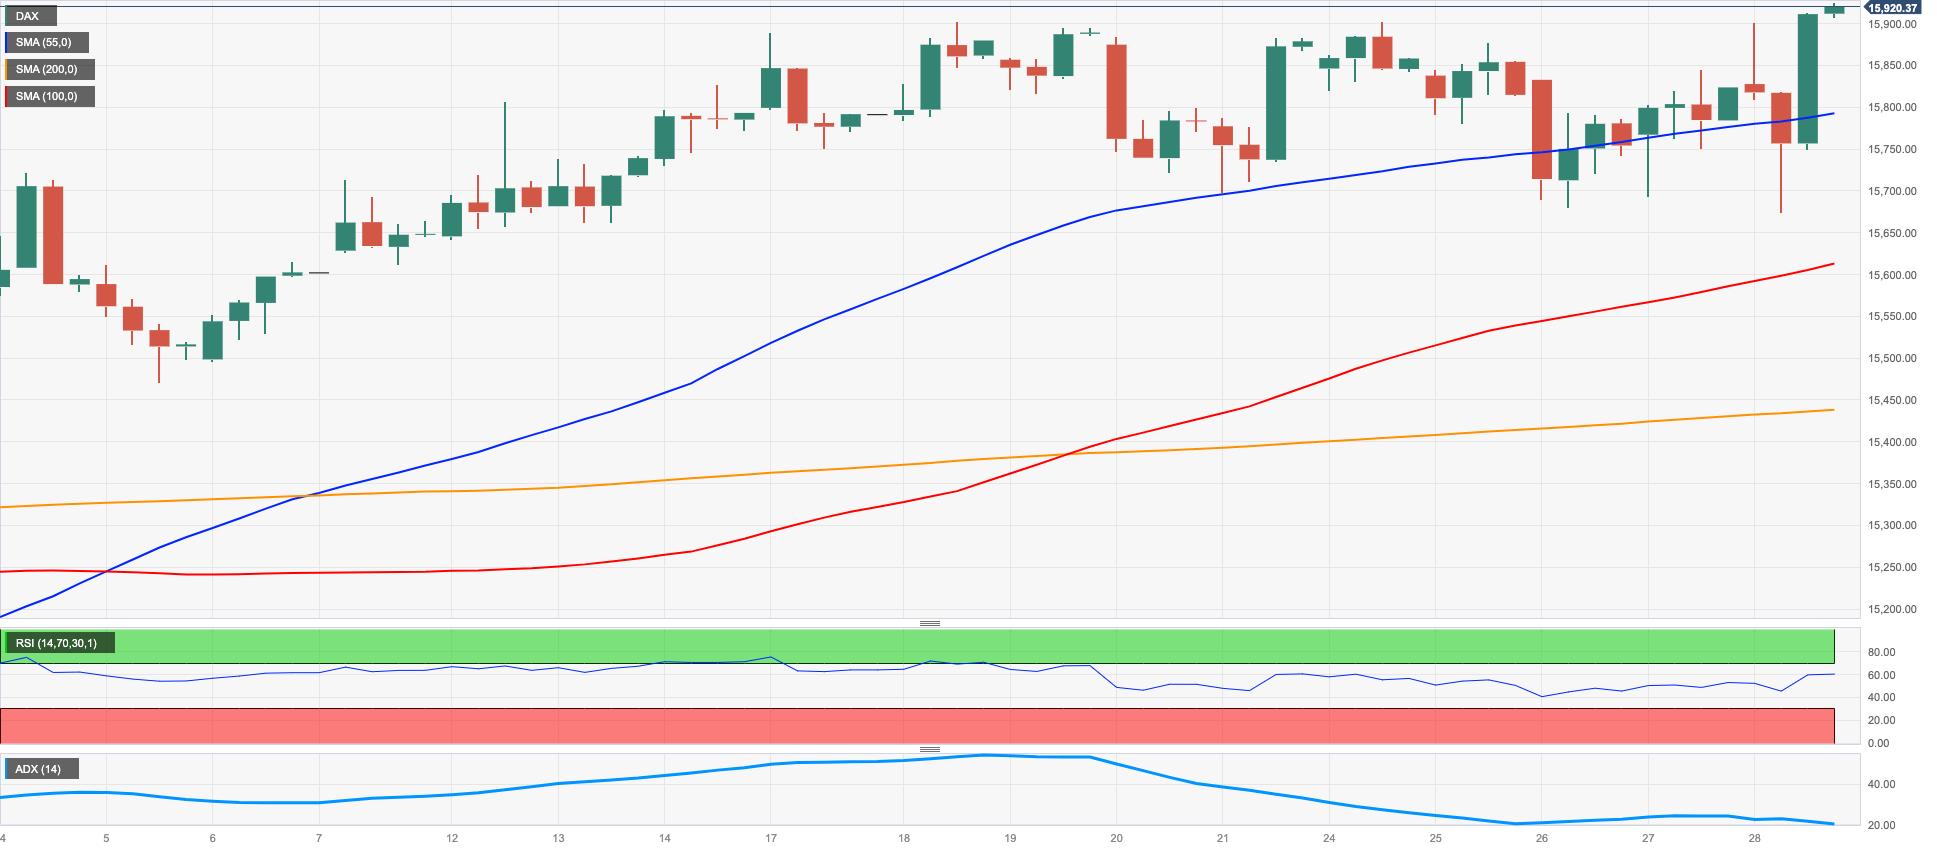
German equities gauged by the reference DAX40 recorded a new YTD peak past the 15900 yardstick on Friday, an area last traded back in early January 2022. It is worth noting that the index also clinched the third consecutive week with gains.
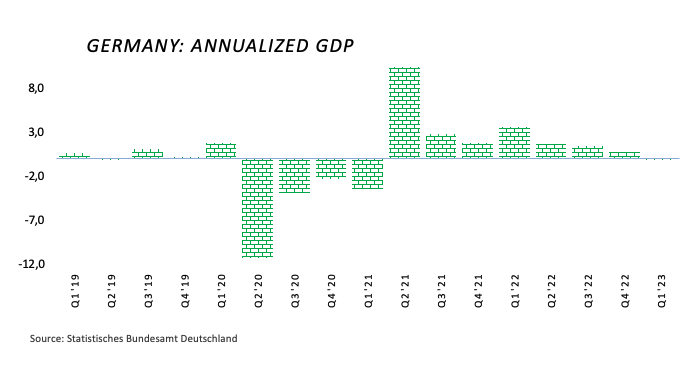
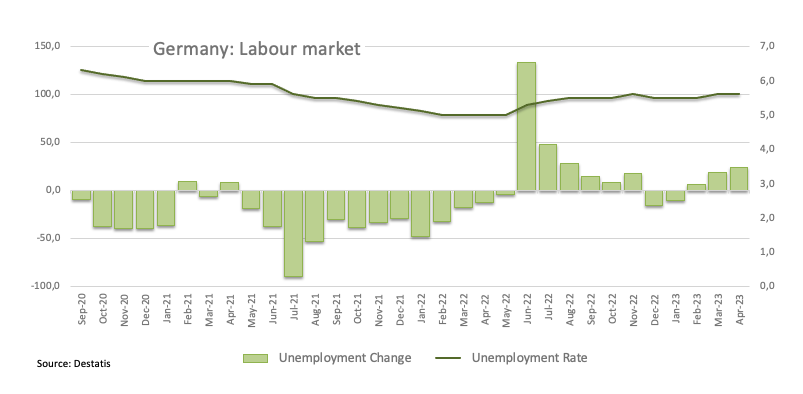
The optimism among investors remained well and sound and was propped up by positive results from corporate reports, which at the same time managed to leave behind disappointing results from the German labour market and below-expected advanced readings from GDPs in Germany and the broader euro area during the first quarter.
In the meantime, the 10-year Bund yields resumed the downtrend and tested multi-session lows near the 2.30% area.
In the domestic calendar, flash GDP figures saw the German economy contracting 0.1% YoY in Q1, with no expansion seen vs. the previous period. Additionally, the Unemployment Rate remained at 5.6% and the Unemployment Change rose by 24K people in April. Finally, advanced inflation readings expect the CPI to rise 7.2% in the year to April.
Immediately to the upside for the DAX40 now emerges the round level at 16000 prior to the 2022 top at 16285 (January 5). The other way around, the next support comes at the April low at 15482 (April 5) prior to the provisional 100-day SMA at 15102 and the minor support at 14809 (March 24). The loss of this level could expose the March low at 14458 (March 20) before the key 200-day SMA at 14191. The daily RSI advanced to the boundaries of 63.
Best Performers: Covestro, Deutsche Boerse, Hannover Rueck SE
Worst Performers: Commerzbank, BASF, Deutsche Telekom AG
Resistance levels: 15922 16090 16285 (4H chart)
Support levels: 15688 15482 15422 (4H chart)
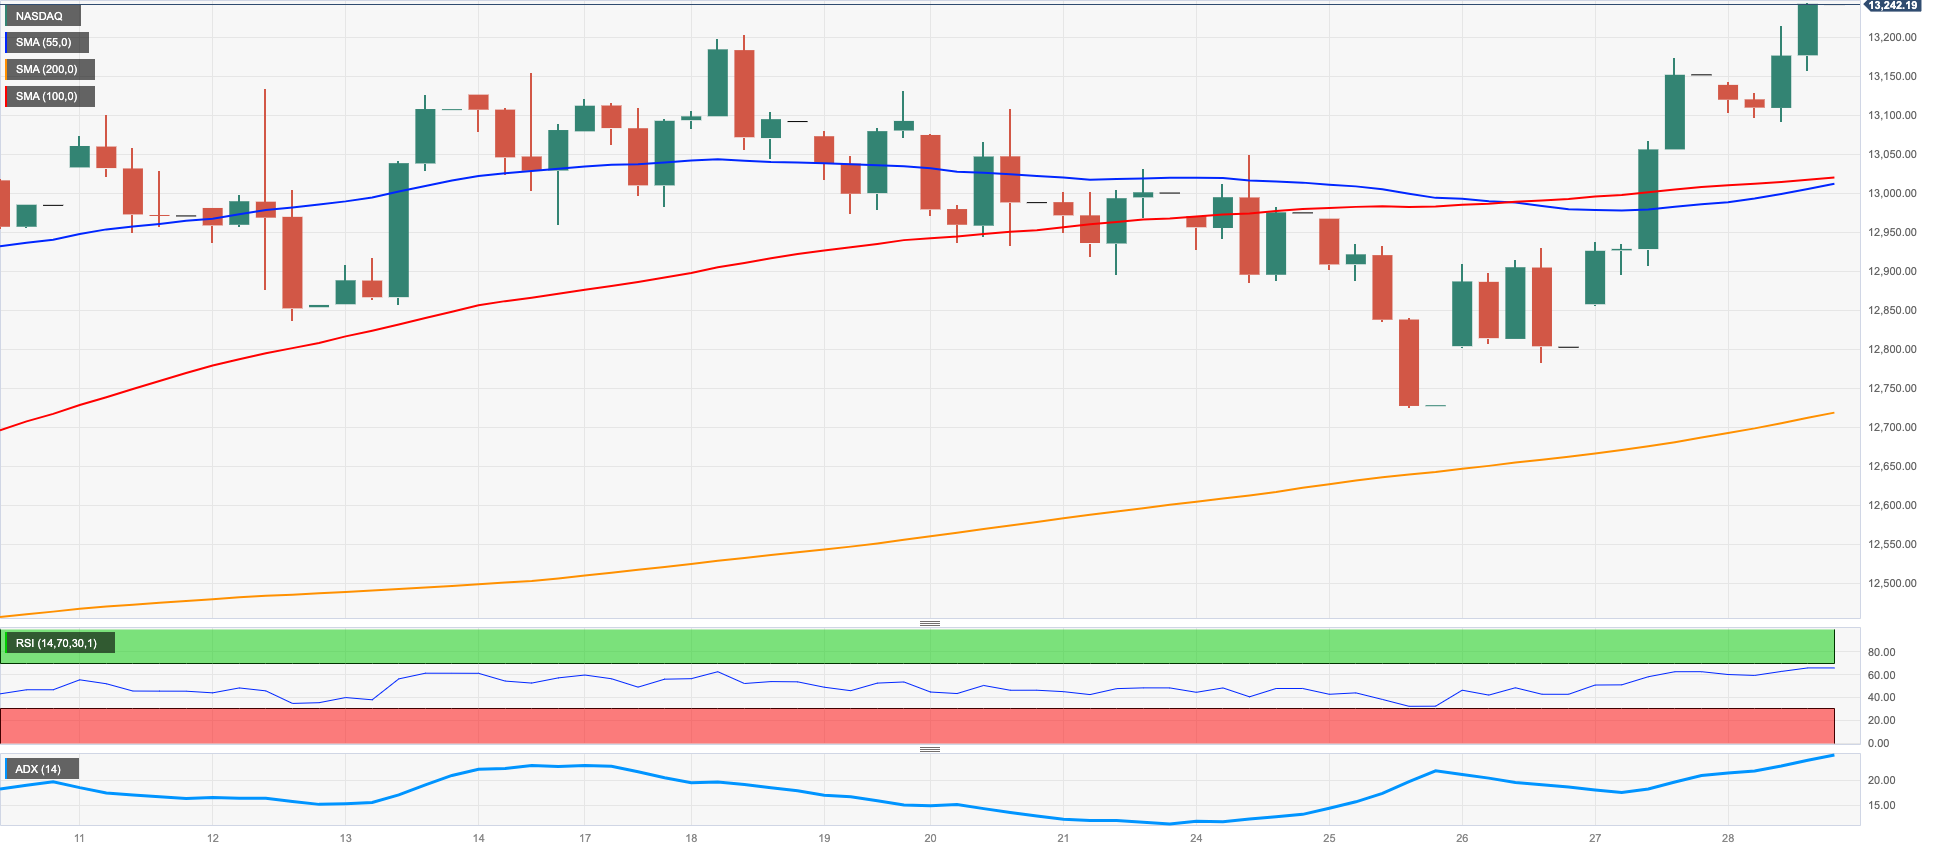
NASDAQ
Further optimism stemming from better-than-estimated quarterly earnings reports left behind recession fears and underpinned the move higher in the tech benchmark Nasdaq 100 on Friday.
Indeed, the index rose to levels last visited back in August 2022 near the 13300 region also helped by declining US yields across the curve and amidst investors’ firmer expectations of another 25 bps rate hike by the Fed at the May 3 event.
Next on the upside for the Nasdaq 100 emerges the August 2022 top at 13720 (August 16) ahead of the round level at 14000 and the March 2022 top at 15265 (March 29). On the opposite side, the next contention level resurfaces at the April low at 12724 (April 25) before the temporary 55-day SMA at 12600 and the weekly low at 12517 (March 28). Extra weakness could see the key 200-day SMA at 12054 revisited prior to the March low at 11695 (March 13) and weekly lows at 11550 (January 25) and 11251 (January 19), all prior to the 2023 low at 10696 (January 6). The daily RSI gathered traction and poked with 62.
Top Gainers: Charter Communications Inc, Intel, Micron
Top Losers: Crowdstrike Holdings, Datadog, T-Mobile US
Resistance levels: 13247 13720 14277 (4H chart)
Support levels: 12724 12517 12125 (4H chart)
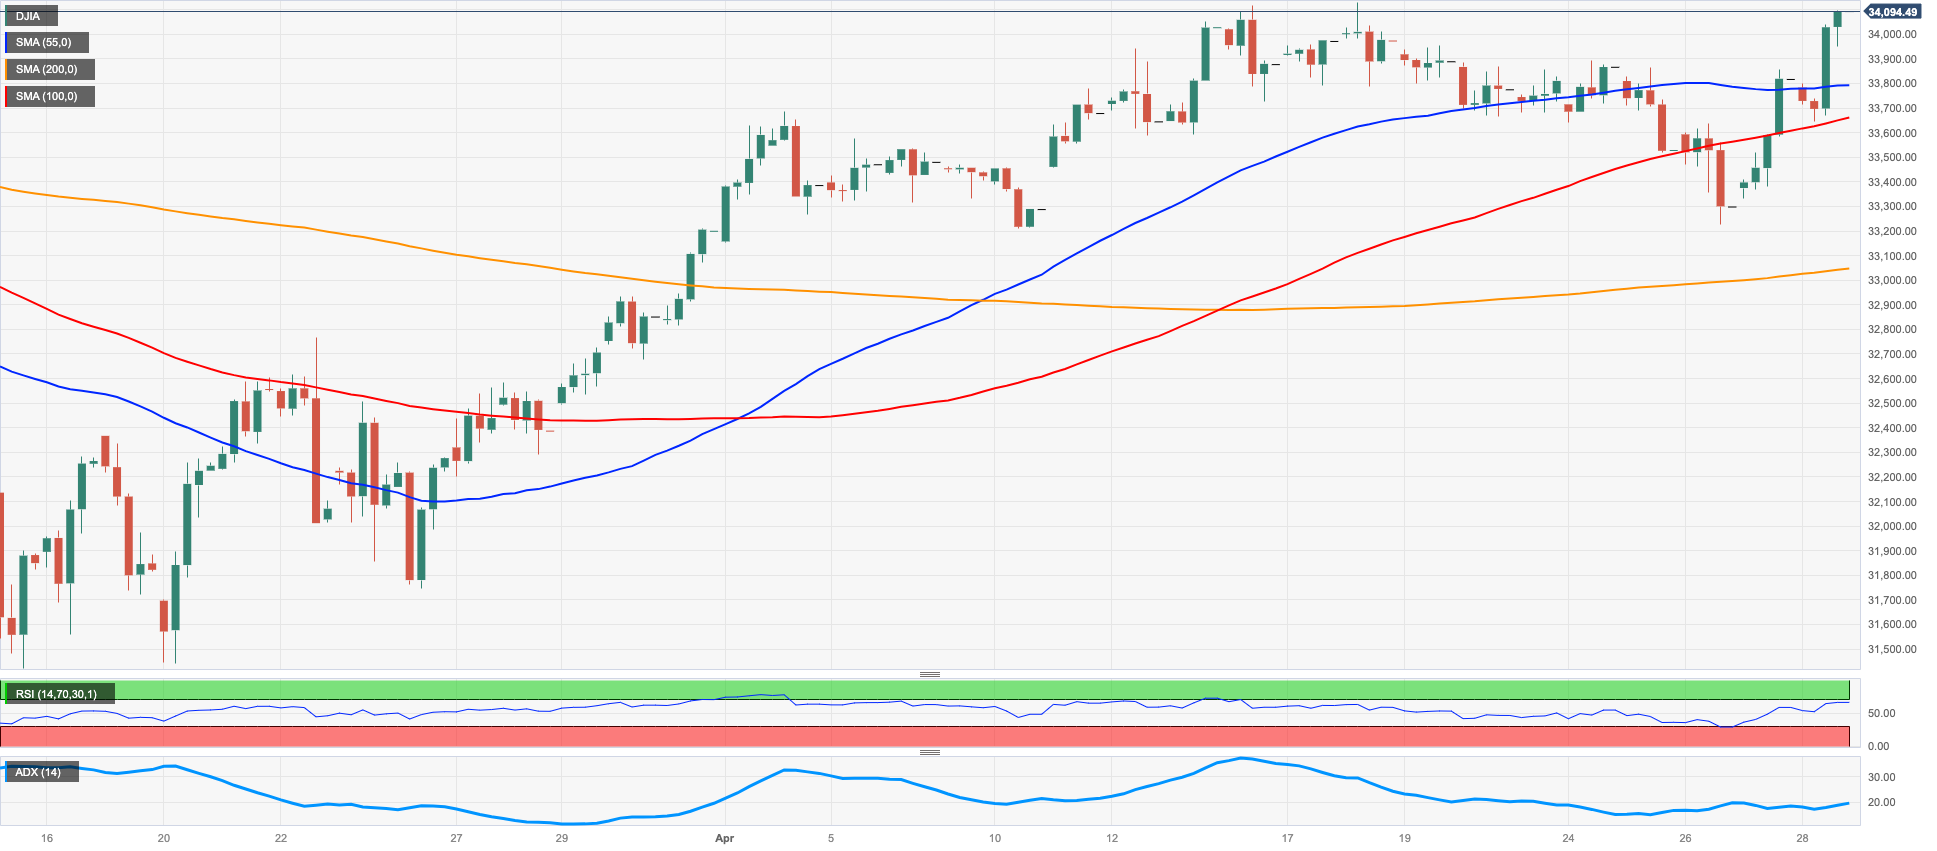
DOW JONES
US equities measured by the Dow Jones added to Thursday’s gains and advanced to new 2-month highs past the 34100 level at the end of the week. The daily uptick in the index came in line with the rest of the major US stocks indices.
In fact, better-than-expected results from corporate earnings reports eclipsed persistent concerns over a potential economic slowdown, while market participants started to shift their attention to the upcoming May 3 FOMC event.
On the whole, the Dow Jones gained 0.80% to 34098, the S&P500 rose 0.83% to 4169 and the tech-heavy Nasdaq Composite advanced 0.69% to 12226.
Extra gains in the Dow Jones are now expected to retarget the 2023 top at 34342 (January 13) prior to the December 2022 peak at 34712 (December 13) and the April 2022 high at 35492 (April 21), all ahead of the February 2022 top at 35824 (February 9). On the contrary, further weakness below the April low at 33235 (April 26) could rapidly meet the provisional 55-day SMA at 33150 ahead of the key 200-day SMA at 32660 and the 2023 low at 31429 (March 15). The breach of the latter could put the 30000 region to the test ahead of the 2022 low at 28660 (October 13). The daily RSI trespassed the 61 mark.
Top Performers: Intel, Walt Disney, Home Depot
Worst Performers: IBM, Walmart, Amgen
Resistance levels: 34104 34334 34712 (4H chart)
Support levels: 33235 33062 31805 (4H chart)
MACROECONOMIC EVENTS

All Information & Updates provided by:

All information relating to the financial markets available on this page has been prepared and issued by FXStreet (Forexstreet SL, Spain, Reg: B62498233) on the basis of publicly available information and all information believed to be reliable and does not conflict with Kuwaiti local laws, and all necessary care has been taken to before the company to ensure that the facts mentioned are correct from the source.
NCM Investment nor any of its directors or employees shall in any way be held responsible for the contents of this news, and the information contained on this page is intended only to provide clients with publicly available information and should not be construed as investment advice, report or analysis and/or constitute an offer or invitation to buy or sell financial instruments of any kind.
RISK WARNING: Forex and CFDs are highly risky leveraged products, as losses can exceed deposits. Please ensure you understand all the risks and take independent advice if necessary. NCM will segregate the clients based on the criteria of the regulator and its bylaws. NCM does not provide any advisory service; the material published does not constitute advice or a recommendation for a transaction in any financial instrument. NCM accepts no responsibility for any use of the content presented and any consequences of that use. Anyone acting on the information provided does so at their own risk.