
- Contact Us:
-

-

-

-


Daily Market Updates
02 May 2023
USDJPY
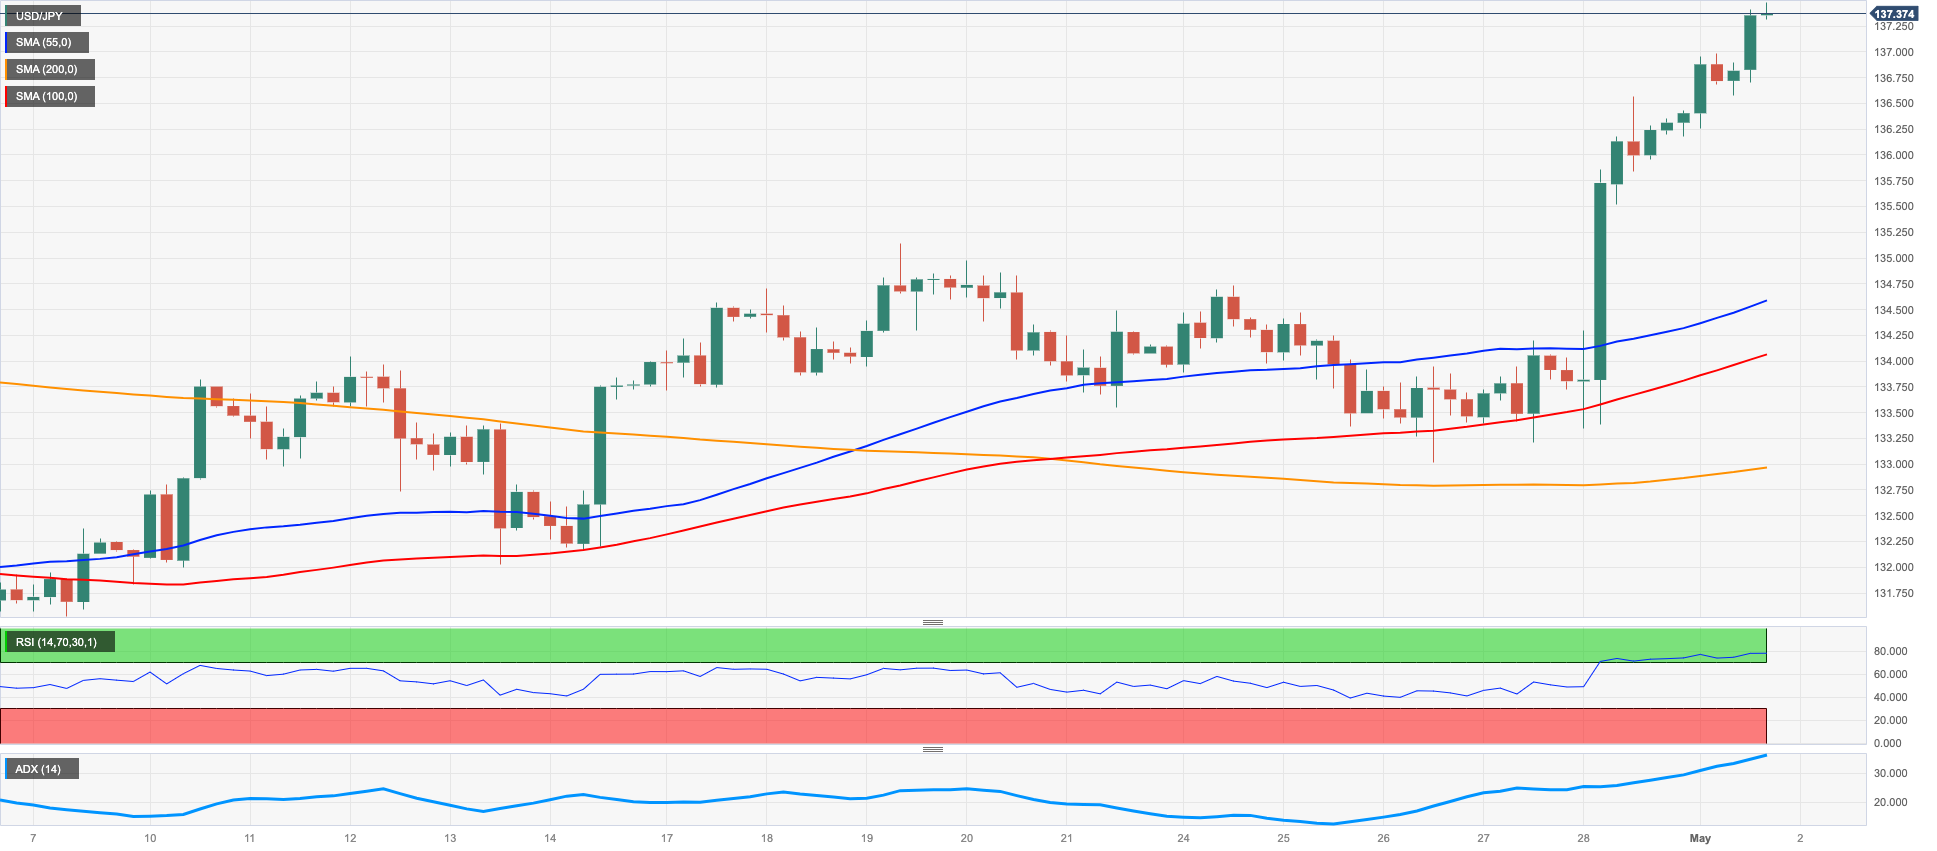
The Japanese depreciated further and lifted USD/JPY well north of 137.00 the figure for the first time since early March at the beginning of the week, an area coincident with the critical 200-day SMA.
Indeed, investors continued to dump the yen in the wake of the unchanged stance from the last BoJ event on April 28. That, coupled with the strong gains in the dollar and rising US yields collaborated with the move to 8-week highs in the pair.
Following the BoJ gathering, investors now seem to have moved their expectations of any kind of tweak to the current ultra-accommodative stance to the June meeting.
In the Japanese bond market, the JGB 10-year yields remained in the lower end of the recent range near 0.40% following Friday’s marked pullback.
In Japan, the final Jibun Bank Manufacturing PMI came at 49.5 in April and Consumer Confidence improved to 35.4 also during last month.
The continuation of the uptrend in USD/JPY should now meet the next obstacle at the 2023 top at 137.91 (March 8) ahead of weekly peaks at 139.89 (November 30 2022) and 142.25 (November 21 2022). To the contrary, the immediate support emerges at the weekly low at 133.01 (April 26) just before the provisional 100-day SMA at 132.85 and the minor level at 132.01 (April 13). The breach of this level could put a potential test of the April low at 130.62 (April 5) back on the investors’ radar prior to the March low at 129.63 (March 24) and the February low at 128.08 (February 2). A deeper drop could see the 2023 low at 127.21 (January 16) revisited. The daily RSI leapt past the 69 mark.
Resistance levels: 137.48 137.91 138.17 (4H chart)
Support levels: 133.01 132.01 130.62 (4H chart)
GBPUSD
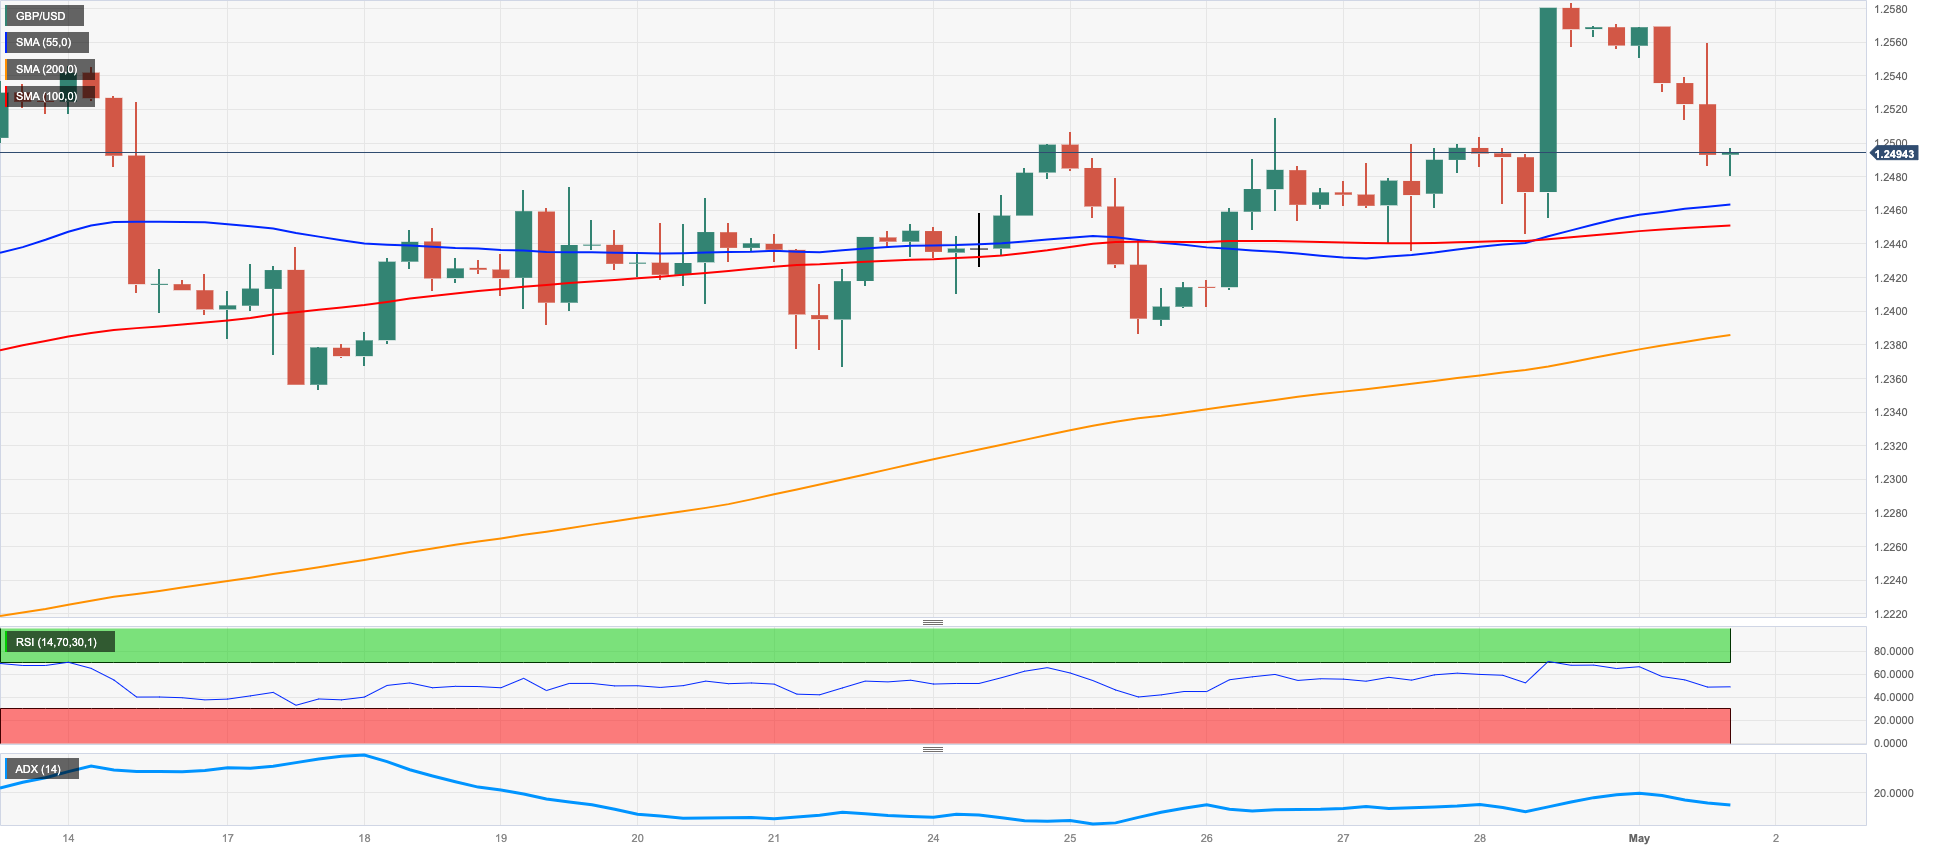
GBP/USD started the week on the (very) back foot and probed the sub-1.2500 region on the back of the pronounced uptick in the dollar on Monday.
Indeed, better-than-expected US ISM Manufacturing lifted spirits around the buck and propelled the USD Index (DXY) back above the 102.00 mark accompanied by an equally strong move higher in USD yields.
There was no activity in UK markets and the calendar remained empty due to the Labour Day Holiday.
The small knee-jerk in GBP/USD did not dent the ongoing bullish stance in the pair. Against that, bulls still face the next up-barrier at the 2023 top at 1.2583 (April 28) followed by the May 2022 top at 1.2666 (May 27) and the 200-week SMA at 1.2865, all prior to the psychological 1.3000 yardstick. By contrast, sellers should meet initial contention at the weekly low at 1.2344 (April 10) seconded by the April low at 1.2274 (April 3) and the temporary 55-day SMA at 1.2240. Down from here comes the key 200-day SMA at 1.1939 ahead of the 2023 low at 1.1802 (March 8). The daily RSI broke below he 57 level.
Resistance levels: 1.2583 1.2599 1.2666 (4H chart)
Support levels: 1.2436 1.2386 1.2364 (4H chart)
AUDUSD
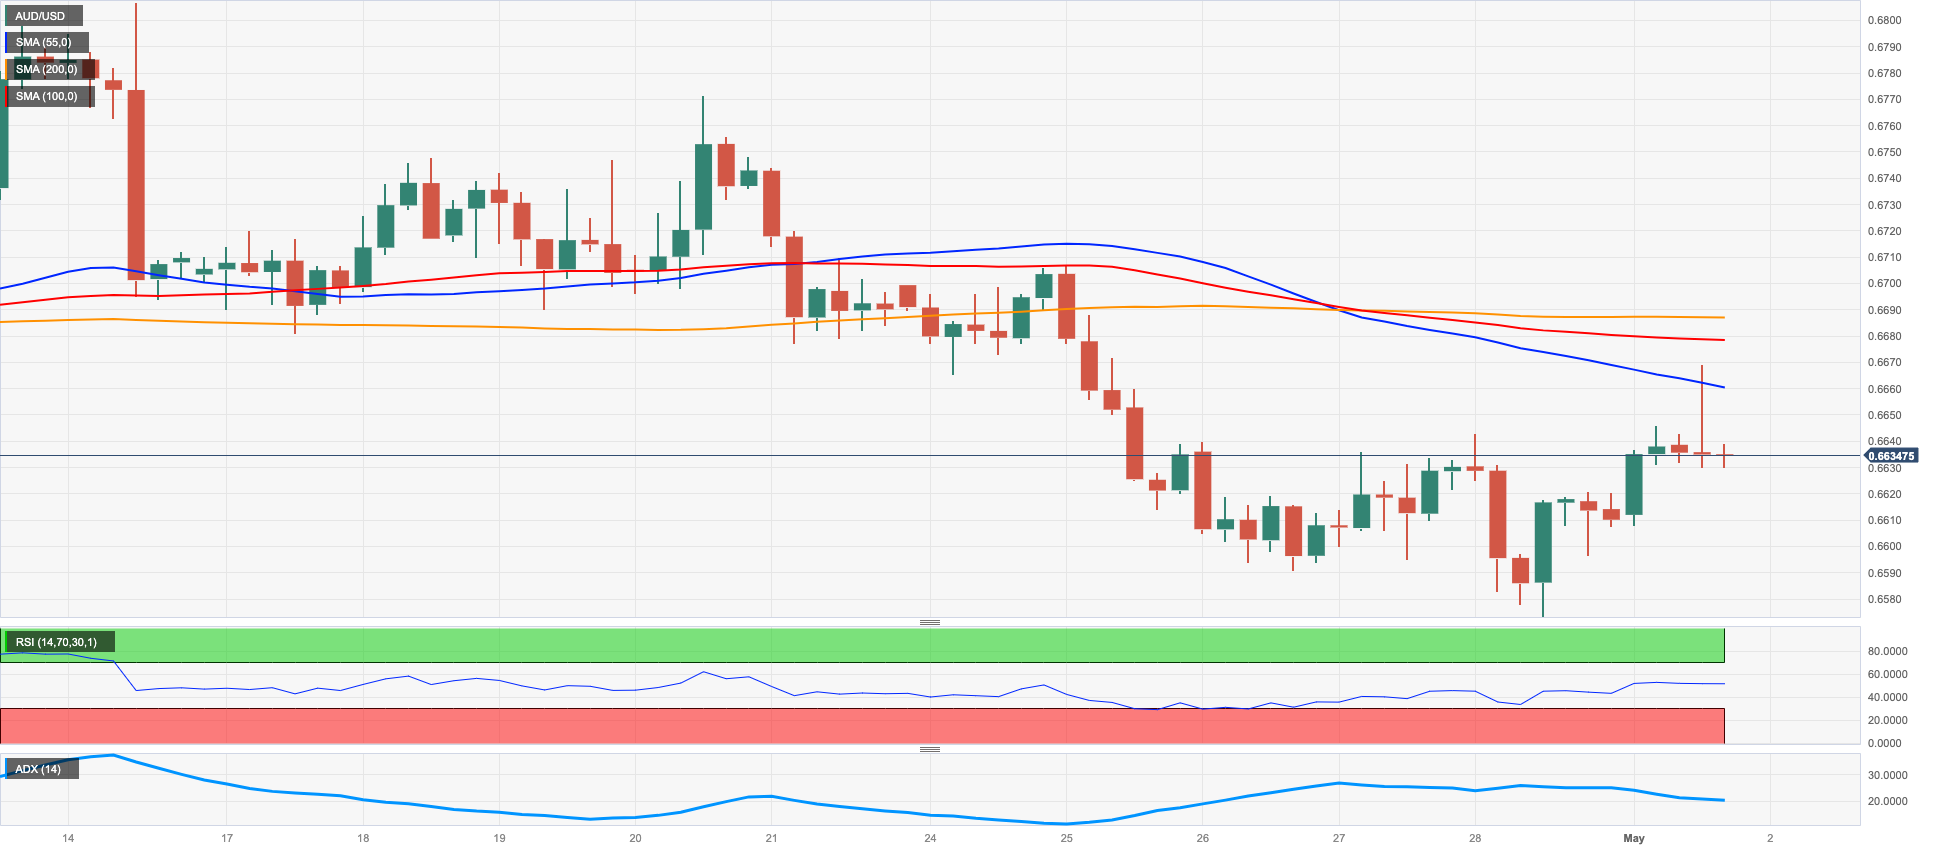
Despite the firm session in the greenback and poor prints from the Chinese manufacturing sector over the weekend, AUD/USD managed to chart decent gains to the 0.6670 region on Monday, where some initial resistance seems to have emerged so far.
The mixed performance in the commodity complex appears to have also lent legs to the Aussie dollar amidst further recovery in copper prices vs. quite a marked retracement in the iron ore.
In Oz, the final Judo Bank Manufacturing PMI eased to 48.0 in April, while Commodity Prices contracted 19.2% in the year to April.
AUD/USD now needs to quickly surpass the key 200-day SMA at 0.6733 to allow for a test of the weekly peak at 0.6771 (April 20) ahead of the April high at 0.6805 (April 14) and the key round level at 0.7000. North from here aligns the weekly top at 0.7029 (February 14) seconded by the 2023 peak at 0.7157 (February 2). On the other hand, the breach of the April low at 0.6573 (April 28) is expected to pave the way for a probable test of the 2023 low at 0.6563 (March 10) prior to the weekly low at 0.6386 (November 10 2022) and the November 2022 low at 0.6272 (November 3). The daily RSI rebounded to the vicinity of the 45 region.
Resistance levels: 0.6668 0.6684 0.6771 (4H chart)
Support levels: 0.6573 0.6563 0.6386 (4H chart)
GOLD
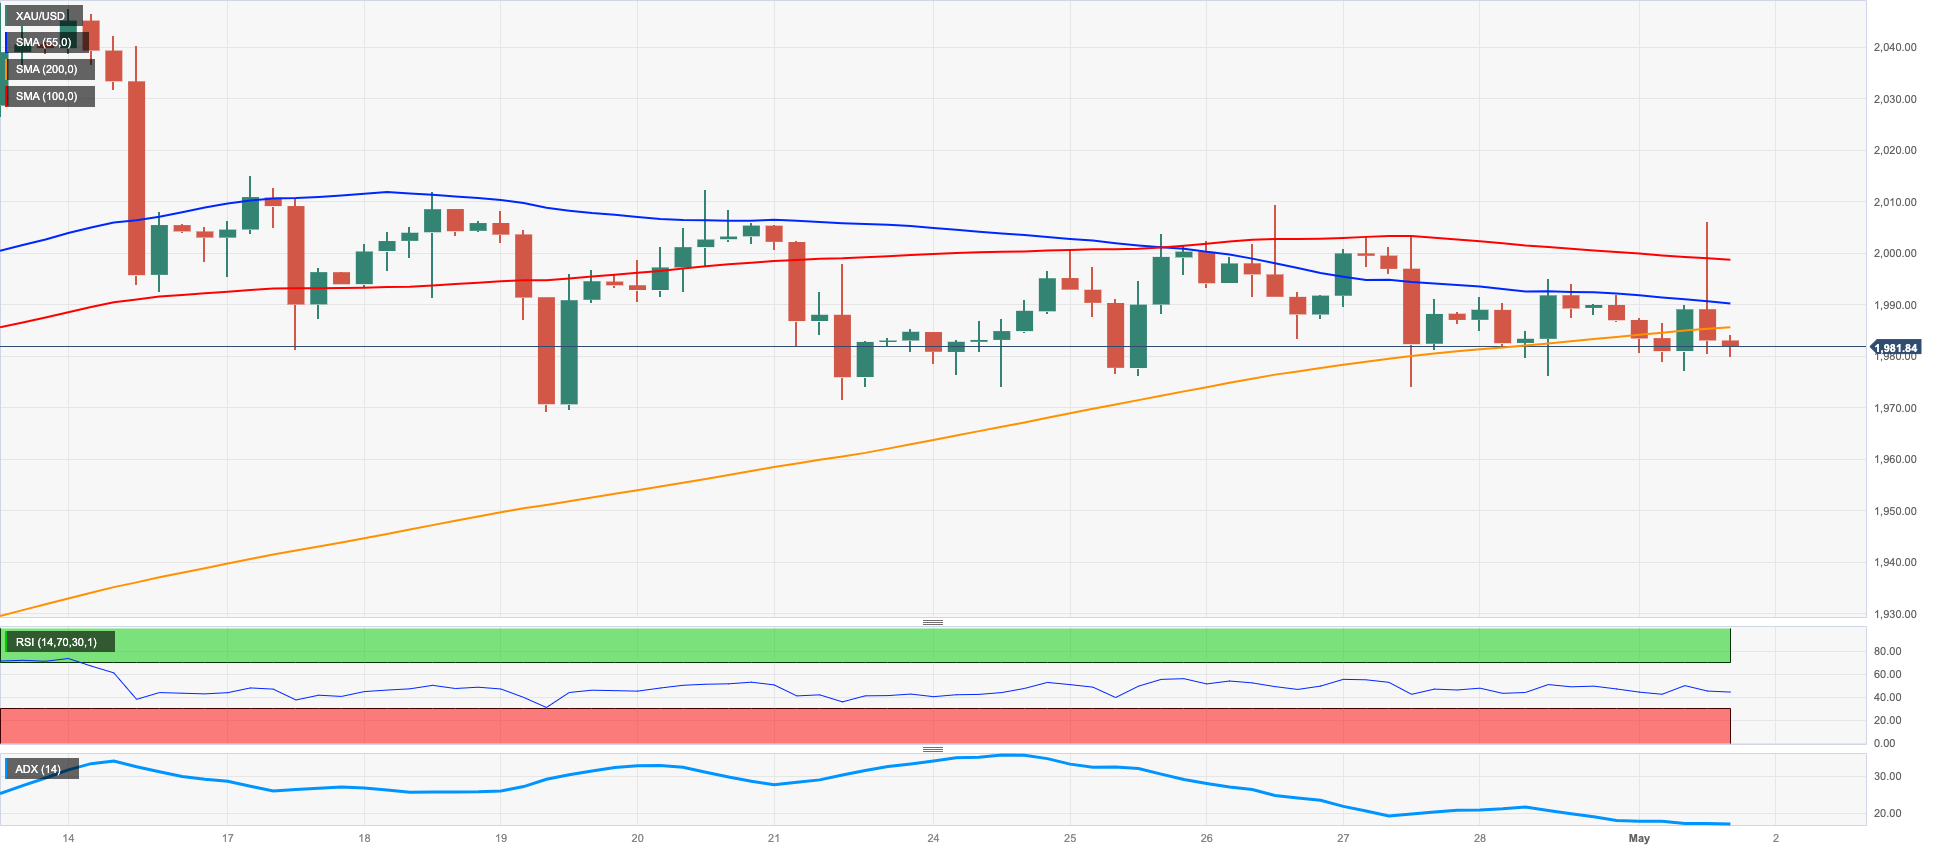
Prices of the ounce troy of the yellow metal started the week on the defensive and revisited the $1980 region amidst the current consolidative phase on Monday.
Further range bound trader in the precious metal came despite the post-ISM bounce in the dollar, while the march north in US yields across the curve also seem to have undermined occasional bullish attempts in bullion.
Furthermore, the FOMC meets on Tuesday-Wednesday and is largely anticipated to raise the interest rate by 25 bps. However, a probable pause following the May meeting has started to gather firm pace among market participants.
Further side-lined trade is not ruled out around gold. The breakout of this theme unveils the initial target at the 2023 peak at $2048 (April 13) ahead of the 2022 high at $2070 (March 8) and the all-time top at $2075 (August 7 2020). Instead, the initial support lines up at the weekly low at $1969 (April 19) ahead of the April low at $1949 (April 3) and interim support levels at the 55- and 100-day SMAs at $1928 and $1899, respectively. A drop below this region could put the March low at $1809 (March 8) to the test ahead of the 2023 low at $1804 (February 28).
Resistance levels: $2015 $2048 $2070 (4H chart)
Support levels: $1977 $1949 $1934 (4H chart)
CRUDE WTI
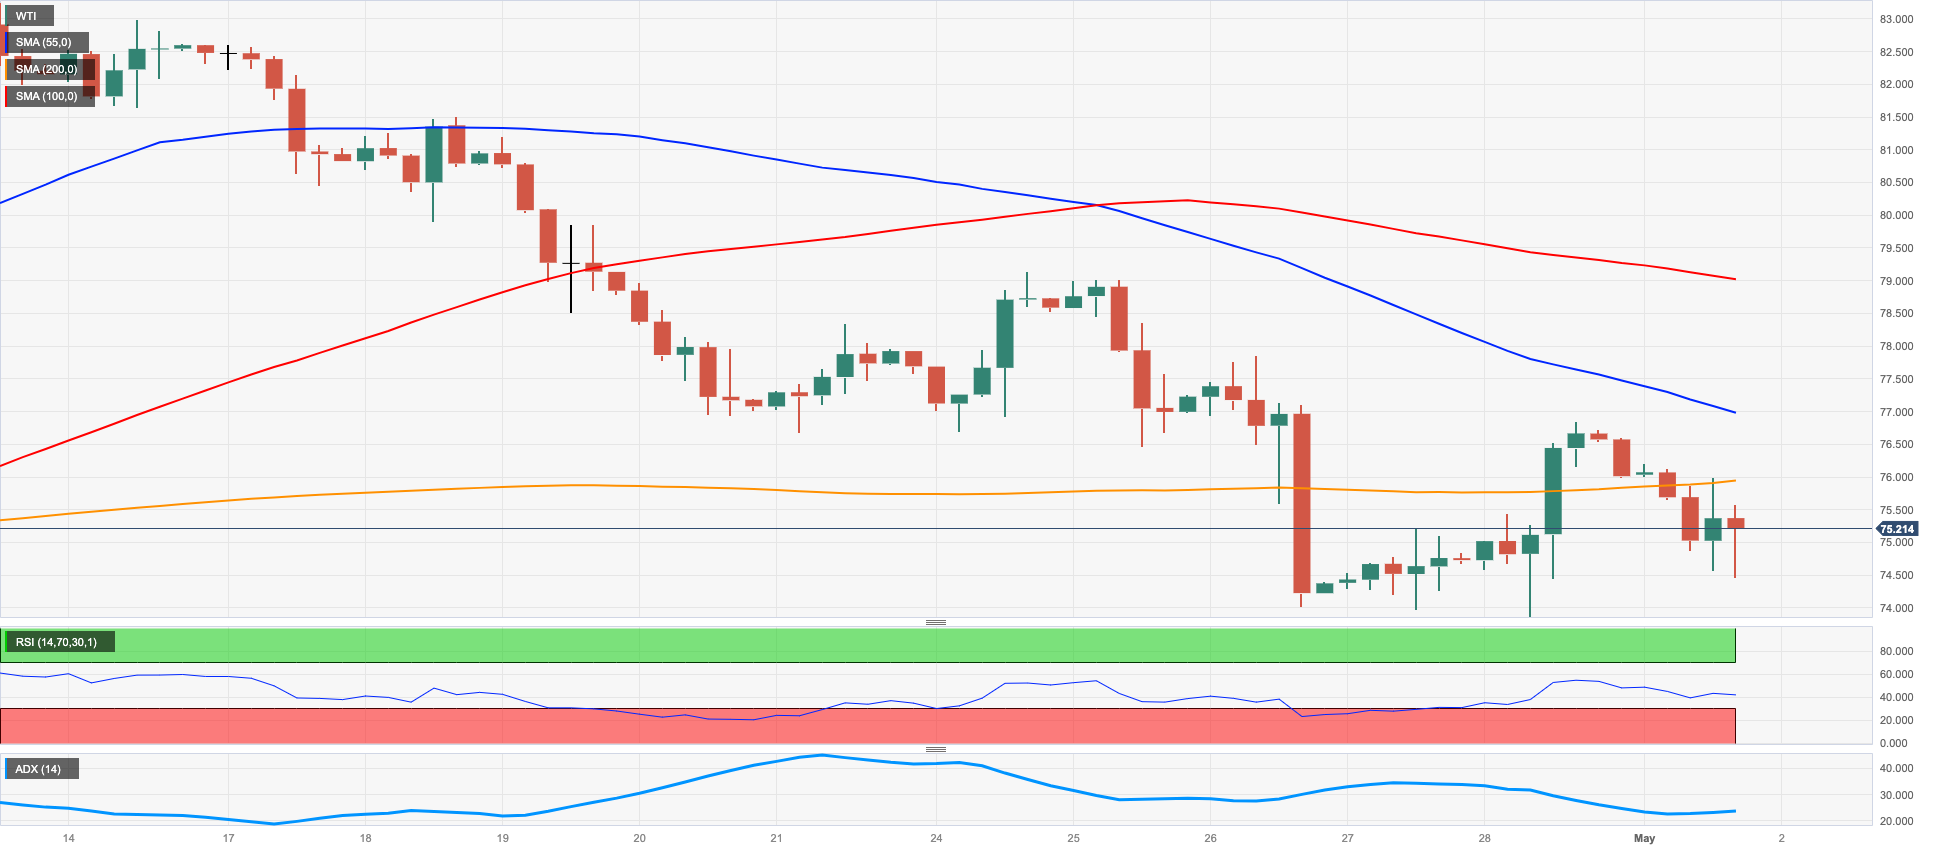
Crude oil started the week on the back foot and forced prices of the WTI to reverse part of the gains made in the second half of last week.
Indeed, almost omnipresent concerns over a probable economic slowdown combined with Chinese weaker-than-expected manufacturing data (released over the weekend) and weighed on traders sentiment in the week that the Federal Reserve is largely predicted to hike rates by another 25 bps (on May 3).
Later in the week, the API and the EIA are expected to report on US crude oil inventories in the week to April 28.
If losses accelerate, then prices of the WTI could put the April low at $73.97 (April 28) to the test ahead of the key $70.00 mark and the $66.86 level (March 24). The loss of this level could allow for a probable visit to the 2023 low at $64.41 (March 20) ahead of the December 2021 low at $62.46 (December 2) and the key $60.00 mark per barrel. On the flip side, the weekly high at $79.14 (April 24) emerges as the immediate hurdle before the key $80.00 mark and the 200-day SMA at $81.80. Once this region is cleared, the WTI could head towards the 2023 peak at $83.49 (April 12) prior to the November 2022 high $93.73 (November 7).
Resistance levels: $76.89 $77.89 $79.14 (4H chart)
Support levels: $73.90 $72.57 $66.79 (4H chart)
GER40
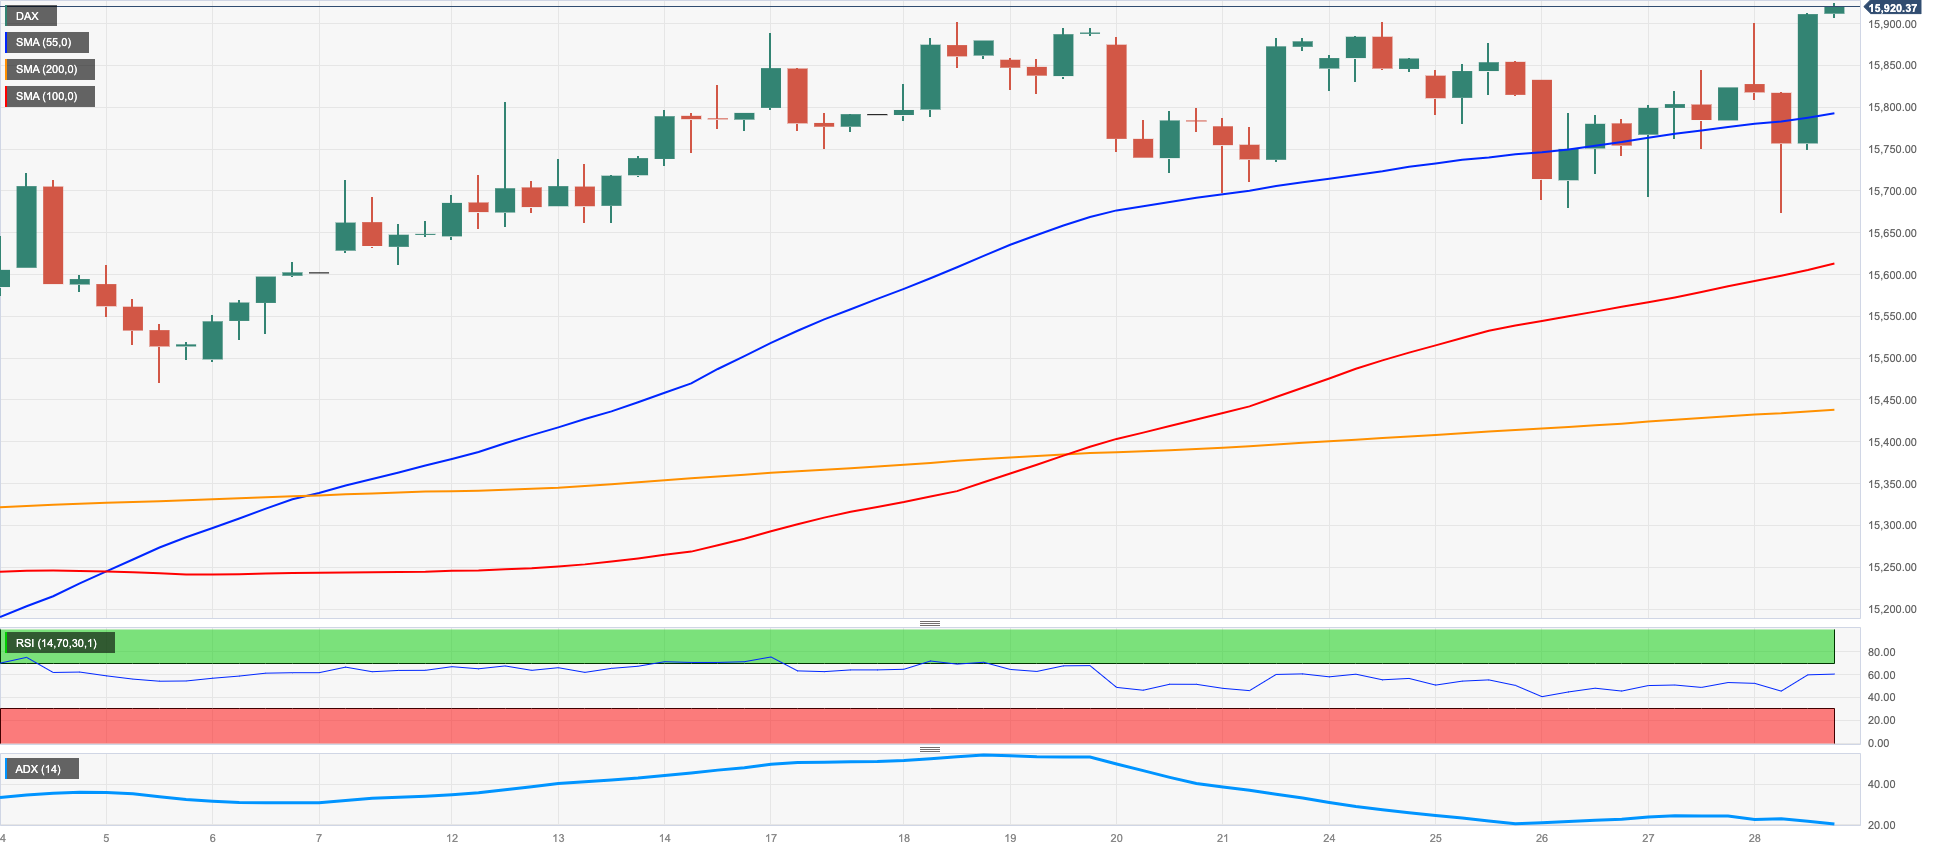
There was no activity in the European markets due to the Labour Day holiday on May 1.
In the meantime, the upside bias in the German benchmark DAX40 appears unchallenged so far despite mounting speculation that the ECB could also raise rates at its meeting in June and July. It is worth noting that a 25 bps rate hike is fully priced in at the May 4 event.
In the very near term, the index could grab some fresh oxygen from mitigated banking concerns in the wake of news citing that giant JP Morgan will acquire the troubled First Republic Bank.
Next of note in the German calendar appears Retail Sales for the month of March and April’s final Manufacturing PMI, both due on May 2.
The DAX40 clinched a new 2023 top at 15922 on April 28. A move beyond this level should rapidly target the round level at 16000 ahead of the 2022 peak at 16285 (January 5). On the contrary, there is an initial support at the April low at 15482 (April 5) seconded by the interim 100-day SMA at 15102 and the minor support at 14809 (March 24). Further down emerges the March low at 14458 (March 20) seconded by the key 200-day SMA at 14191. The daily RSI edged higher and poked with the 63 yardstick.
Best Performers: Covestro, Deutsche Boerse, Hannnover Rueck SE
Worst Performers: Commerzbank, BASF, Deutsche Telekom AG
Resistance levels: 15922 16090 16285 (4H chart)
Support levels: 15688 15482 15422 (4H chart)
NASDAQ
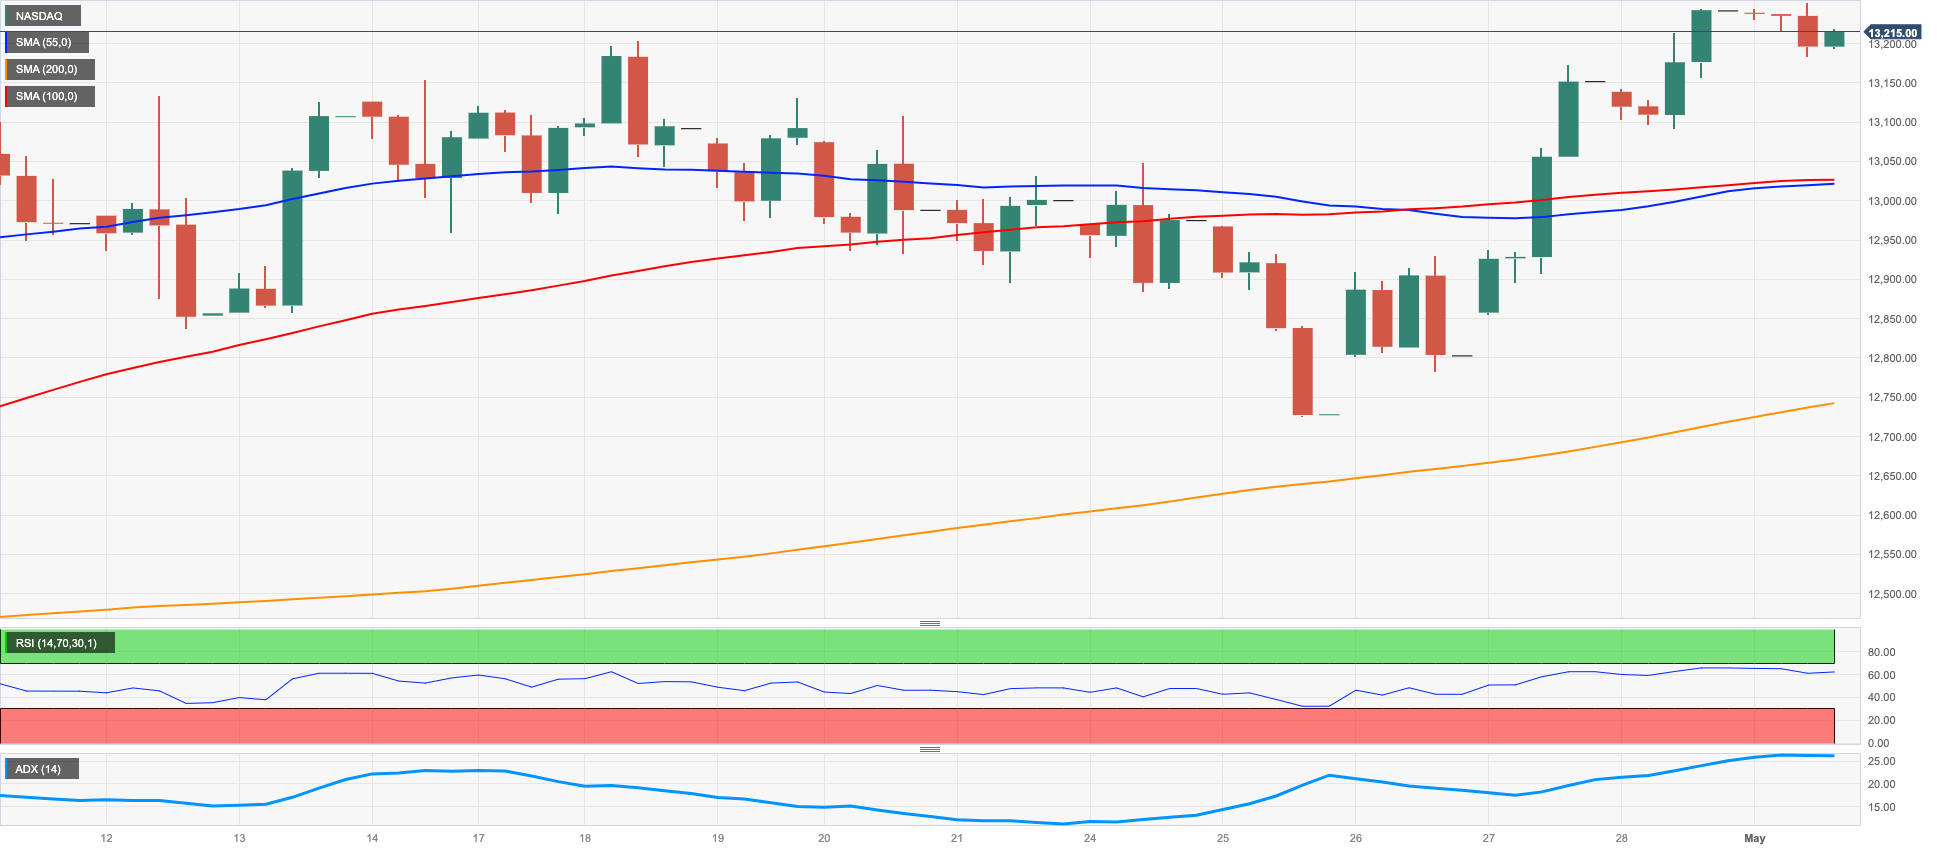
The tech benchmark Nasdaq 100 recorded the fourth consecutive daily advance and rose to levels last seen in August 2022 around 13300 on Monday.
Indeed, alleviated banking concerns following the JP Morgan-First Republic Bank news collaborated with the rising optimism among market participants despite the stronger dollar and rising US yields across the curve, all in response to auspicious data results from the US docket and imminent 25 bps rate raise by the Fed on May 3.
The Nasdaq 100 clocked a new 2023 top at 13280 (May 1). The breakout of this level could pave the way to the continuation of the upside to the August 2022 peak at 13720 (August 16) seconded by the round level at 14000 and the March 2022 high at 15265 (March 29). The other way around, there is a temporary support at the 55-day SMA at 12969 followed by the April low at 12724 (April 25) and the weekly low at 12517 (March 28). Once the latter is cleared, the index could dispute the key 200-day SMA at 12139 before the March low at 11695 (March 13) and weekly lows at 11550 (January 25) and 11251 (January 19). South from here emerges the 2023 low at 10696 (January 6). The daily RSI picked up extra pace and flirted with 63.
Top Gainers: NVIDIA, Microchip, Biogen
Top Losers: Lucid Group, Micron, Amazon.com
Resistance levels: 13280 13720 14277 (4H chart)
Support levels: 12724 12517 12132 (4H chart)
DOW JONES
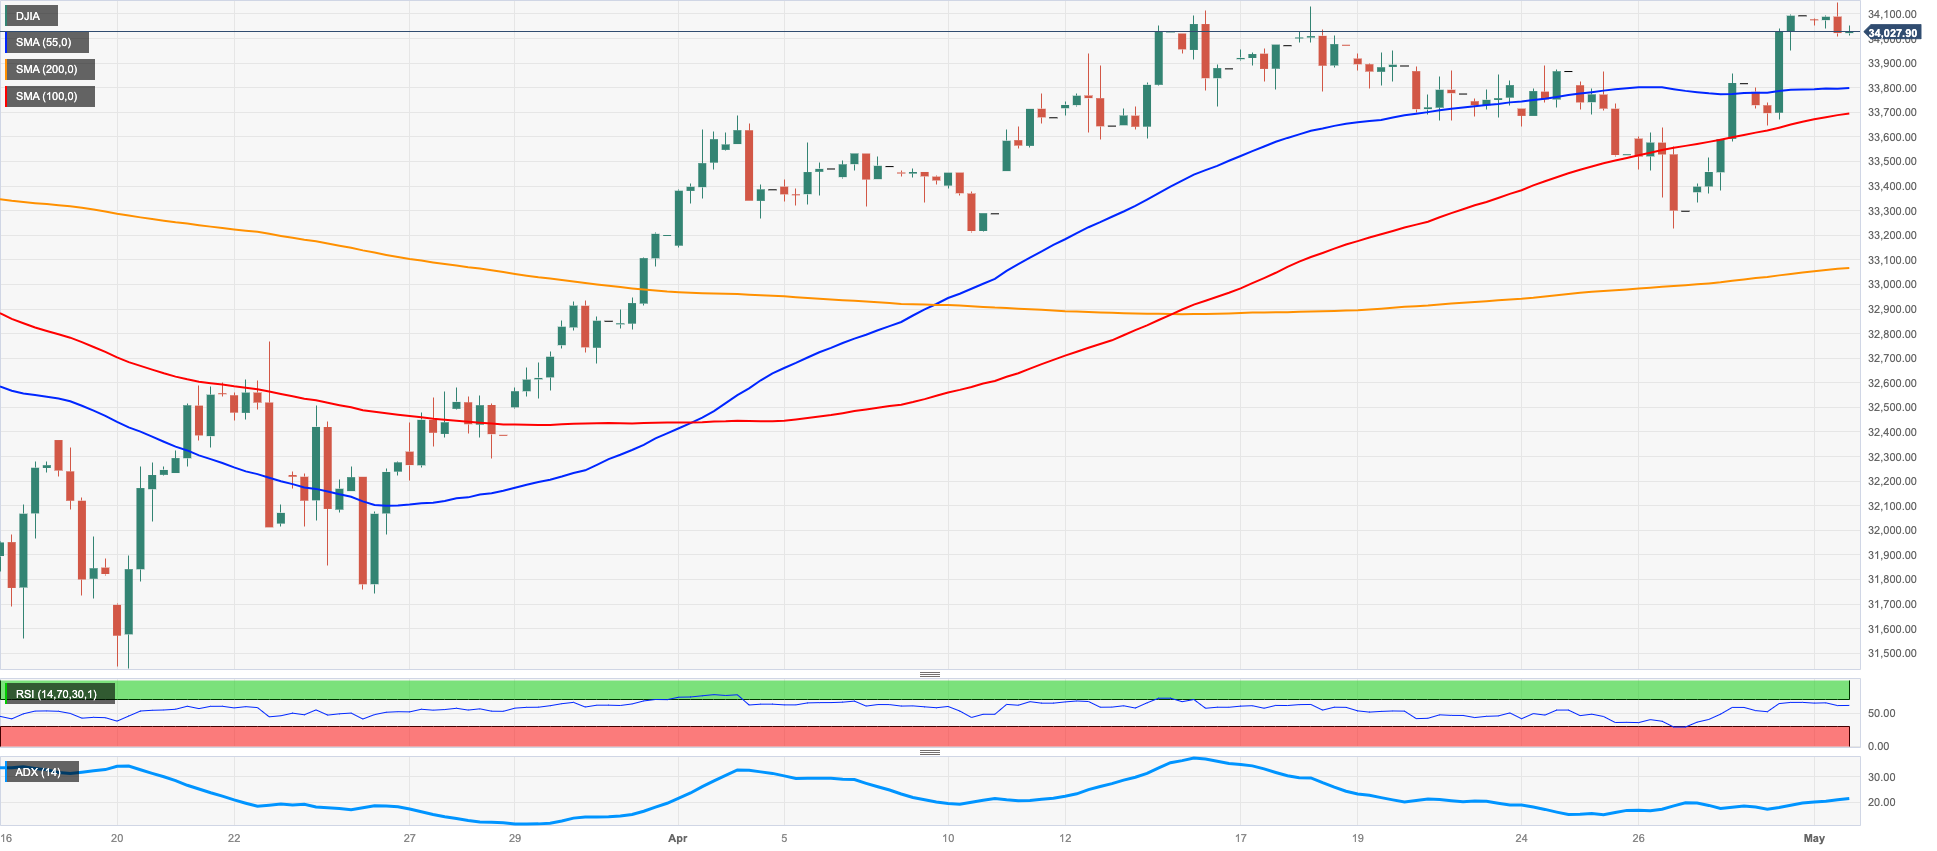
The optimism in the US stock markets remained unchanged at the beginning of the week.
Indeed, the upbeat mood prevailed among investors on Monday after JP Morgan announced it will acquire lender First Republic Bank, a move that helped mitigate fears around the banking system. The Dow Jones moved accordingly and extended the recovery to 3-month highs near 34300.
In the meantime, cautiousness is expected to pick up pace in the next trading hours ahead of the key FOMC event on May 3, where the Fed is predicted to raise the Fed Funds Target Range (FFTR) by 25 bps.
All in all, the Dow Jones advanced 0.16% to 34152, the S&P500 gained 0.23% to 4178 and the tech-reference Nasdaq Composite rose 0.17% to 12247.
Further upside in the Dow Jones should remain focused on the 2023 peak at 34342 (January 13) ahead of the December 2022 high at 34712 (December 13) and before the 35000 mark. Further north, the index could challenge the April 2022 top at 35492 (April 21) prior to the February 2022 peak at 35824 (February 9) and the 36000 yardstick. Just the opposite, immediate contention aligns at the April low at 33235 (April 26), which is closely followed by the temporary 55-day SMA at 33158 and comes prior to the key 200-day SMA at 32678 and the 2023 low at 31429 (March 15). A deeper decline could see the 30000 mark revisited seconded by the 2022 low at 28660 (October 13). The daily RSI advanced north of 62.
Top Performers: JPMorgan, UnitedHealth, Nike
Worst Performers: Intel, Walgreen Boots, Chevron
Resistance levels: 34257 34334 34712 (4H chart)
Support levels: 33235 32678 31805 (4H chart)
MACROECONOMIC EVENTS

All Information & Updates provided by:

All information relating to the financial markets available on this page has been prepared and issued by FXStreet (Forexstreet SL, Spain, Reg: B62498233) on the basis of publicly available information and all information believed to be reliable and does not conflict with Kuwaiti local laws, and all necessary care has been taken to before the company to ensure that the facts mentioned are correct from the source.
NCM Investment nor any of its directors or employees shall in any way be held responsible for the contents of this news, and the information contained on this page is intended only to provide clients with publicly available information and should not be construed as investment advice, report or analysis and/or constitute an offer or invitation to buy or sell financial instruments of any kind.
RISK WARNING: Forex and CFDs are highly risky leveraged products, as losses can exceed deposits. Please ensure you understand all the risks and take independent advice if necessary. NCM will segregate the clients based on the criteria of the regulator and its bylaws. NCM does not provide any advisory service; the material published does not constitute advice or a recommendation for a transaction in any financial instrument. NCM accepts no responsibility for any use of the content presented and any consequences of that use. Anyone acting on the information provided does so at their own risk.