
- Contact Us:
-

-

-

-


Daily Market Updates
03 May 2023
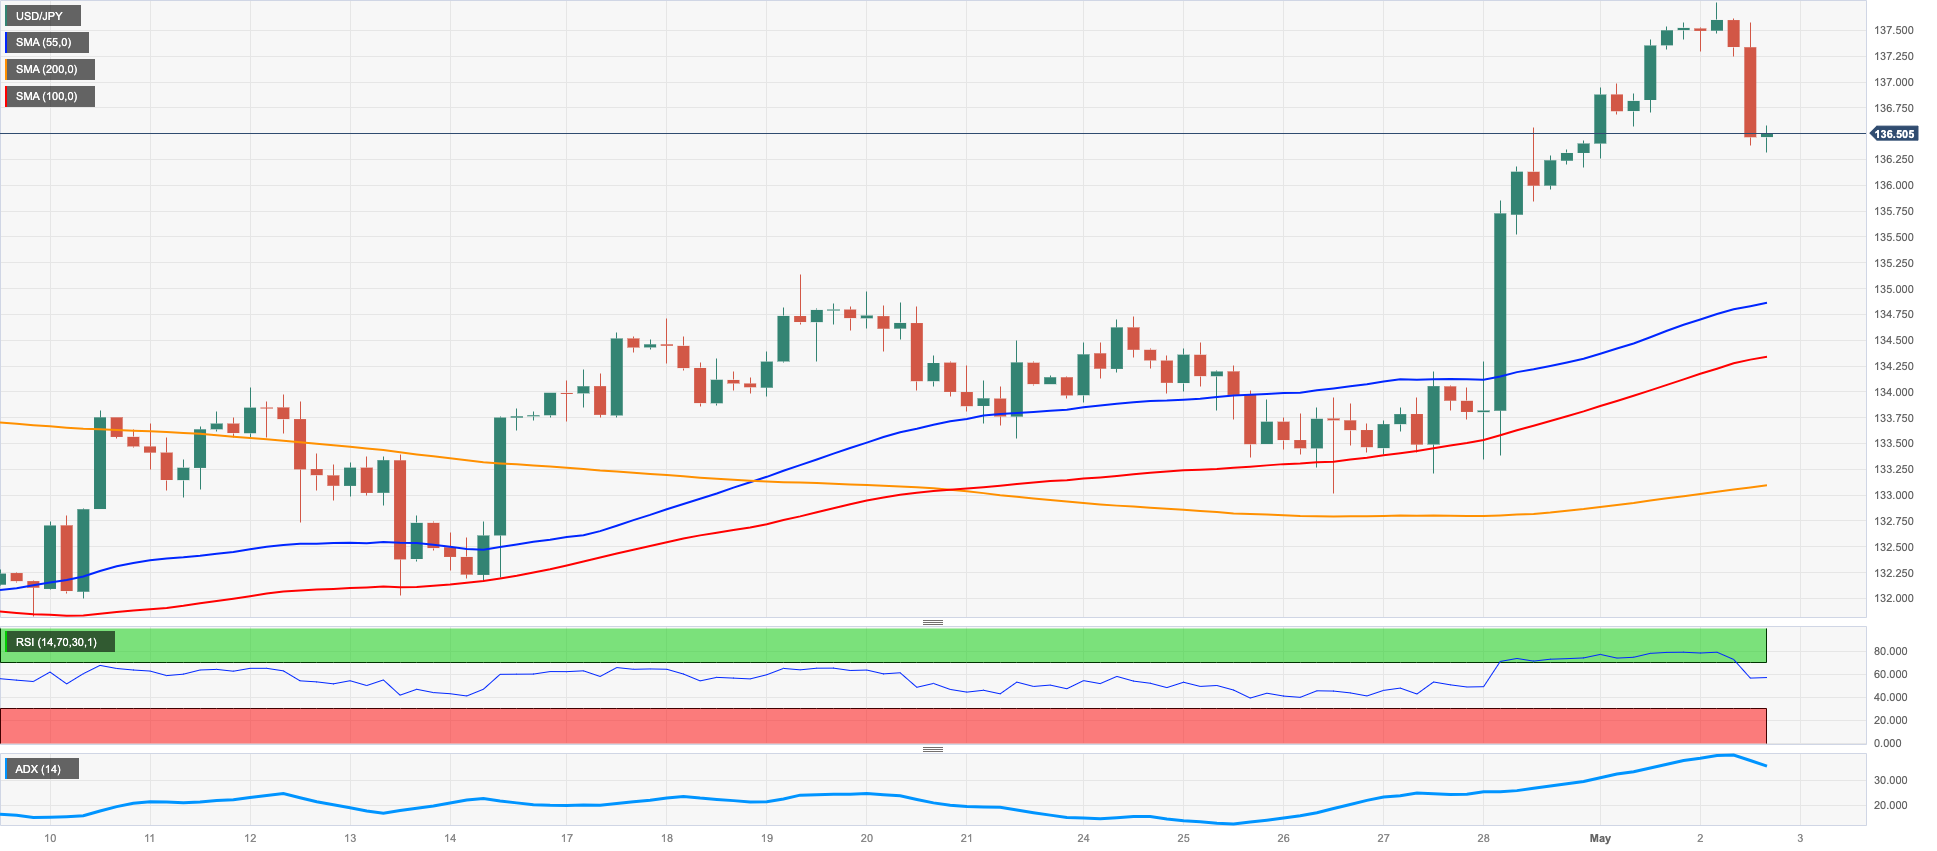
USDJPY
After an early climb to new 2-month tops in the 137.75/80 band, USD/JPY came under some strong downside pressure pari passu with renewed weakness in the greenback and the intense corrective decline in US yields.
On the latter, yields faded the promising start of the week against the backdrop of steady cautiousness ahead of the key FOMC event on May 3 and the most likely 25 bps rate hike by the central bank.
In the Japanese money market, the JGB 10-year yields added to Monday’s uptick past the 0.42% level.
Furthermore, investors continued to sell the safe haven yen as they kept digesting last week’s unchanged stance from the BoJ at its gathering on April 28. On this, it is worth noting that speculation seems to have kicked in around a probable (hawkish?) tweak by the central bank at its event in June.
There were no data releases in the Japanese calendar on Tuesday.
USD/JPY clocked a new May top at 137.77 (May 2). Just beyond this level emerges the 2023 peak at 137.91 (March 8) prior to weekly peaks at 139.89 (November 30 2022) and 142.25 (November 21 2022). By contrast, the loss of the key 200-day SMA at 136.98 could open the door to a deeper drop to the weekly low at 133.01 (April 26) just ahead of the interim 100-day SMA at 132.88 and the minor level at 132.01 (April 13). South from here aligns the April low at 130.62 (April 5) seconded by the March low at 129.63 (March 24) and the February low at 128.08 (February 2). Down from here comes the 2023 low at 127.21 (January 16). The daily RSI dropped to the 63 zone.
Resistance levels: 137.77 137.91 138.17 (4H chart)
Support levels: 133.01 132.01 130.62 (4H chart)
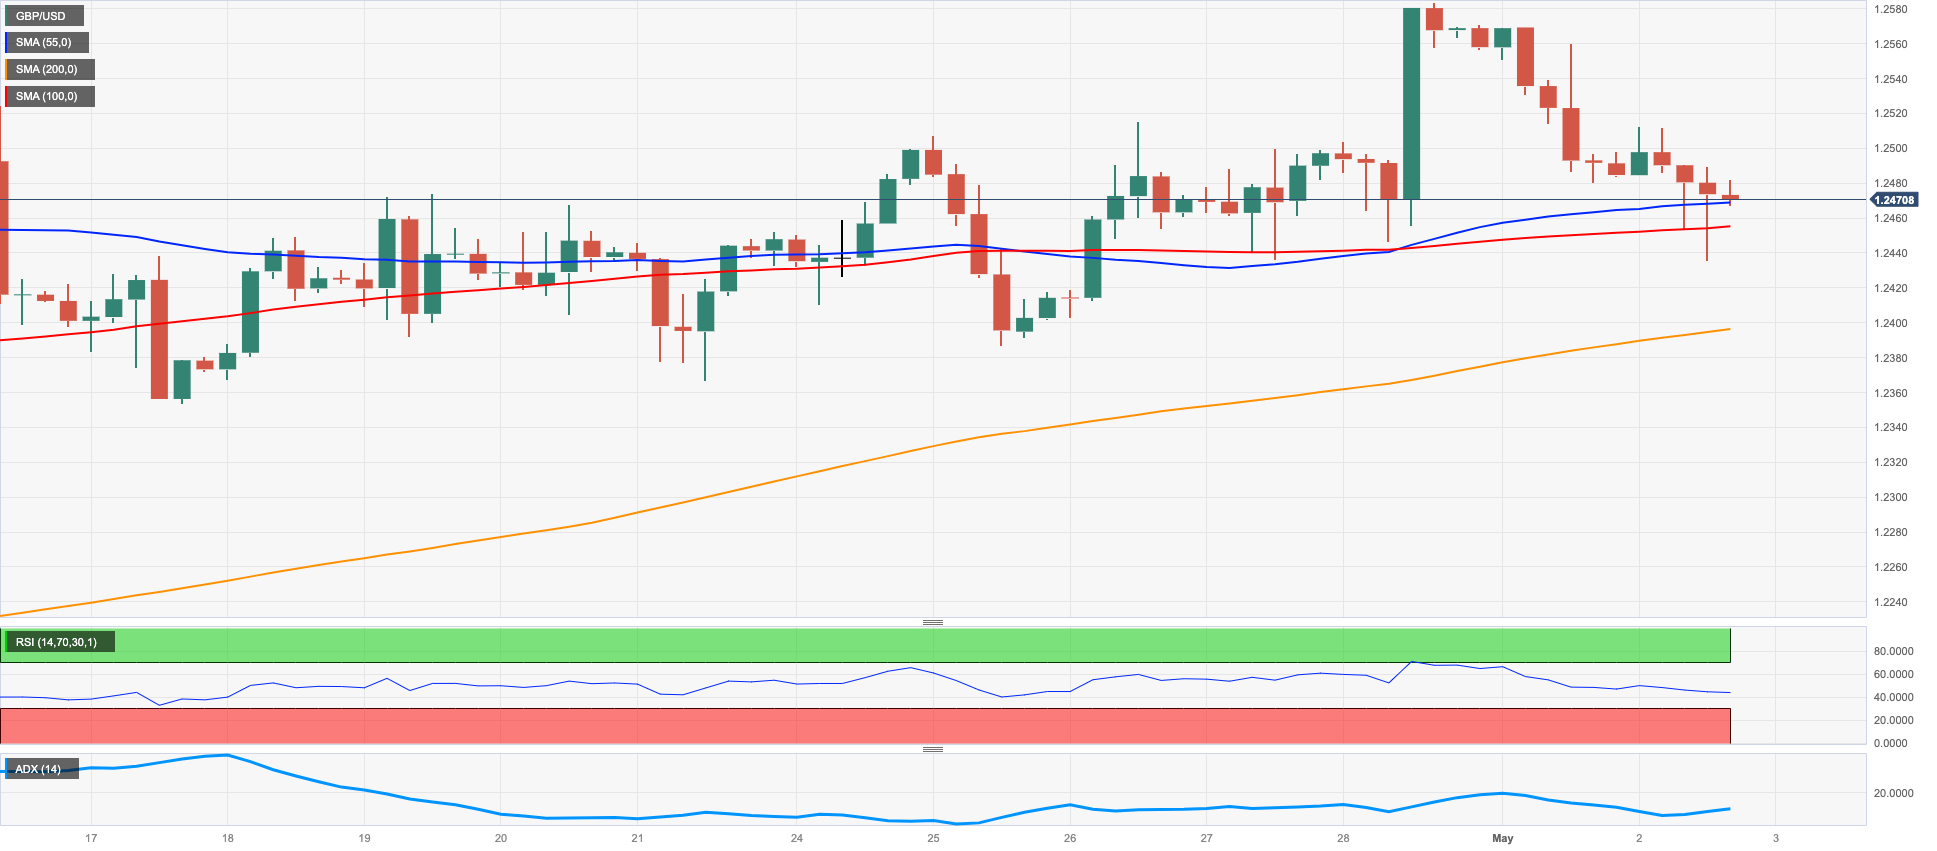
GBPUSD
The late knee-jerk in the greenback did not prevent GBP/USD to add to Monday’s losses and revisit the 1.2440/35 band on Tuesday.
Indeed, Cable lost further ground despite the decline in the USD Index (DXY), which came once again in tandem with a sharp move lower in US yields across the curve, as the Fed’s decision on interest rates loomed on the horizon. On this, investors largely price in a 25 bps rate hike on May 3, while the door remains open to a potential impasse in the tightening stance following the May event.
In the UK, the final Manufacturing PMI came at 46.6 for the month of April.
The recent recovery in GBP/USD now appears somewhat dented. Against that, Cable faces the immediate support at the weekly low at 1.2344 (April 10) prior to the April low at 1.2274 (April 3) and the provisional 55-day SMA at 1.2245. The loss of this region exposes a potential drop to the key 200-day SMA at 1.1941 before the 2023 low at 1.1802 (March 8). On the opposite side, bulls remain focused on the 2023 top at 1.2583 (April 28) ahead of the May 2022 peak at 1.2666 (May 27) and the 200-week SMA at 1.2865, all before the psychological 1.3000 hurdle. The daily RSI deflated to the proximity of 55.
Resistance levels: 1.2583 1.2599 1.2666 (4H chart)
Support levels: 1.2435 1.2382 1.2364 (4H chart)
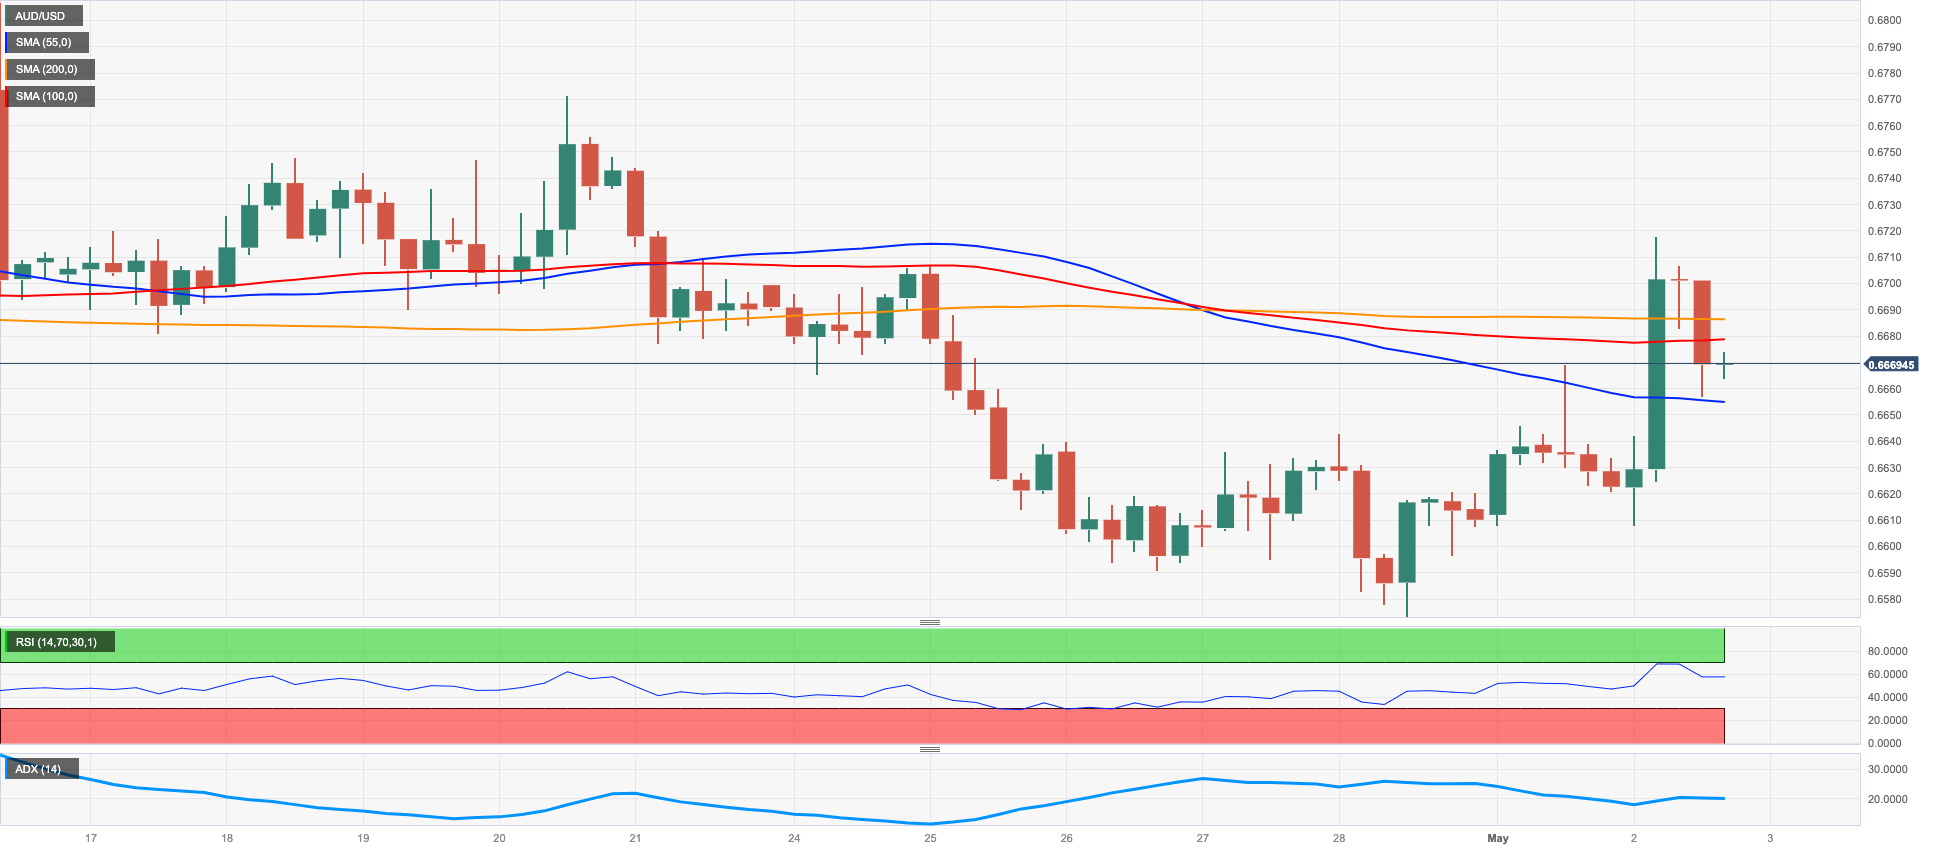
AUDUSD
AUD/USD briefly reclaimed the area beyond 0.6700 the figure to print new multi-session peaks on turnaround Tuesday.
Indeed, the Aussie dollar added to the auspicious start of the week and trespassed the 0.6700 barrier after the RBA caught markets off-guard and hiked the Official Cash Rate (OCR) by 25 bps.
On the latter, the RBA raised the OCR by 25 bps to 3.85% at its meeting on Tuesday. The central bank justified its decision to hike rates in the still elevated inflation (around 7%) and the view that consumer prices will remain in high levels for longer. Furthermore, the RBA sees the CPI around 4% in 2023 and near 3% by mid-2025, while it acknowledged that the labour market remains extremely tight and with the unemployment hovering around multi-decade lows.
Still around the RBA, Governor P. Lowe stressed that there was a strong consensus to hike rates and added that the idea of Australia avoiding recession is quite reasonable. He suggested that bringing inflation down much faster would cost too many jobs.
Further upside in AUD/USD now retargets the key 200-day SMA at 0.6732 ahead of the weekly high at 0.6771 (April 20) and the April top at 0.6805 (April 14). North from here aligns the key round level at 0.7000 seconded by the weekly peak at 0.7029 (February 14) and the 2023 high at 0.7157 (February 2). To the contrary, immediate contention emerges at the April low at 0.6573 (April 28) prior to the 2023 low at 0.6563 (March 10) and the weekly low at 0.6386 (November 10 2022), all before the November 2022 low at 0.6272 (November 3). The daily RSI picked up pace and approached the 49 yardstick.
Resistance levels: 0.6717 0.6771 0.6805 (4H chart)
Support levels: 0.6573 0.6563 0.6386 (4H chart)
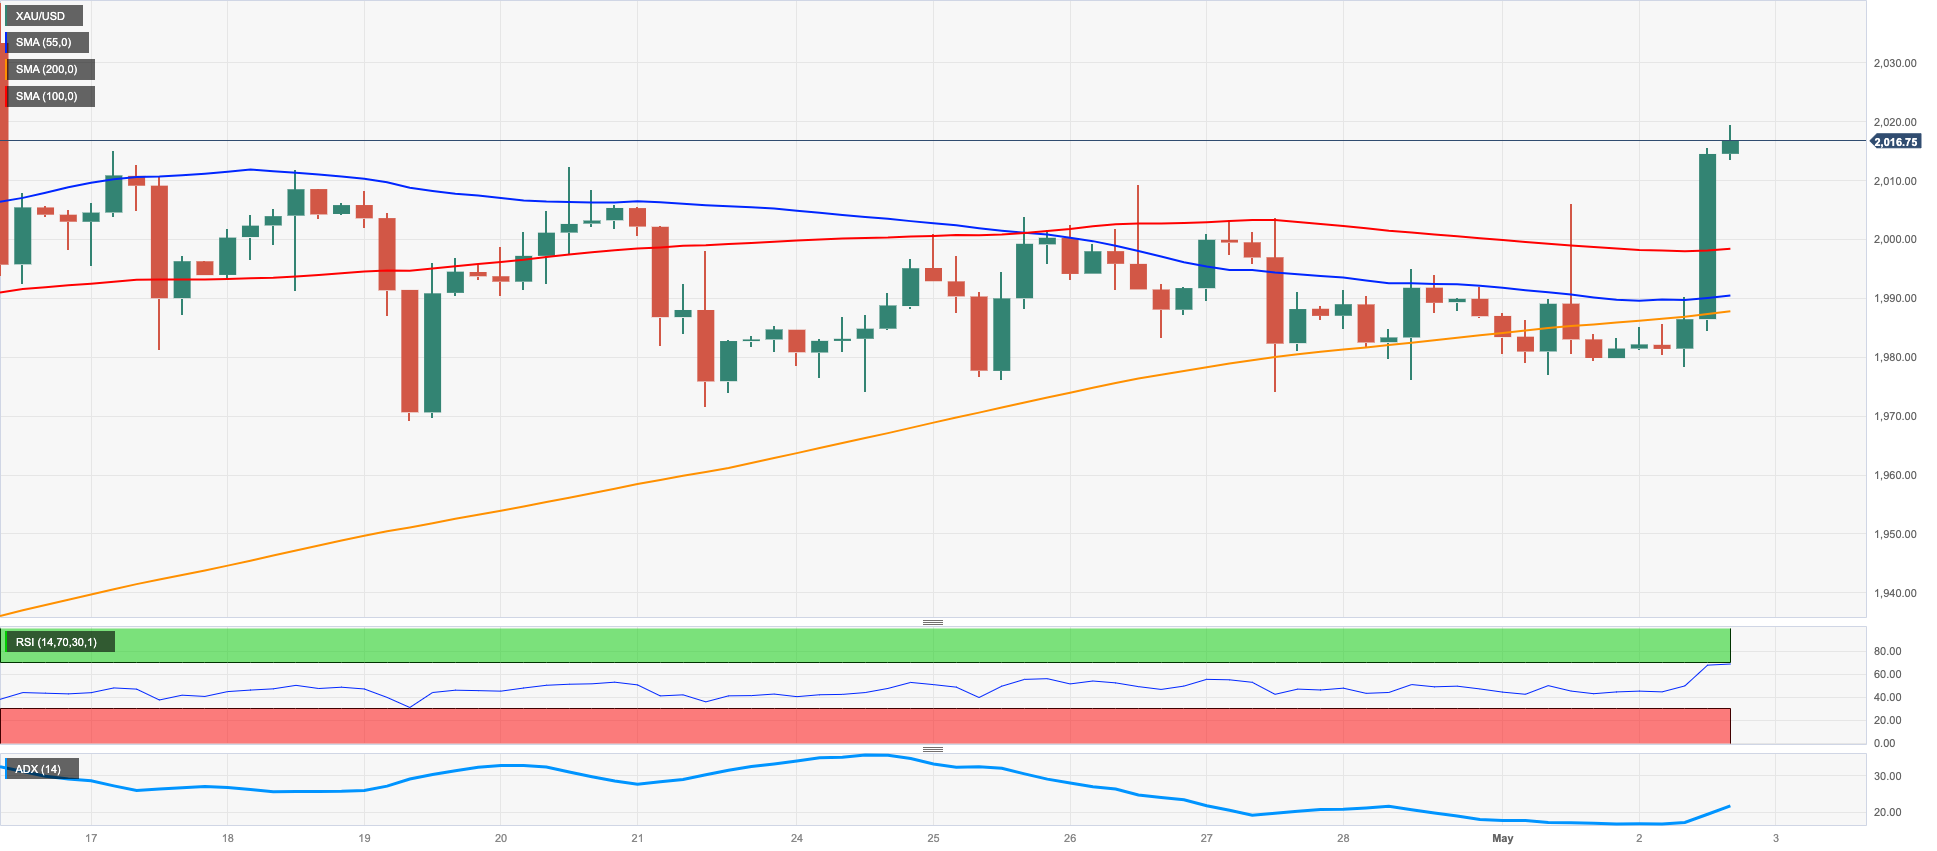
GOLD
Gold prices attempted to break above the multi-session choppiness and managed to surpass the key $2000 per ounce troy on Tuesday.
The strong uptick in the precious metal came against the backdrop of a volatile price action around the greenback and diminishing US yields across the curve ahead of the expected 25 bps rate hike by the Federal Reserve and the ECB on Wednesday and Thursday, respectively.
Investors, in the meantime, are expected to closely follow any hint regarding the potential next moves by the Fed when it comes to the rate path, either from the Committee’s statement or the subsequent press conference by Chief Powell on Wednesday.
Bouts of strength in gold are seen facing immediate resistance at the 2023 high at $2048 (April 13) before the 2022 top at $2070 (March 8) and the all-time peak at $2075 (August 7 2020). On the other hand, the breach of the weekly low at $1969 (April 19) could motivate the April low at $1949 (April 3) to re-emerge on the horizon ahead of temporary support levels at the 55- and 100-day SMAs at $1930 and $1900, respectively. Below this region, the yellow metal could revisit the March low at $1809 (March 8) before the 2023 low at $1804 (February 28).
Resistance levels: $2019 $2048 $2070 (4H chart)
Support levels: $1969 $1949 $1934 (4H chart)
CRUDE WTI
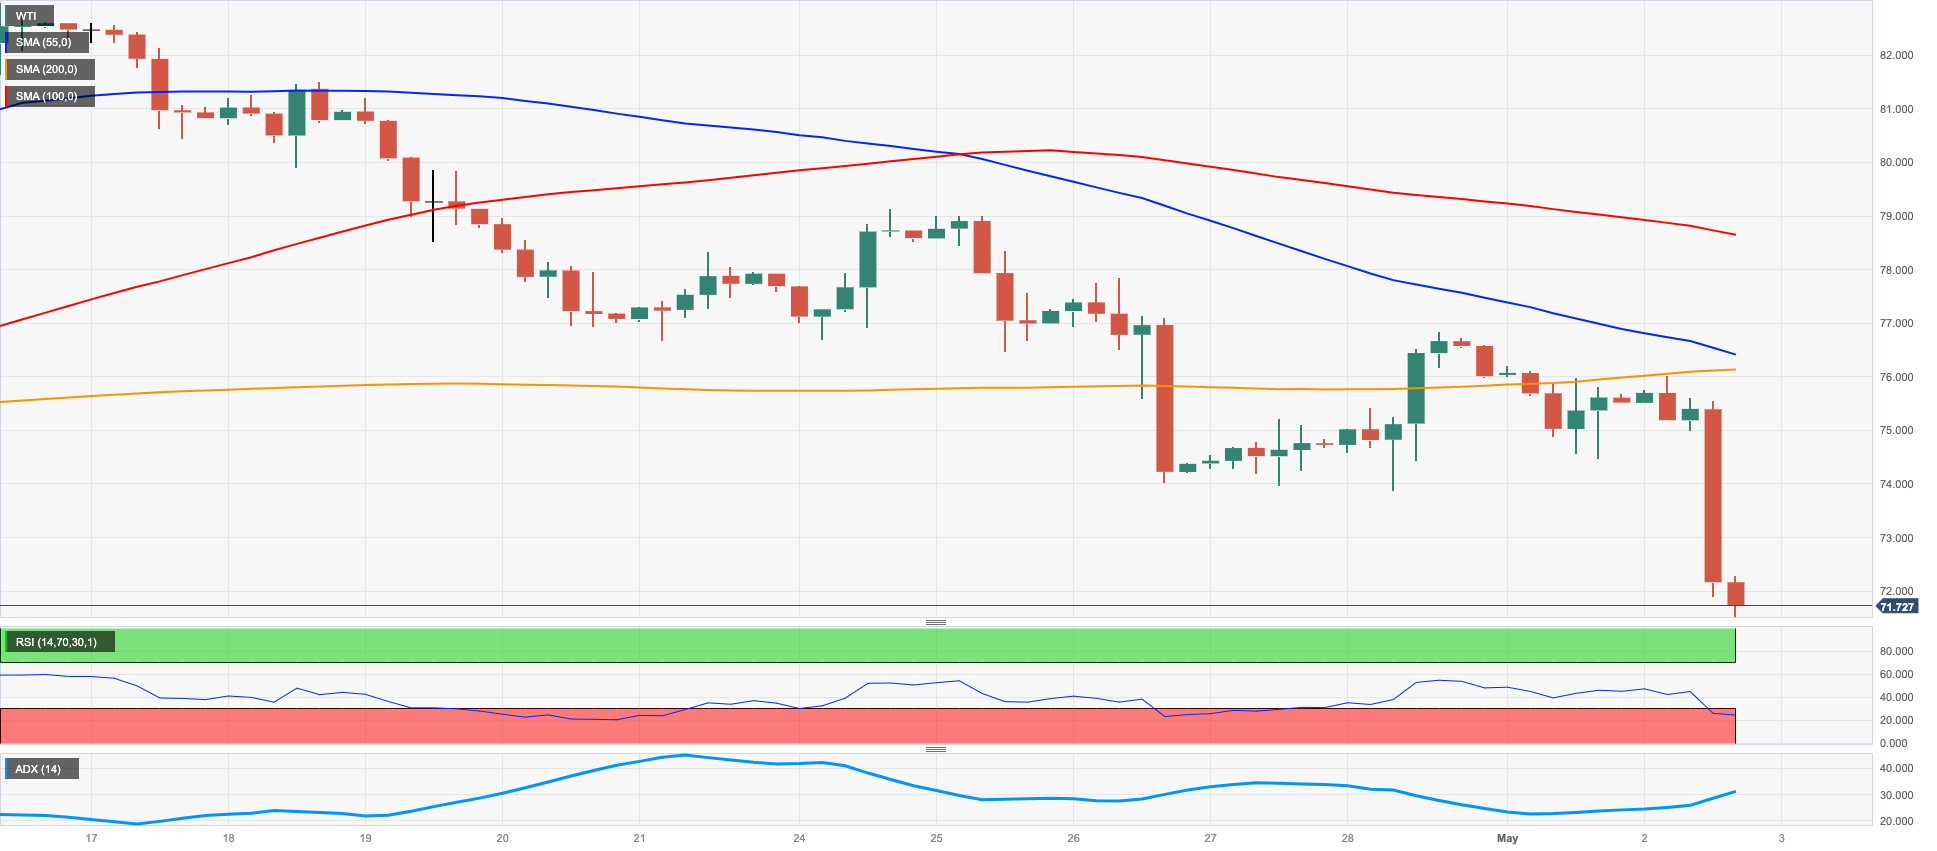
Prices of the barrel of the American benchmark for the sweet light crude oil collapsed to multi-week lows in the area below the $72.00 mark on turnaround Tuesday.
In fact, the WTI quickly left behind Monday’s auspicious start of the week and regained intense downside traction in tandem with unabated concerns surrounding a potential central banks-led deceleration in the economic activity, while disheartening results from the Chinese docket released over the weekend added to the already sour mood among traders’
Later in the session, the API will report on US crude oil inventories in the week to April 28 ahead of Wednesday’s EIA report.
WTI printed a new May low at $71.64 (May 2). If the commodity breaks below this level, it could then put a probable visit to the key $70.00 mark back on the radar prior to the $66.86 level (March 24) and the 2023 low at $64.41 (March 20). The breakdown of the latter could leave the commodity vulnerable to a drop to the December 2021 low at $62.46 (December 2) ahead of the key $60.00 mark per barrel. In opposition, the immediate obstacle for bulls remain at the weekly top at $79.14 (April 24) just before the key $80.00 mark and seconded by the 200-day SMA at $81.92. Beyond this region appears the 2023 high at $83.49 (April 12) seconded by the November 2022 top $93.73 (November 7).
Resistance levels: $76.89 $77.89 $79.14 (4H chart)
Support levels: $71.64 $66.79 $64.33 (4H chart)
GER40
European markets started the trading week well on the defensive following the Labour Day holiday on Monday.
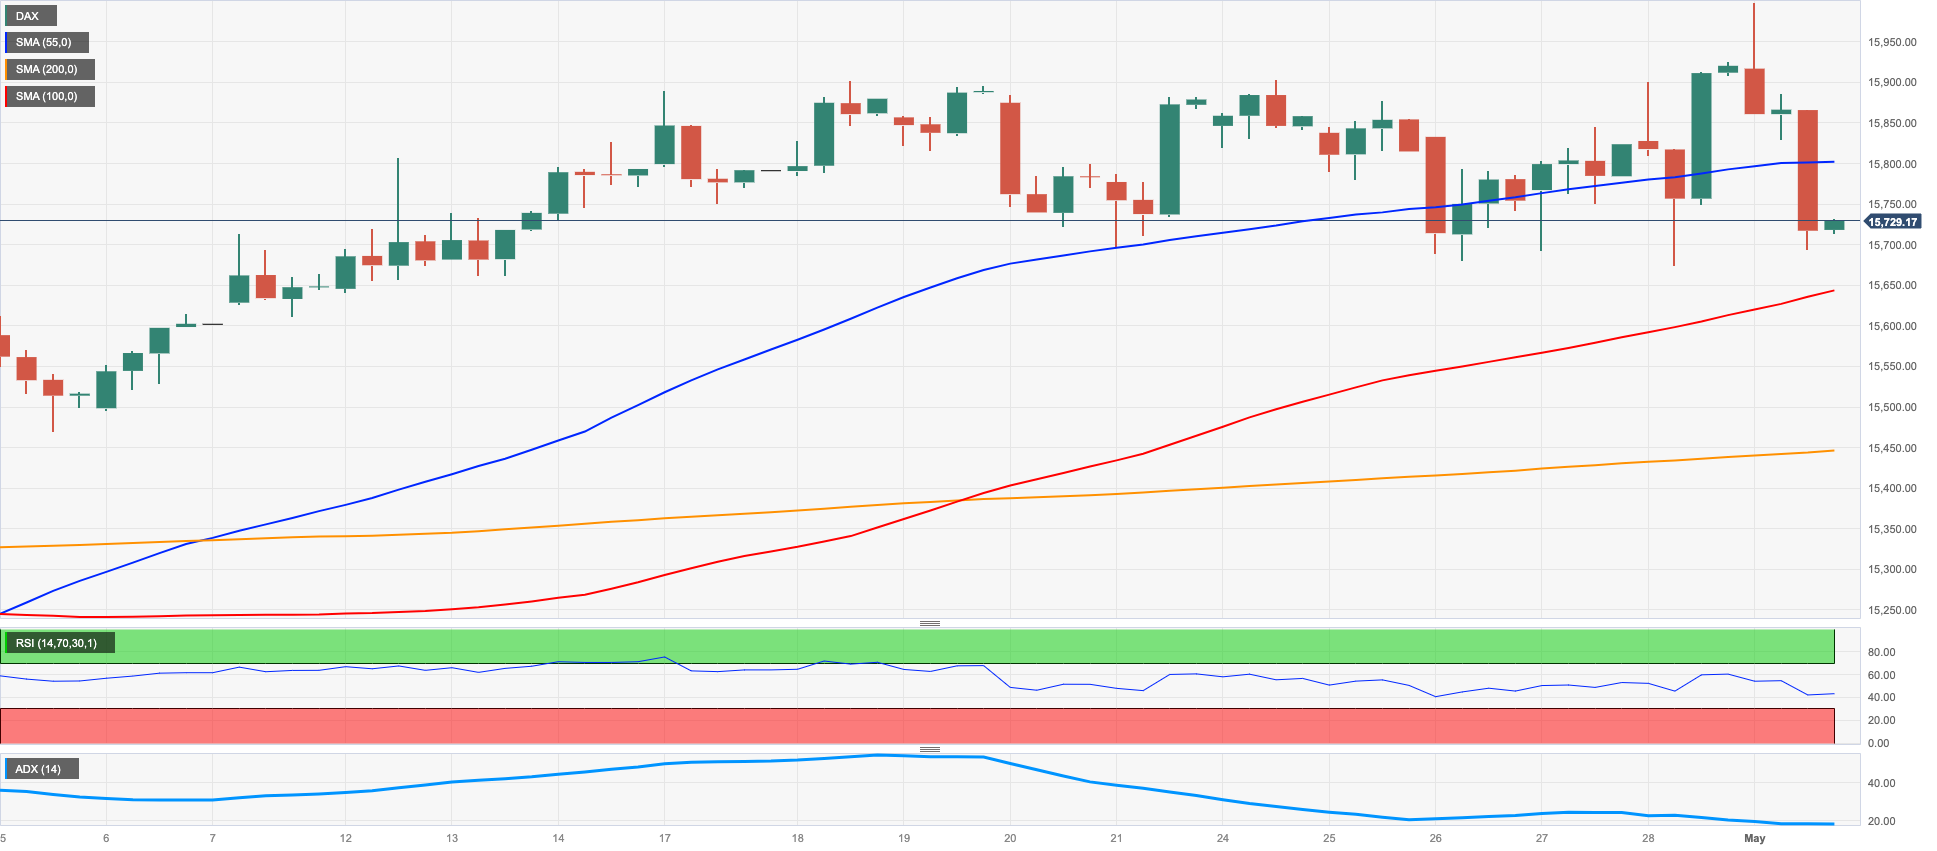
The German reference DAX40 dropped the most since mid-March (-1.23%) and revisited the 15700 region following an earlier move to new 2023 peaks just past the key 16000 barrier on Tuesday.
Indeed, recession concerns were reignited following softer-than-expected results from the US calendar, while earlier final Manufacturing PMIs in both Germany (44.5) and the broader euro bloc (45.8) confirmed the loss of momentum in the sector.
In addition, flash inflation figures in the euro area showed mixed results after the headline CPI ticked a tad higher to 7% YoY in April, while the Core print eased to 5.6% YoY (the first drop in 10 months). These prints could motivate the ECB to lean towards a small rate hike (25 bps?) at the Thursday’s event.
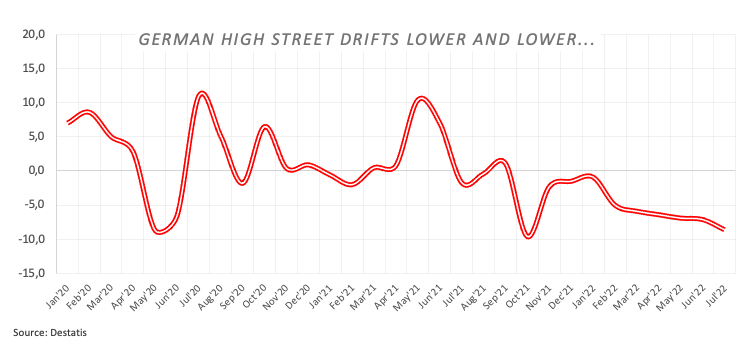
Additional data releases in Germany showed Retail Sales contracting 8.6% in March vs. the same month of 2022.
In the meantime, the German 10-year Bund yields followed their US peers and erodd initial gains to end the session in multi-week lows near 2.25%.
The breakout of the 2023 peak at 16011 (May 2) could encourage the DAX40 to dispute the 2022 high at 16285 (January 5). Just the opposite, the April low at 15482 (April 5) appears underpinned by the temporary 55-day SMA at 15471 ahead of the interim 100-day SMA at 15118. A move lower could prompt a test of the minor support at 14809 (March 24) to re-emerge on the horizon seconded by the March low at 14458 (March 20) and the key 200-day SMA at 14204. The daily RSI receded to the proximity of 59.
Best Performers: Infineon, Siemens Energy AG, Beiersdorf AG
Worst Performers: Vonovia, Covestro, Bayer
Resistance levels: 16011 16090 16285 (4H chart)
Support levels: 15688 15482 15430 (4H chart)
NASDAQ
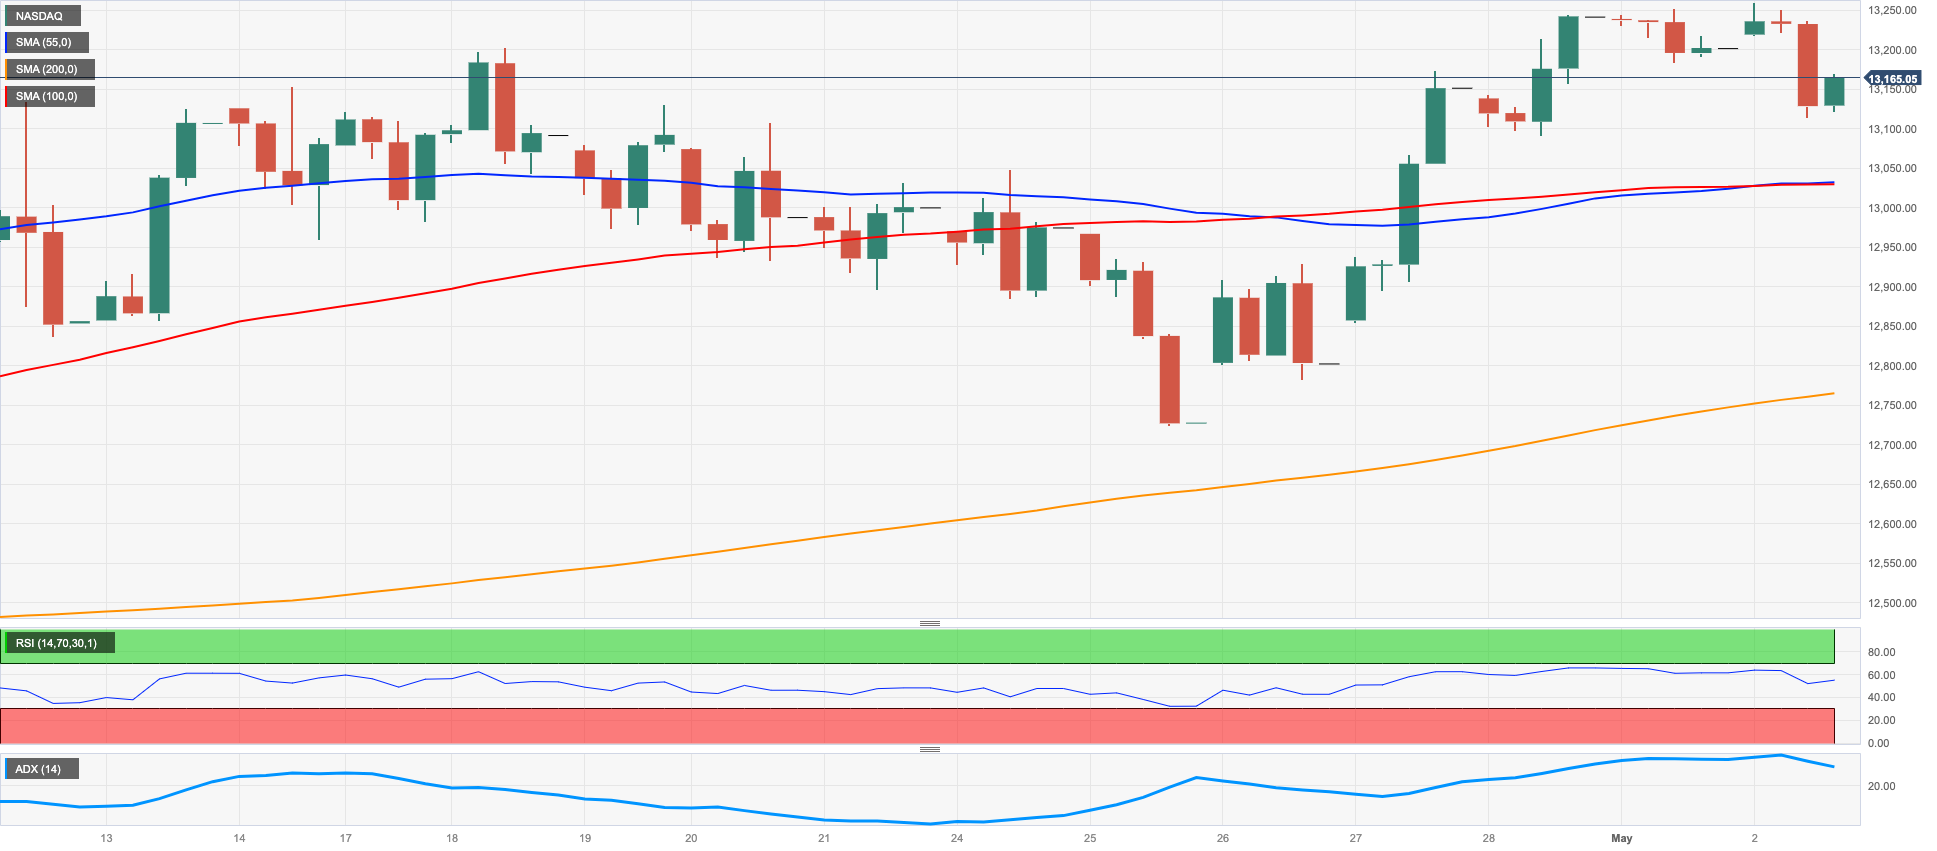
In line with the generalized downbeat mood in the US markets, tech equities gauged by the Nasdaq 100 slipped back to the proximity of the 13000 mark on Tuesday.
Recession concerns coupled with renewed debt ceiling woes dragged techs equities to 3-day lows despite the selling bias in the greenback and the marked retracement in US yields across the curve.
In the meantime, investors are expected to closely follow the post-FOMC press conference by Chief Powell, when he might shed further light on the potential next moves by the Fed regarding its rate path.
Despite the knee-jerk, the Nasdaq 100 continues to point to further upside. That said, the immediate up-barrier emerges at the 2023 peak at 13287 (May 1) ahead of the August 2022 high at 13720 (August 16) and the round level at 14000. North from here emerges the March 2022 top at 15265 (March 29). On the contrary, the April low at 12724 (April 25) is expected to hold the initial downside test before the provisional 55-day SMA at 12632 and the weekly low at 12517 (March 28). If the index clears this level, it could then put the key 200-day SMA at 12067 to the test prior to the March low at 11695 (March 13) and weekly lows at 11550 (January 25) and 11251 (January 19), all ahead of the 2023 low at 10696 (January 6). The daily RSI drifted lower to the vicinity of the 56 yardstick.
Top Gainers: Marriot Int, NXP, Vertex
Top Losers: PDD Holdings DRC, IDEXX Labs, Baker Hughes
Resistance levels: 13287 13720 14277 (4H chart)
Support levels: 12724 12517 12148 (4H chart)
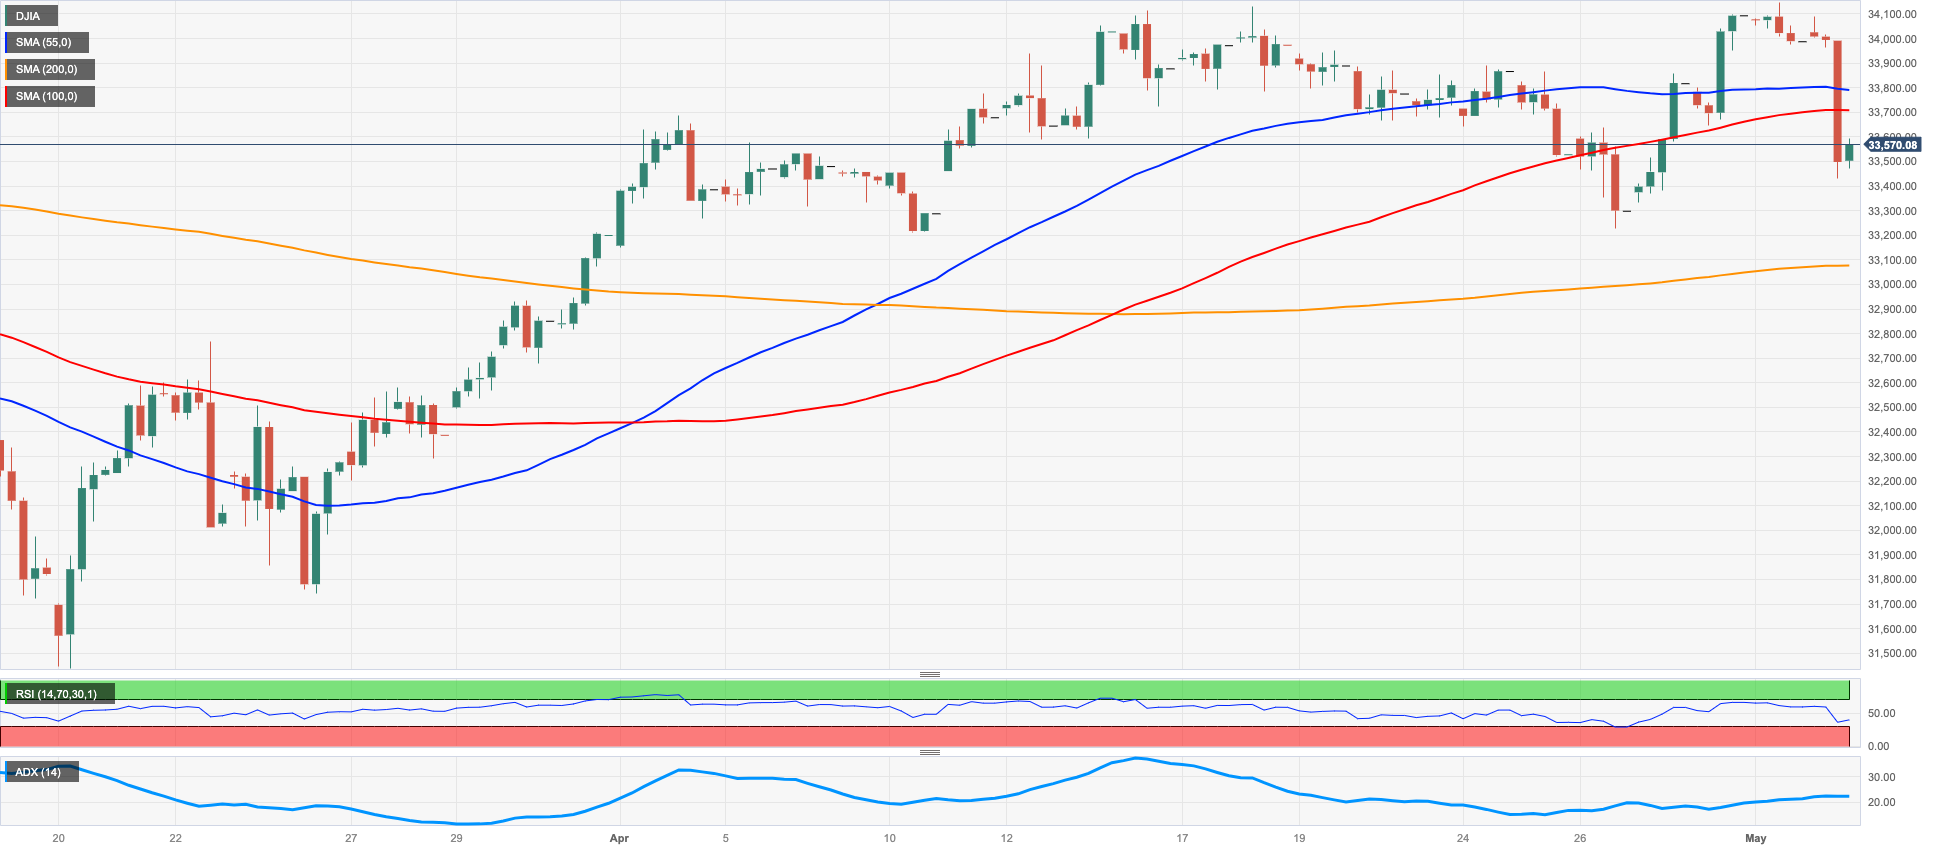
DOW JONES
US equities tracked by the Dow Jones plummeted to three day lows on Tuesday and added to Monday’s negative start of the new trading week.
Weaker-than-expected manufacturing and jobs data added to persistent recession concerns and weighed heavily on investors’ sentiment, while market participants expect the Federal Reserve to hike rates by 25 bps on Wednesday.
Collaborating with the downbeat mood also emerged fresh debt ceiling fears after Treasury Secretary J. Yellen argued that the government risks default in early June.
On the whole, the Dow Jones retreated 1.44% to 33561, the S&P500 dropped 1.47% to 4106 and the tech-benchmark Nasdaq Composite deflated 1.21% to 12064.
If the selling pressure gathers fresh impulse, the Dow Jones could test the interim 100-day SMA at 33348 ahead of the April low at 33235 (April 26), which is somewhat bolstered by the provisional 55-day SMA at 33151. Further south appears the key 200-day SMA at 32691 prior to the 2023 low at 31429 (March 15) and the 2022 low at 28660 (October 13). On the flip side, the initial hurdle emerges at the May peak at 34257 (May 1), which is closely followed by the 2023 high at 34342 (January 13) and the December 2022 top at 34712 (December 13). The surpass of the latter could open the door to the April 2022 peak at 35492 (April 21) seconded by the February 2022 high at 35824 (February 9) and the 36000 mark. The daily RSI deflated below the 51 region.
Top Performers: J&J, Merck&Co, McDonalds’s
Worst Performers: Chevron, American Express, Walgreen Boots
Resistance levels: 34257 34334 34712 (4H chart)
Support levels: 33341 33235 31805 (4H chart)
MACROECONOMIC EVENTS

All Information & Updates provided by:

All information relating to the financial markets available on this page has been prepared and issued by FXStreet (Forexstreet SL, Spain, Reg: B62498233) on the basis of publicly available information and all information believed to be reliable and does not conflict with Kuwaiti local laws, and all necessary care has been taken to before the company to ensure that the facts mentioned are correct from the source.
NCM Investment nor any of its directors or employees shall in any way be held responsible for the contents of this news, and the information contained on this page is intended only to provide clients with publicly available information and should not be construed as investment advice, report or analysis and/or constitute an offer or invitation to buy or sell financial instruments of any kind.
RISK WARNING: Forex and CFDs are highly risky leveraged products, as losses can exceed deposits. Please ensure you understand all the risks and take independent advice if necessary. NCM will segregate the clients based on the criteria of the regulator and its bylaws. NCM does not provide any advisory service; the material published does not constitute advice or a recommendation for a transaction in any financial instrument. NCM accepts no responsibility for any use of the content presented and any consequences of that use. Anyone acting on the information provided does so at their own risk.