
- Contact Us:
-

-

-

-


Daily Market Updates
04 May 2023
USDJPY
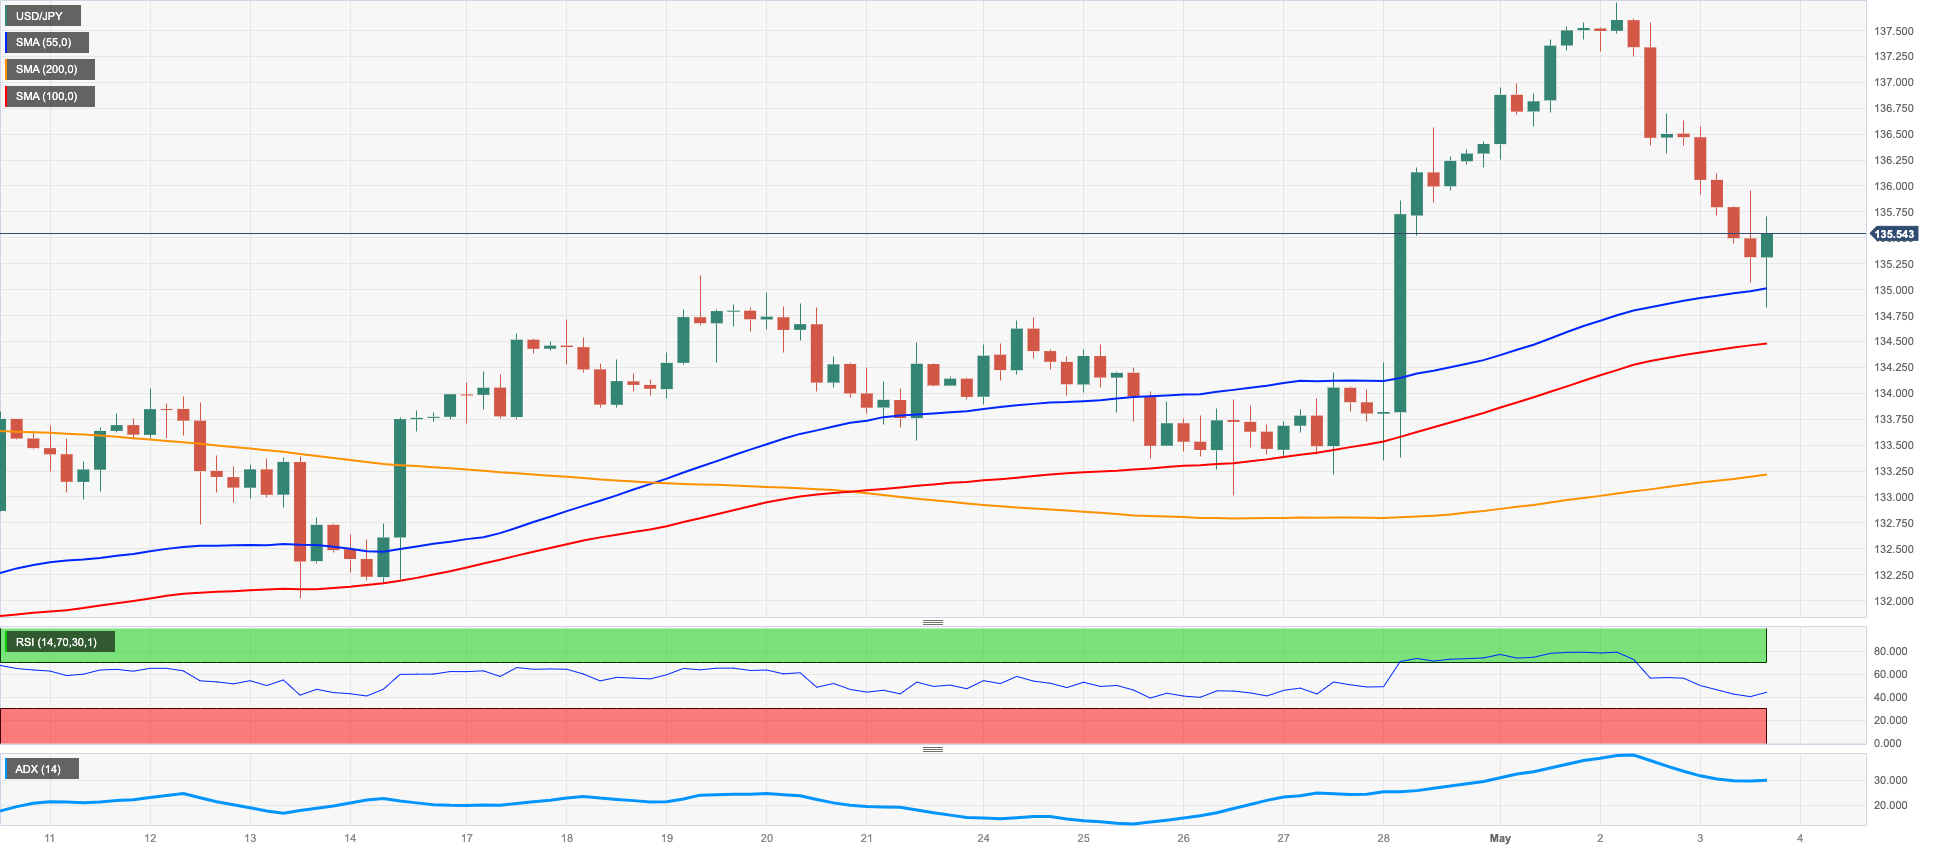
Extra losses in the greenback in combination with the generalized pullback in US yields encouraged sellers to remain in control and sponsored the second daily drop in USD/JPY, which this time probed (and rebounded from) the 134.80 zone.
The move lower in the dollar and yields gathered extra steam following the dovish hike from the Federal Reserve, particularly after the Committee signaled that an impasse in its hiking cycle is likely in June and July.
Around the Japanese debt market, the JGB 10-year yields traded within a marginal range around 0.41%.
The Japanese docket remained empty on Tuesday.
USD/JPY reached a new peak for May at 137.77 (May 2). Above this level lies the 2023 high at 137.91 (March 8), followed by weekly tops at 139.89 (November 30, 2022) and 142.25 (November 21, 2022). Conversely, a more significant decline could retest the weekly low of 133.01 (April 26), just before the provisional 100-day SMA at 132.86 and the minor level at 132.01 (April 13). Further southward, the April low of 130.62 (April 5) comes next, followed by the March low at 129.63 (March 24) and the February low at 128.08 (February 2). The 2023 low at 127.21 (January 16) is the next downside target. The daily RSI has declined to the vicinity of the 57 zone.
Resistance levels: 137.77 137.91 138.17 (4H chart)
Support levels: 134.83 133.01 132.01 (4H chart)
GBPUSD
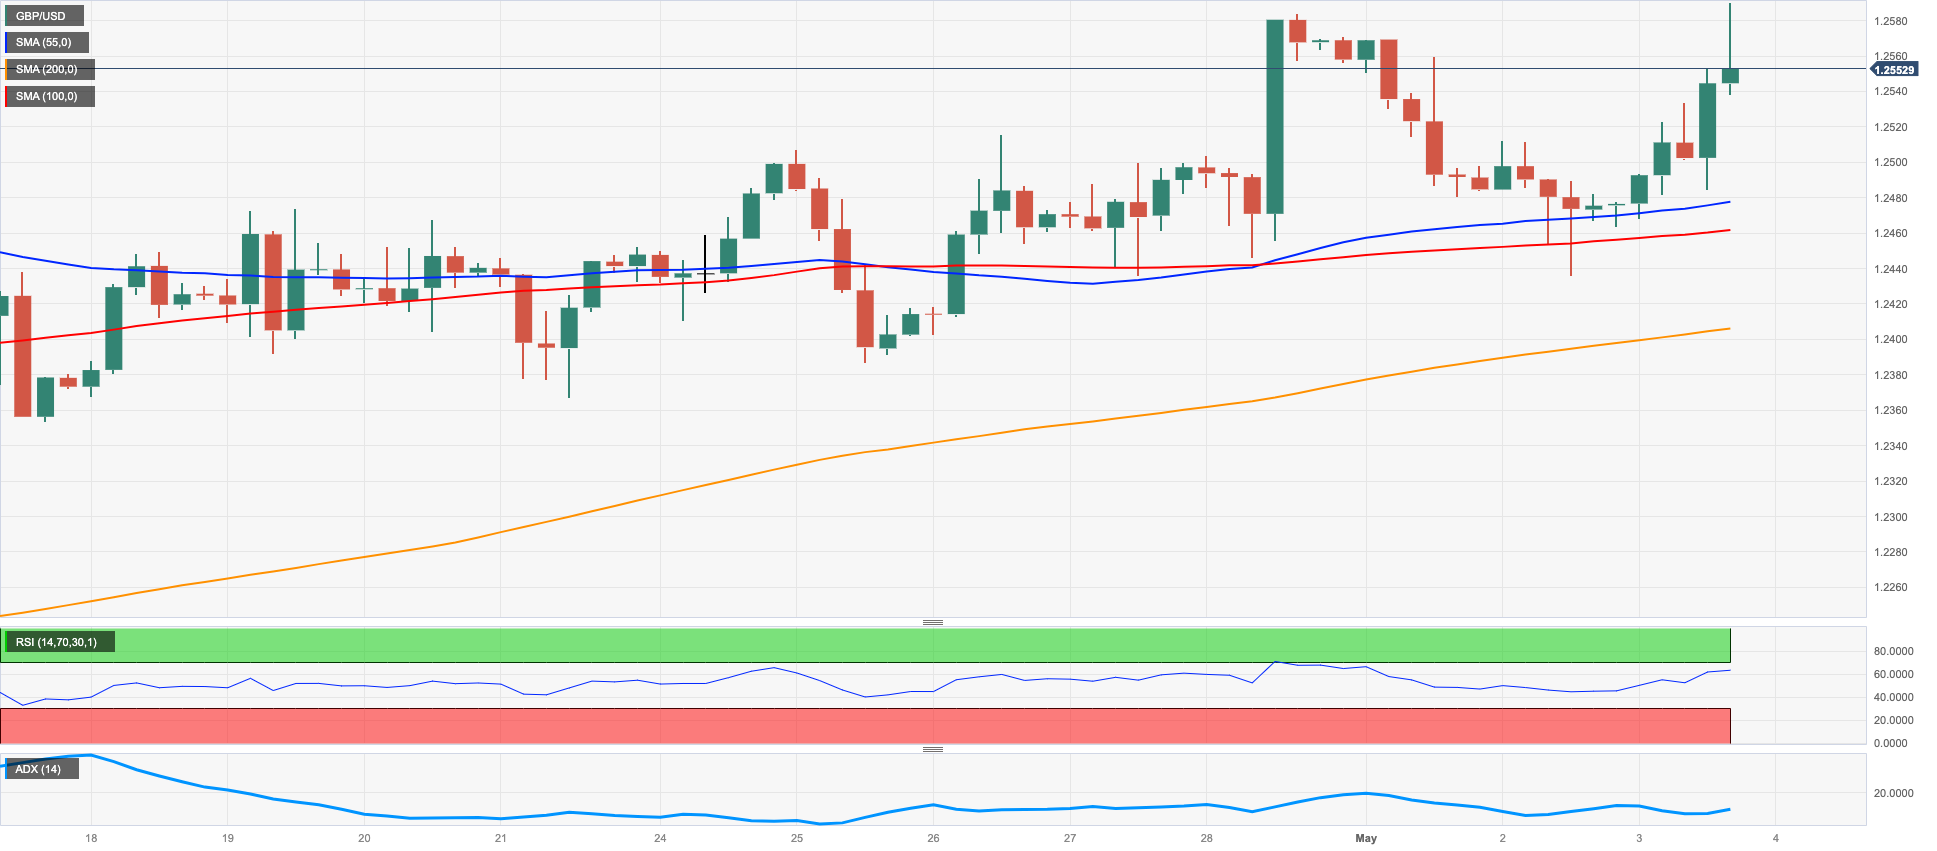
The relentless decline in the greenback allowed GBP/USD to extend the rebound from weekly lows near 1.2430 (May 2) to the area well past 1.2500 the figure on Wednesday.
Indeed, the dollar saw its weakness magnified on Wednesday and remained well on the back foot following the lack of surprises at Chair Powell’s press conference, all after the Federal Reserve matched the wide consensus and raised rates by a quarter-point at its event.
There were no data releases in the UK docket on Wednesday.
GBP/USD currently faces immediate support at 1.2344, which is the weekly low recorded on April 10. If this support level is breached, spot could test the April low at 1.2274 (April 3), followed by the interim 55-day SMA at 1.2254. A further decline from there could expose a potential drop to the key 200-day SMA at 1.1943, before reaching the 2023 low at 1.1802 (March 8). The other way around, bulls remain focused on the upside, with their sights set on the 2023 top at 1.2583 (April 28), followed by the May 2022 peak at 1.2666 (May 27) and the 200-week SMA at 1.2865, all before the psychological hurdle of 1.3000. The daily RSI has climbed further and broke above 59.
Resistance levels: 1.2583 1.2599 1.2666 (4H chart)
Support levels: 1.2435 1.2382 1.2364 (4H chart)
AUDUSD
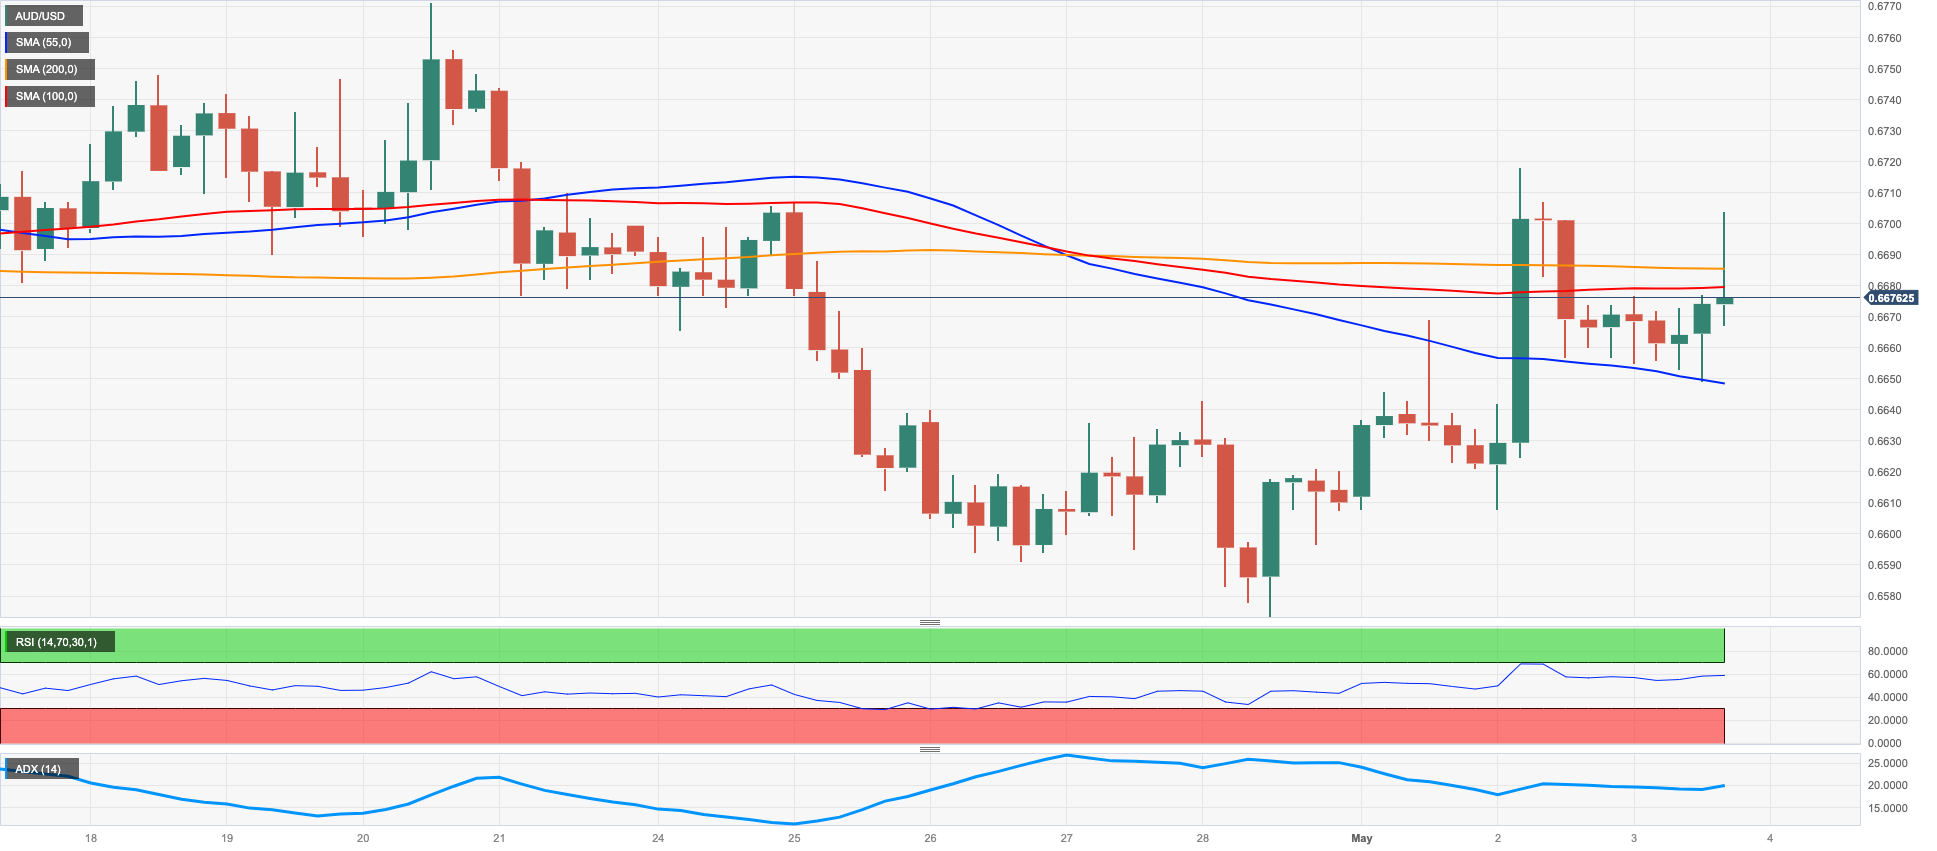
Further upside momentum saw AUD/USD advance for the third consecutive session, this time briefly trespassing 0.6700 the figure, an area coincident with the interim 55-day SMA.
The intense decline in the greenback favoured another bout of strength in the Aussie dollar, while the rebound in prices of the iron ore also collaborated with the upside amidst the broad-based mixed tone in the commodity galaxy.
Further support for AUD came from positive results in the domestic calendar. On this,
the Ai Group Industry Index improved to 20.1 in April and the final Judo Bank Services PMI confirmed an increase to 53.7 in the same period. Finally, advanced Retail Sales are seen expanding at a monthly 0.4% in March.
The AUD/USD still faces the next up-barrier at the key 200-day SMA at 0.6730. If it keeps going up, the next targets would be the weekly high at 0.6771 (April 20) and the April top at 0.6805 (April 14). If it goes even higher, it could reach the key round level at 0.7000, followed by the weekly peak at 0.7029 (February 14) and the 2023 high at 0.7157 (February 2). By contrast, there is a risk that the AUD/USD could drop, with immediate support at the April low at 0.6573 (April 28), followed by the 2023 low at 0.6563 (March 10) and the weekly low at 0.6386 (November 10 2022). The November 2022 low at 0.6272 (November 3) is the last level of support. The daily RSI has increased and surpassed the 48 mark.
Resistance levels: 0.6717 0.6771 0.6805 (4H chart)
Support levels: 0.6620 0.6573 0.6563 (4H chart)
GOLD
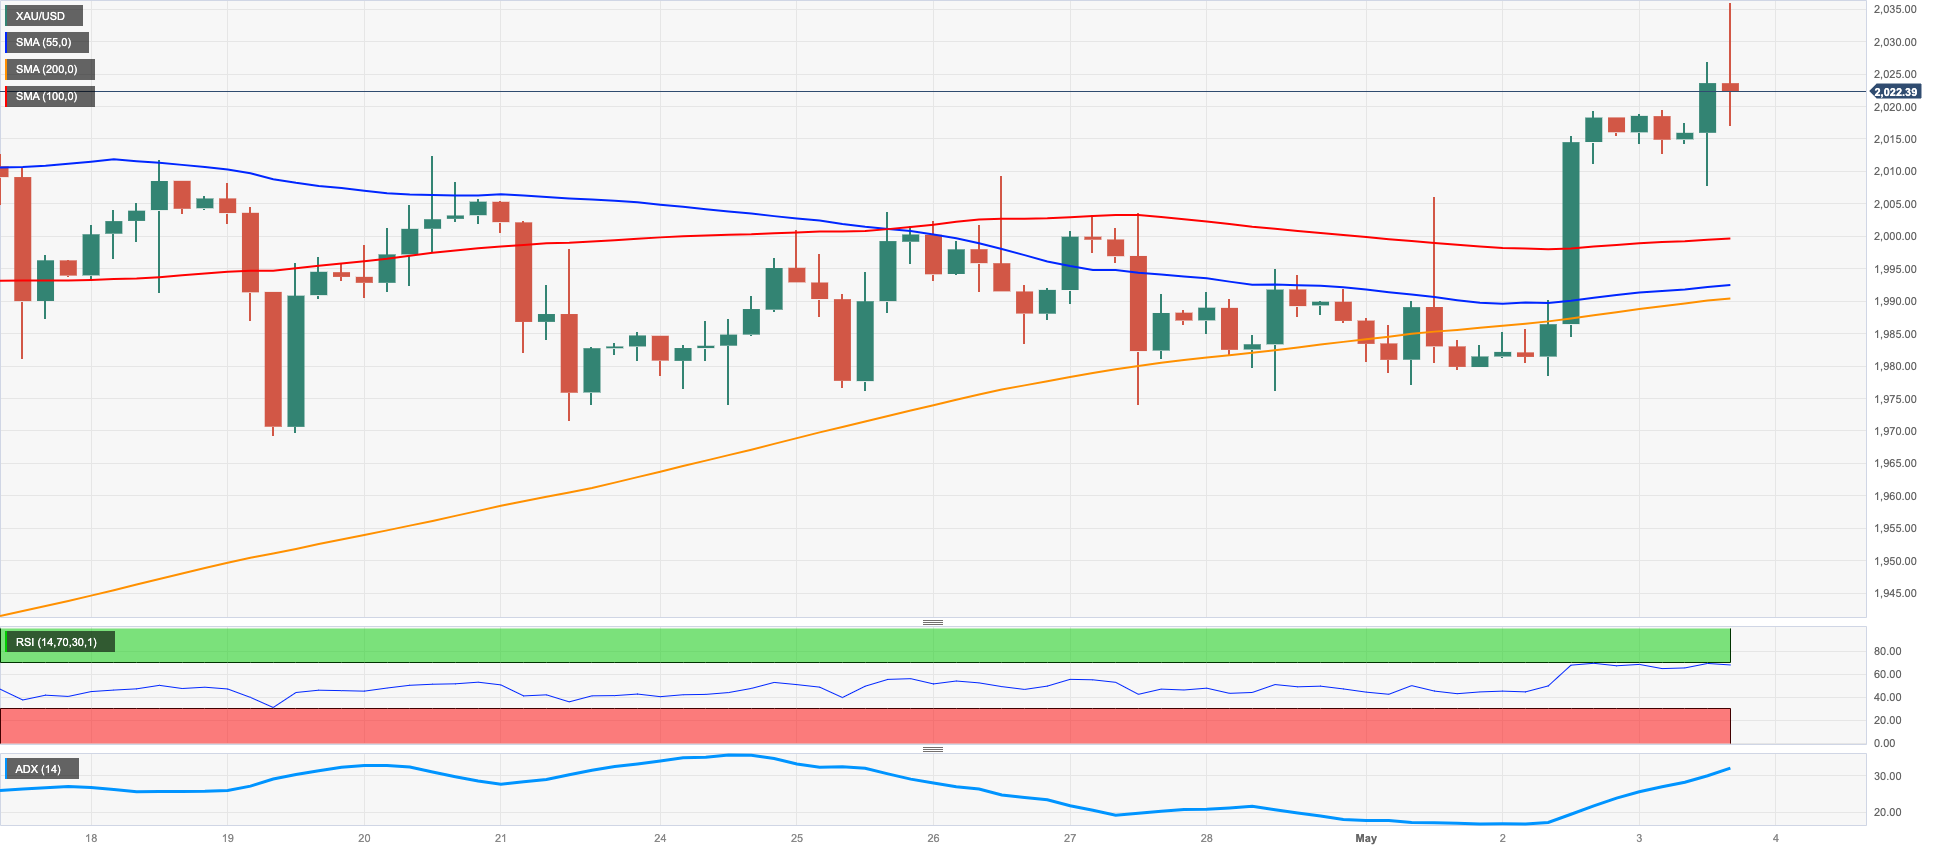
Prices of gold advanced further and reached new 3-week highs near the $2040 region on the back of the persistent sell-off in the US dollar.
Bolstering the bullish momentum in the precious metal and accompanying the decline in the buck emerged another retracement in US yields in the short end and the belly of the curve, particularly after the Federal Reserve left the door open to a pause in its normalization process in June and July.
Following the Fed’s decision to hike rates by 25 bps – as largely anticipated – market participants seem to have started to price in potential rate cuts as soon as in September.
The precious metal is likely to face resistance at several levels if its price continues to rise, including the 2023 high at $2048 (April 13), followed by the 2022 top at $2070 (March 8) and the all-time peak at $2075 (August 72020). To the contrary, if the ounce troy falls below the weekly low at $1969 (April 19), it could potentially reach the April low at $1949 ((April 3), and then find interim support at the 55- and 100-day SMAs, which are at $1934 and $1903, respectively. Further decline could revisit the March low at $1809 (March 8), and then the 2023 low at $1804 (February 28).
Resistance levels: $2036 $2048 $2070 (4H chart)
Support levels: $2008 $1988 $1969 (4H chart)
CRUDE WTI
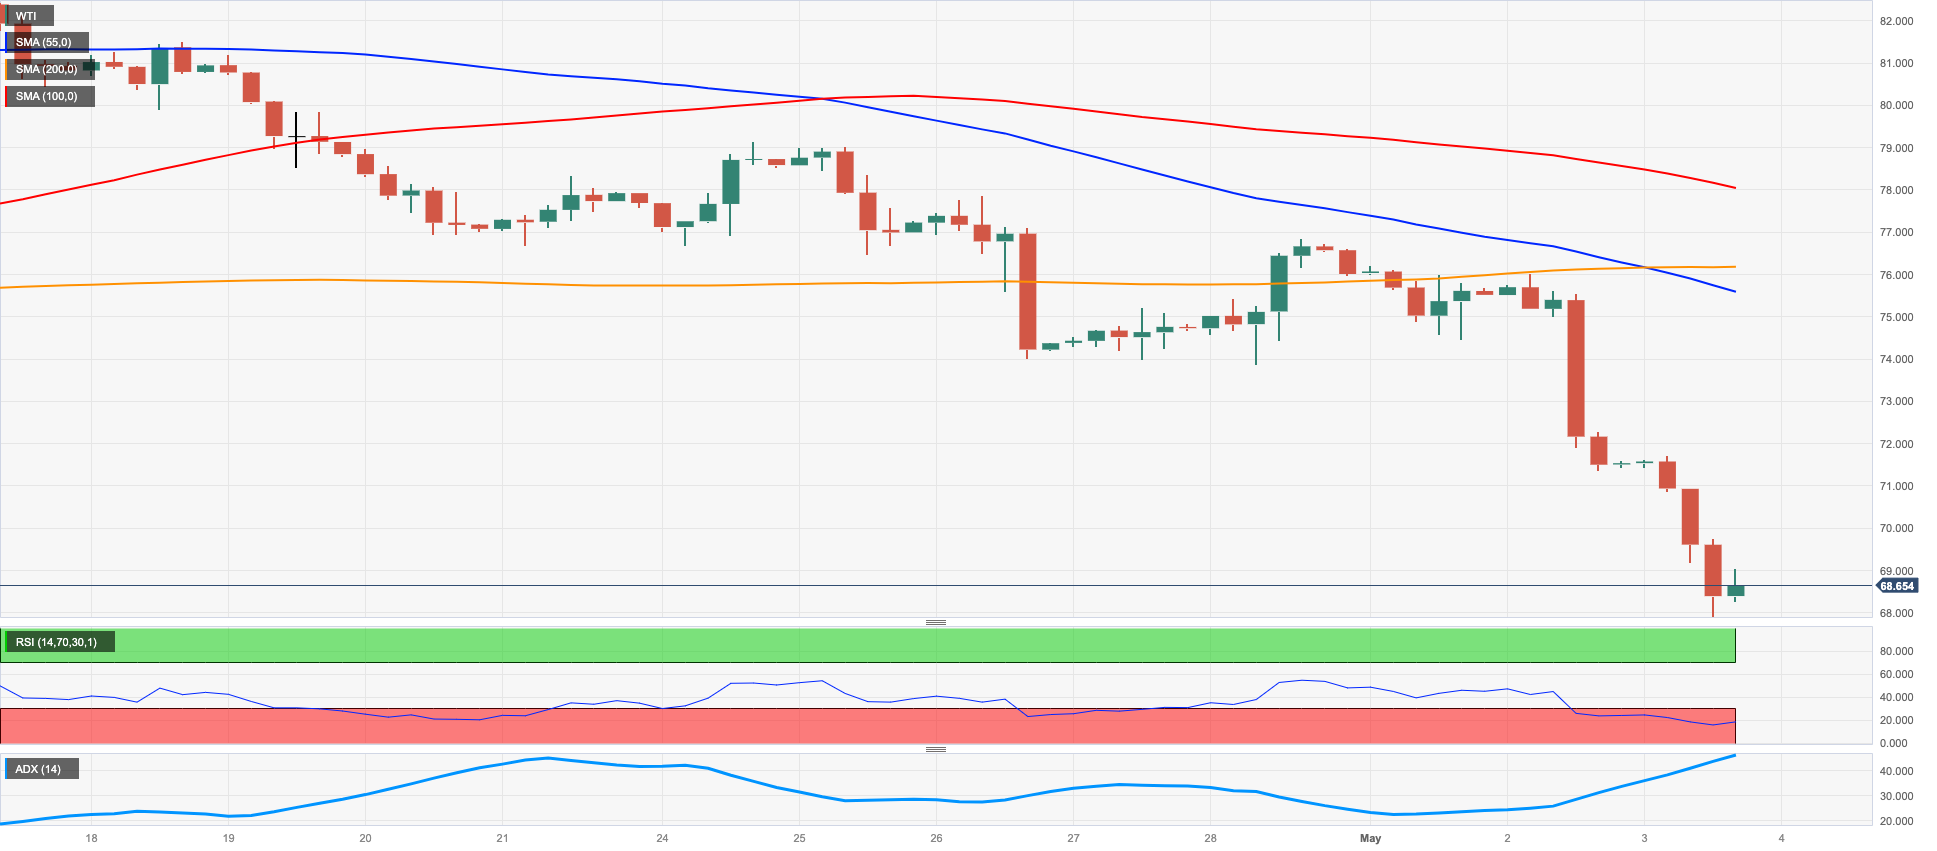
Another day, another low in the WTI, which have already lost more than 10% in the last three sessions.
Indeed, fears of a potential economic deceleration and its negative effects on the demand for the crude oil dictated the mood among traders and dragged prices of the barrel of the WTI to new 6-week lows around the $68.00 mark on Wednesday.
In addition, the unexpected build in weekly US crude oil supplies also favoured the downside bias in the commodity. On this, the EIA reported that US crude oil inventories dropped by 1.280M barrels in the week to April 28, while supplies at Cushing went up by 0.541M barrels, Weekly Distillate Stocks shrank by 1.191M barrels and gasoline stockpiles unexpectedly rose by 1.743M barrels.
WTI hit a new low in May at $68.02 (May 3). If the commodity falls below this level, it may revisit the $66.86 level (March 24) and the 2023 low of $64.41 (March 20). If the latter is breached, the commodity may face a drop to the December 2021 low at $62.46 (December 2) before hitting the crucial $60.00 per barrel mark. Instead, the immediate hurdle for bulls is at the weekly high of $79.14 (April 24), just before the key $80.00 mark. This is followed by the 200-day SMA at $81.55. If WTI crosses this level, it may target the 2023 top of $83.49 (April 12), seconded by the November 2022 peak of $93.73 (November 7).
Resistance levels: $75.88 $76.89 $79.14 (4H chart)
Support levels: $68.02 $66.79 $64.33 (4H chart)
GER40
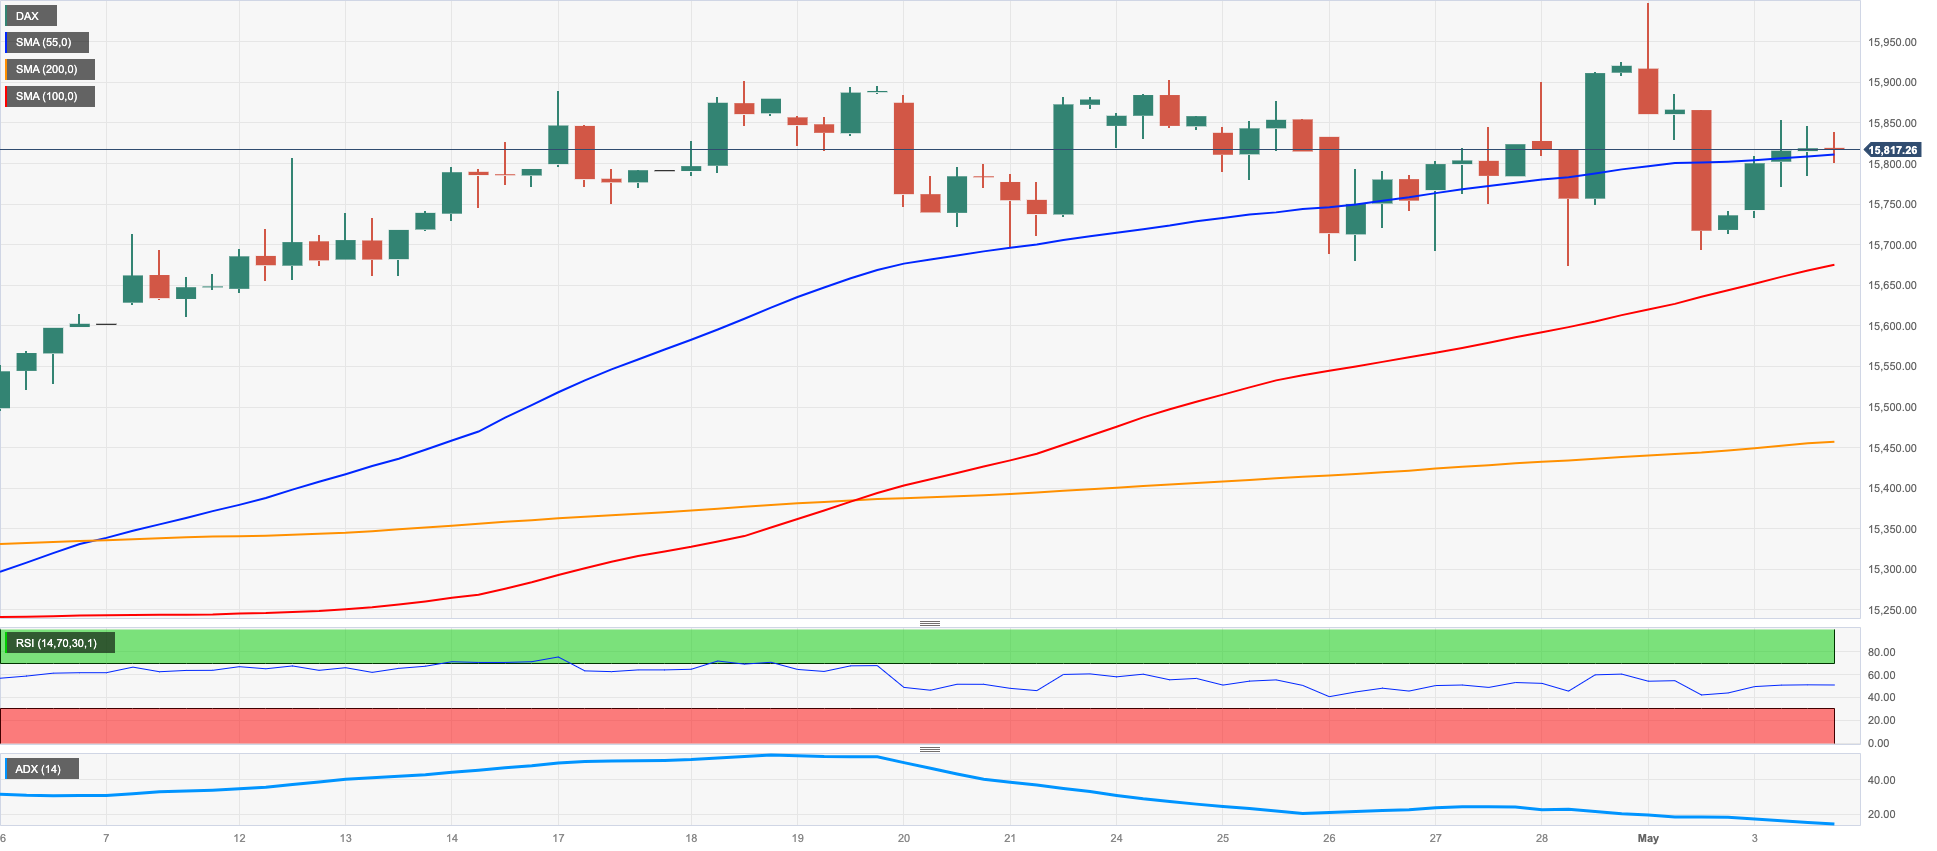
In line with most of the European markets, Germany’s benchmark DAX40 managed to regain some composure and partially reverse Tuesday’s steep pullback, reclaiming at the same time the area above 15800.
Auspicious corporate reports kept dictating the mood among investors in the old continent along with rising cautiousness ahead of the FOMC event later on Wednesday.
In the German money markets, the 10-year Bund yields lost further ground and approached the 2.20% zone, or multi-week lows.
There were no data releases in Germany on Wednesday.
If the DAX40 manages to break above the 2023 high at 16011 (May 2), it could lead to a potential challenge of the 2022 top at 16285 (January 5). On the flip side, the April low at 15482 (April 5) is currently reinforced by the provisional 55-day SMA at 15477, with the temporary 100-day SMA at 15118 serving as the next potential support level if the index accelerates its losses. A further retracement could result in a re-emergence of the minor support at 14809 (March 24), prior to the March low at 14458 (March 20), and the key 200-day SMA at 14216. The daily RSI has bounced past 56.
Best Performers: Sartorius AG VZO, Merck, BASF
Worst Performers: Zalando SE, Siemens Energy AG, Adidas
Resistance levels: 16011 16090 16285 (4H chart)
Support levels: 15688 15482 15444 (4H chart)
NASDAQ
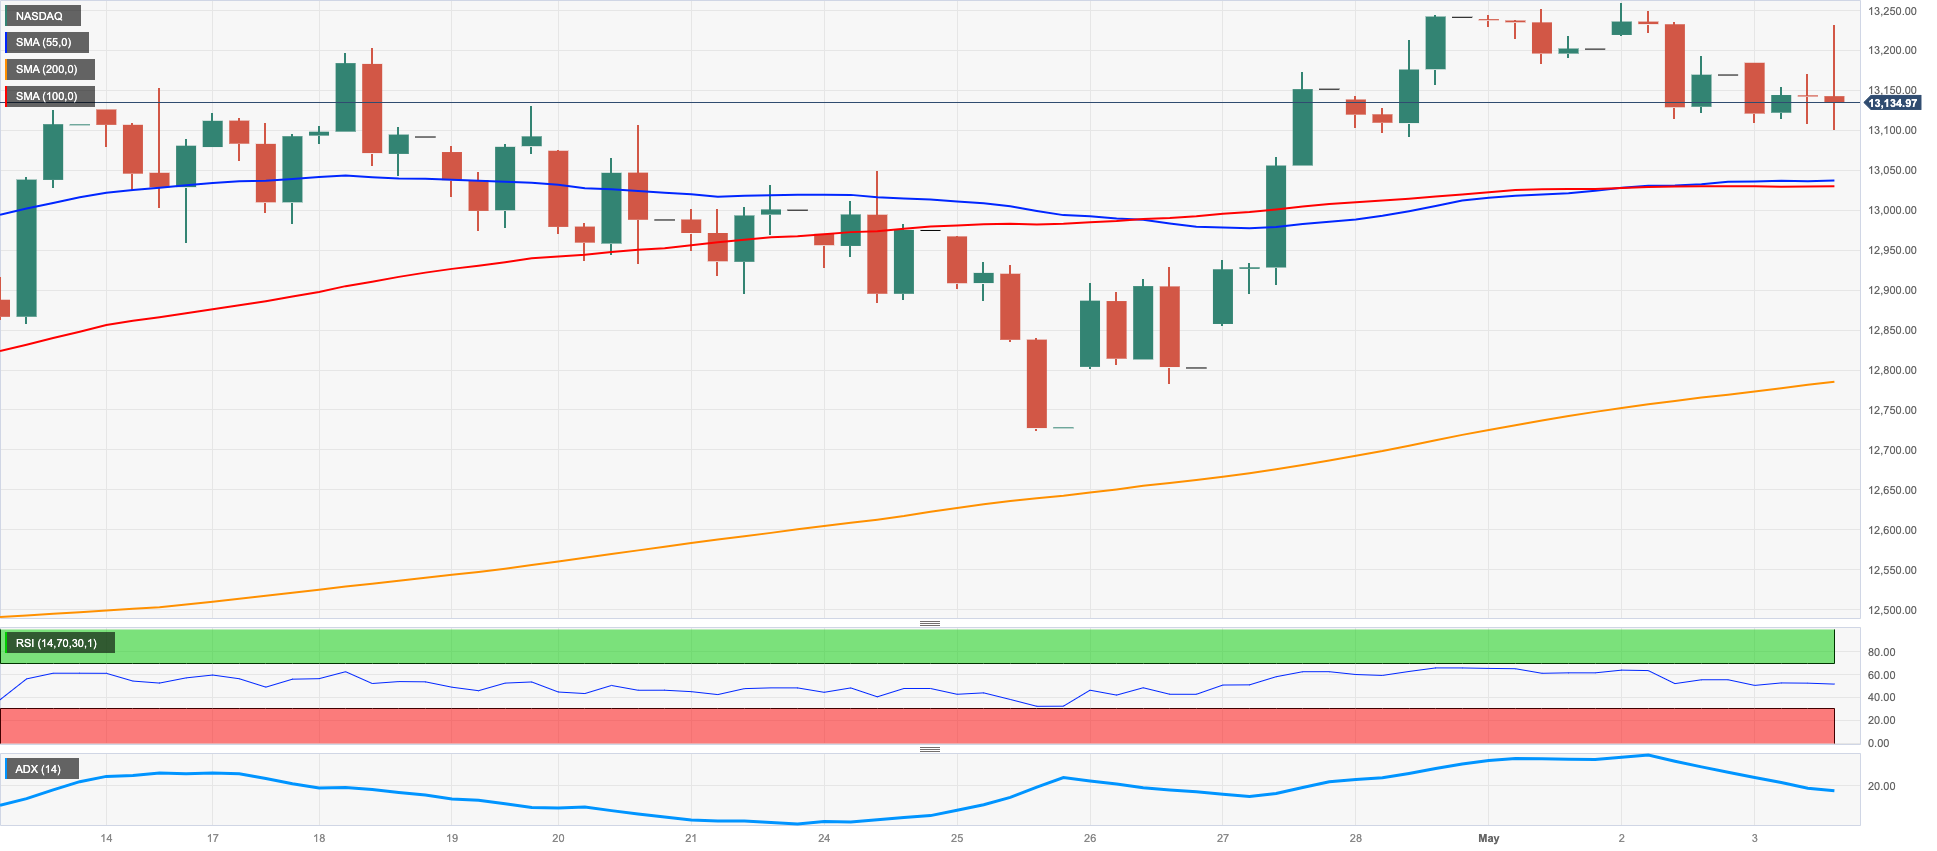
US tech equities gauged by the Nasdaq 100 added to Tuesday’s gains and retested the 13200 region helped by the persistent retracement in the dollar and the mixed tone in US yields across the curve.
Optimism among investors, in the meantime, remained well and sound following the dovish hike by the Fed at its meeting on Wednesday.
Considering the current price action, the Nasdaq 100 is still indicating further potential for gains. However, the immediate resistance level is currently at the 2023 high of 13287 (May 1), before the August 2022 top of 13720 (August 16), and the significant round level of 14000. Further up, the March 2022 peak of 15265 (March 29) could be the next target. Just the opposite, the April low of 12724 (April 25) is expected to hold the initial test against any downside momentum. If this level is breached, the interim 55-day SMA at 12642 and the weekly low at 12517 (March 28) could provide additional contention. A break below these levels could bring the key 200-day SMA at 12073 into play, ahead of the March low at 11695 (March 13) and weekly lows at 11550 (January 25) and 11251 (January 19), ahead of the 2023 low at 10696 (January 6). The daily RSI has advanced to the 56 zone.
Top Gainers: Verisk, Datadog, IDEXX Labs
Top Losers: Starbucks, AMD, Adobe
Resistance levels: 13287 13720 14277 (4H chart)
Support levels: 12724 12517 12148 (4H chart)
DOW JONES
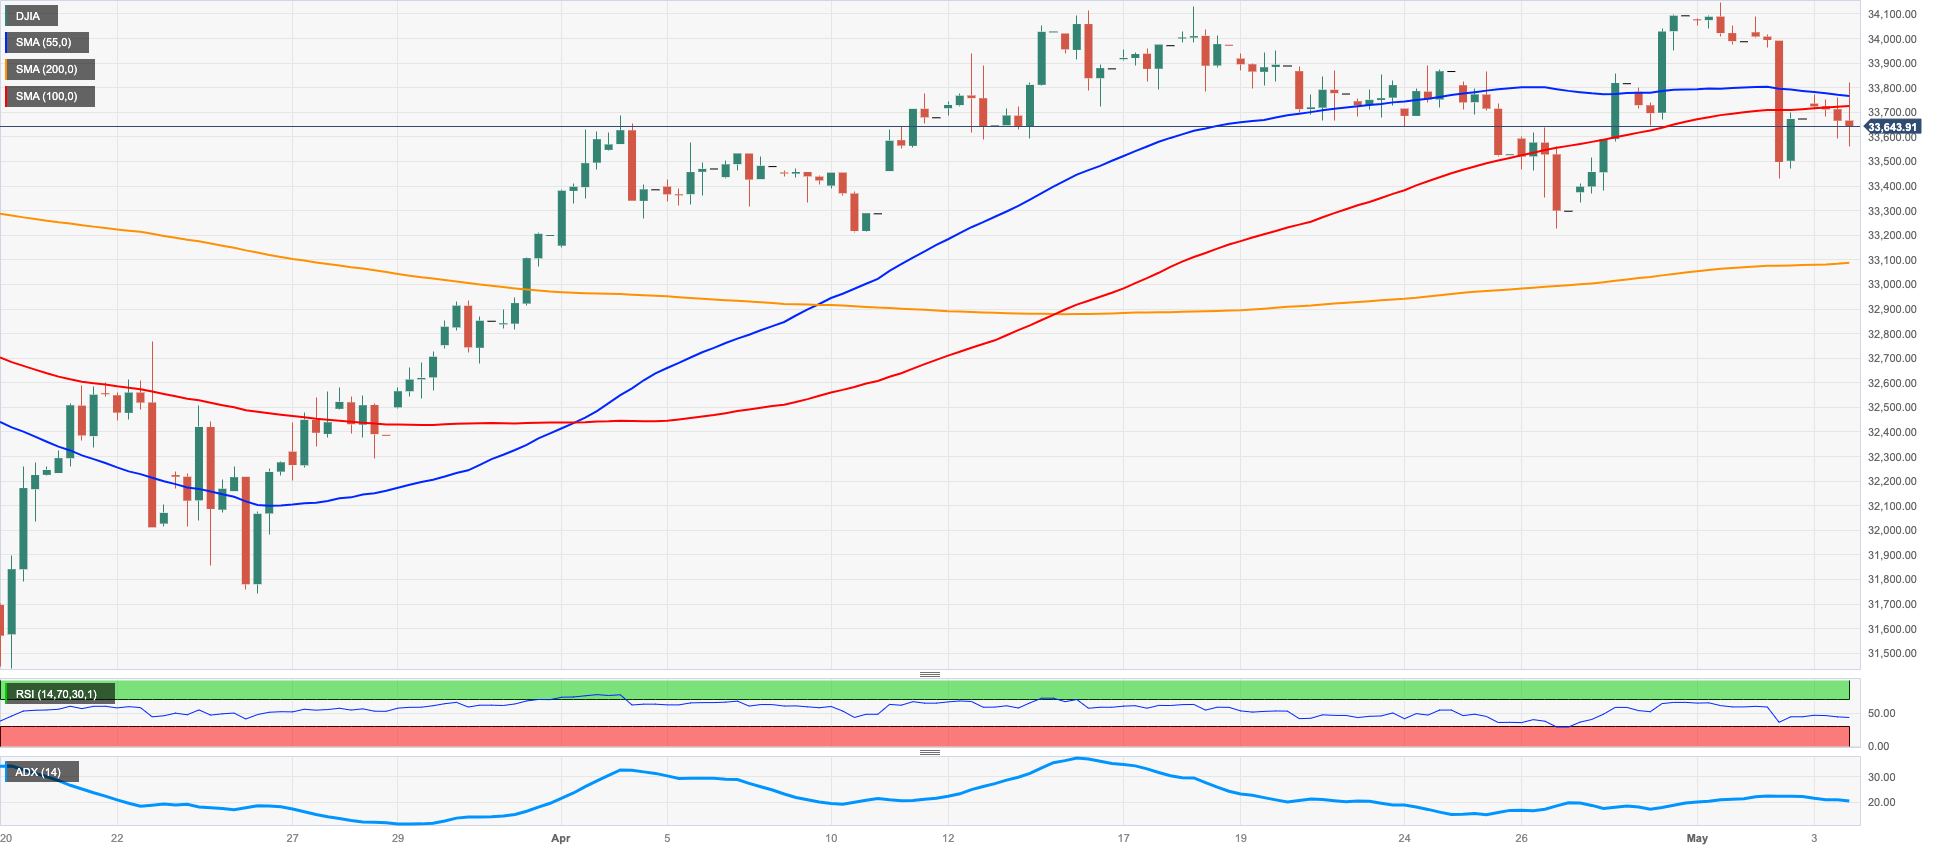
Stocks measured by the Dow Jones and the S&P500 eroded initial gains and returned to the negative territory on Wednesday, adding to the pessimism seen since the beginning of the week. The only exception was the tech sector, where the Nasdaq managed to print humble gains.
In fact, the Dow Jones added to Tuesday’s pullback after the Federal Reserved delivered the largely telegraphed 25 rate hike, at the time when it paved the way for a pause in its hiking cycle in the next months.
All in all, the Dow Jones retreated 0.65% to 33465, the S&P500 dropped 0.15% to 4111 and the tech-heavy Nasdaq Composite rose 0.17% to 12147.
If selling pressure gains momentum, the Dow Jones may potentially test the interim 100-day SMA at 33350, followed by the April low at 33235 (April 26), which is somewhat supported by the interim 55-day SMA at 33144. If the index continues to trend downwards, the key 200-day SMA at 32703 may provide further support, ahead of the 2023 low at 31429 (March 15) and the 2022 low at 28660 (October 13). On the other hand, the initial hurdle can be found at the May high at 34257 (May 1), which is closely followed by the 2023 top at 34342 (January 13) and the December 2022 peak at 34712 (December 13). A break above the latter could potentially lead to the April 2022 high at 35492 (April 21), prior to the February 2022 top at 35824 (February 9) and just before the 36000 yardstick. The daily RSI has dropped to the 50 area.
Top Performers: Intel, Walt Disney, Verizon
Worst Performers: Walgreen Boots, Amgen, JPMorgan
Resistance levels: 34257 34334 34712 (4H chart)
Support levels: 33436 33235 31805 (4H chart)
MACROECONOMIC EVENTS

All Information & Updates provided by:

All information relating to the financial markets available on this page has been prepared and issued by FXStreet (Forexstreet SL, Spain, Reg: B62498233) on the basis of publicly available information and all information believed to be reliable and does not conflict with Kuwaiti local laws, and all necessary care has been taken to before the company to ensure that the facts mentioned are correct from the source.
NCM Investment nor any of its directors or employees shall in any way be held responsible for the contents of this news, and the information contained on this page is intended only to provide clients with publicly available information and should not be construed as investment advice, report or analysis and/or constitute an offer or invitation to buy or sell financial instruments of any kind.
RISK WARNING: Forex and CFDs are highly risky leveraged products, as losses can exceed deposits. Please ensure you understand all the risks and take independent advice if necessary. NCM will segregate the clients based on the criteria of the regulator and its bylaws. NCM does not provide any advisory service; the material published does not constitute advice or a recommendation for a transaction in any financial instrument. NCM accepts no responsibility for any use of the content presented and any consequences of that use. Anyone acting on the information provided does so at their own risk.