
- Contact Us:
-

-

-

-


Daily Market Updates
05 May 2023
USDJPY
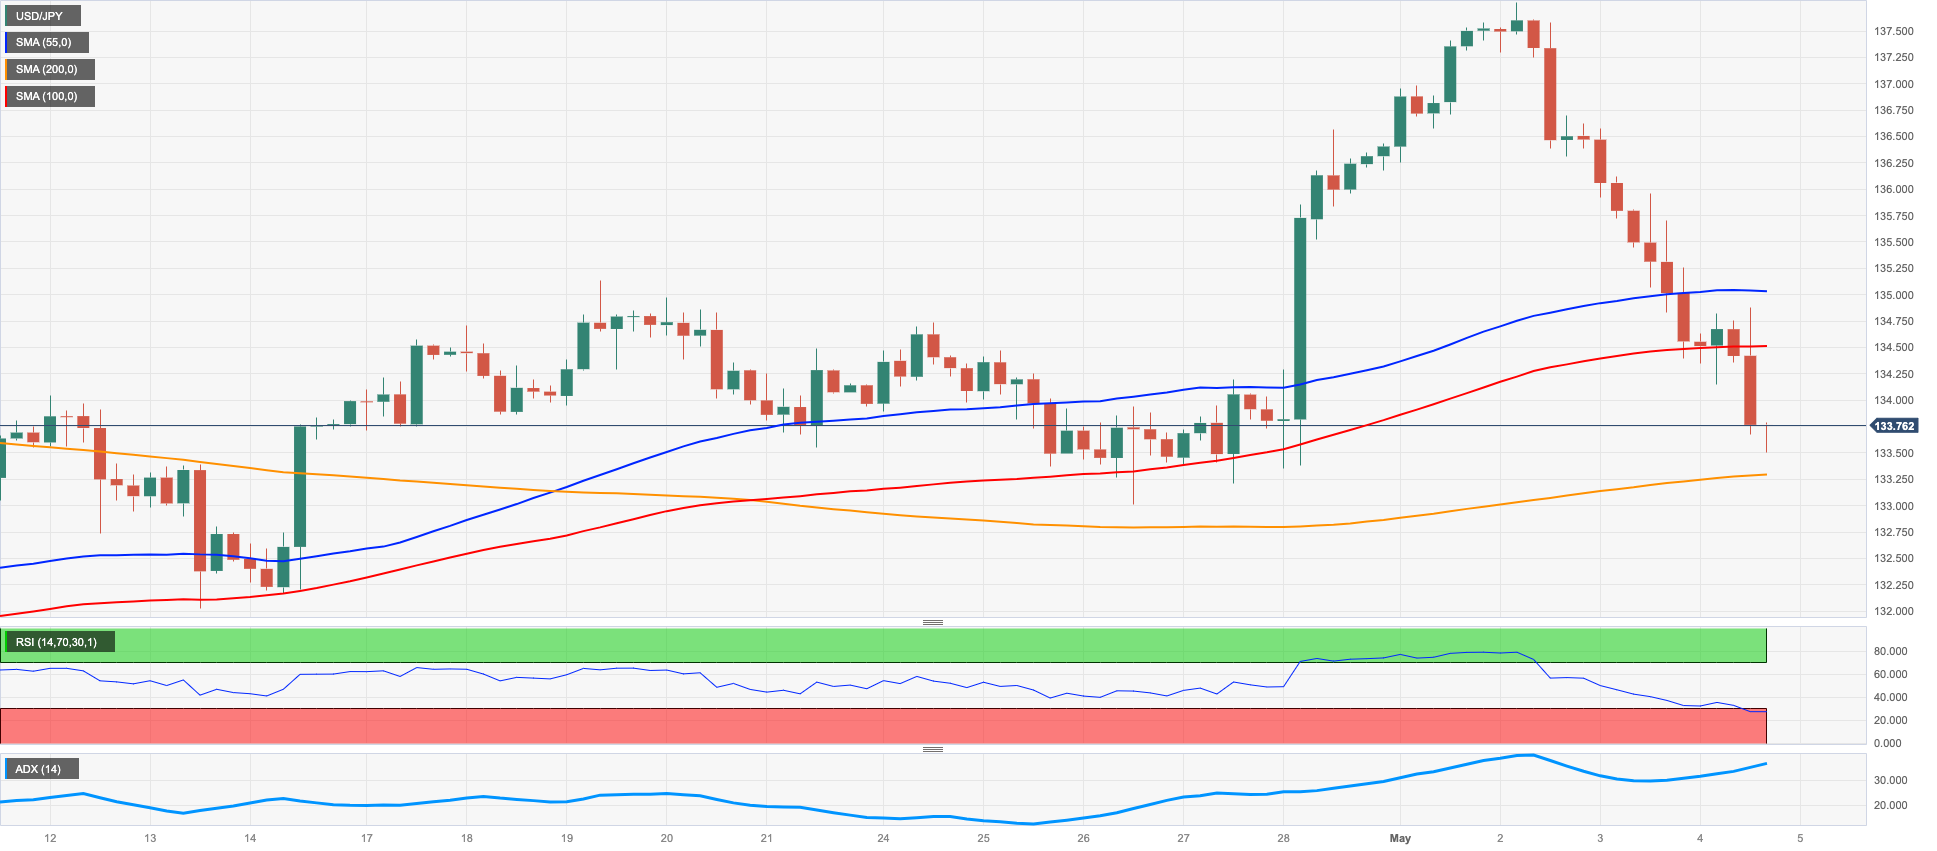
USD/JPY extended the rejection from recent peaks near 137.80 (May 2) for the third consecutive session, now breaching the key 134.00 contention level to print fresh weekly lows on Thursday.
Small gains in the dollar failed to provide some upside reaction in spot, while the mixed tone in US yields across the curve also added to the pair’s bearish performance.
Still around yields, the Japanese debt market saw the JGB 10-year yields trade within a marginal range around the 0.41%.
There were no scheduled data releases/events in the Japanese docket.
In case of extra losses, USD/JPY is expected to revisit the weekly low of 133.01 (April 26), seconded by the temporary 100-day SMA at 132.82 and the minor level at 132.01 (April 13). Further down, the April low of 130.62 (April 5) comes next, ahead of the March low at 129.63 (March 24) and the February low at 128.08 (February 2). The 2023 low at 127.21 (January 16) is the next target on the downside. On the opposite side, the May top 137.77 (May 2) comes first before the 2023 peak at 137.91 (March 8), followed by the weekly tops at 139.89 (November 30, 2022) and 142.25 (November 21, 2022). The daily RSI slipped back to the sub-50 zone.
Resistance levels: 137.77 137.91 138.17 (4H chart)
Support levels: 133.49 133.01 132.01 (4H chart)
GBPUSD
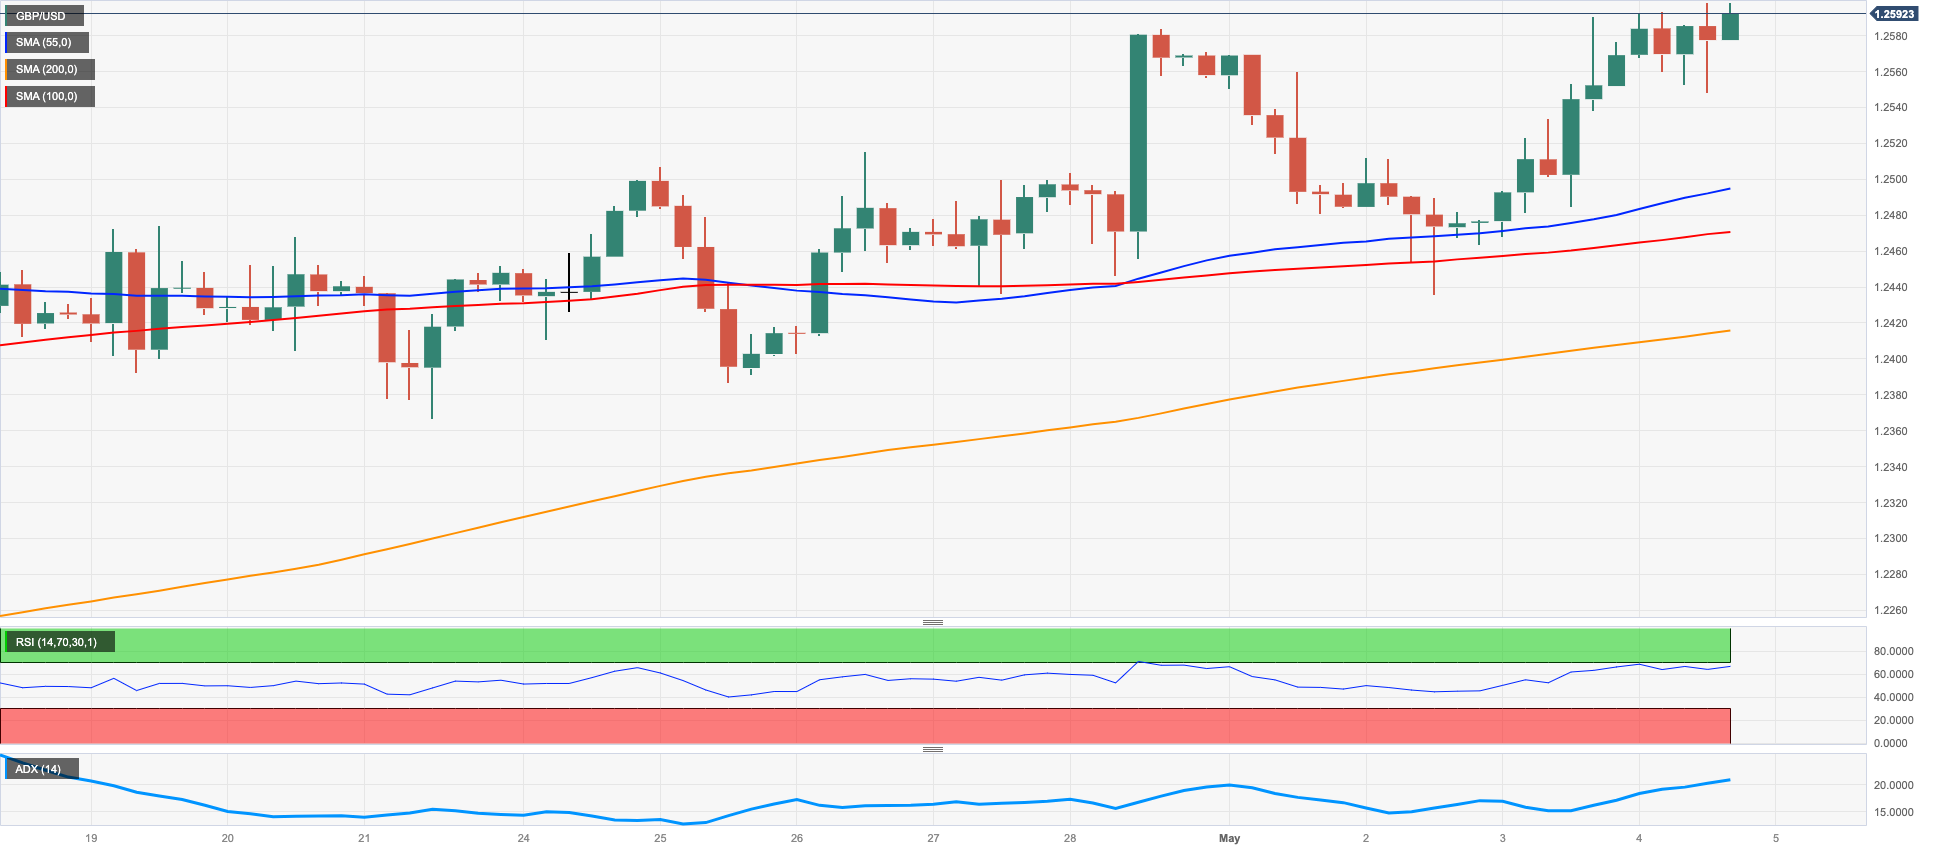
GBP/USD added to Wednesday’s uptick and rose to levels last seen in June 2022 just below 1.2600 the figure on Thursday.
The move higher in Cable came despite the recovery in the greenback – which was intensified following the ECB gathering – and seems to have now paved the way for a move to May 2022 peaks near 1.2670.
So far, GBP/USD is navigating the 8th consecutive week with gains, up around 8 cents since March lows around the 1.1800 zone.
-638188186524407366.png)
Looking at the UK docket, Mortgage Approvals rose to 52.011K and Mortgage Lending decreased to £0.018B in March, while the final Services PMI improved to 55.9 in April (from 52.9).
GBP/USD printed a new 2023 peak at 1.2598 on May 4. Furthermore, bulls remain focused on the May 2022 top at 1.2666 (May 27) ahead of the 200-week SMA at 1.2865 and the psychological level of 1.3000. On the other hand, the immediate support level for GBP/USD is at 1.2344 (April 10). In case this contention zone is broken, the next support levels to watch are the April low at 1.2274 (April 3), somewhat bolstered by the temporary 55-day SMA at 1.2266. A further decline from there could lead to a potential drop to the key 200-day SMA at 1.1945 before reaching the 2023 low at 1.1802 (March 8). The daily RSI edged higher and surpassed 62.
Resistance levels: 1.2598 1.2666 1.2772 (4H chart)
Support levels: 1.2435 1.2405 1.22386 (4H chart)
AUDUSD
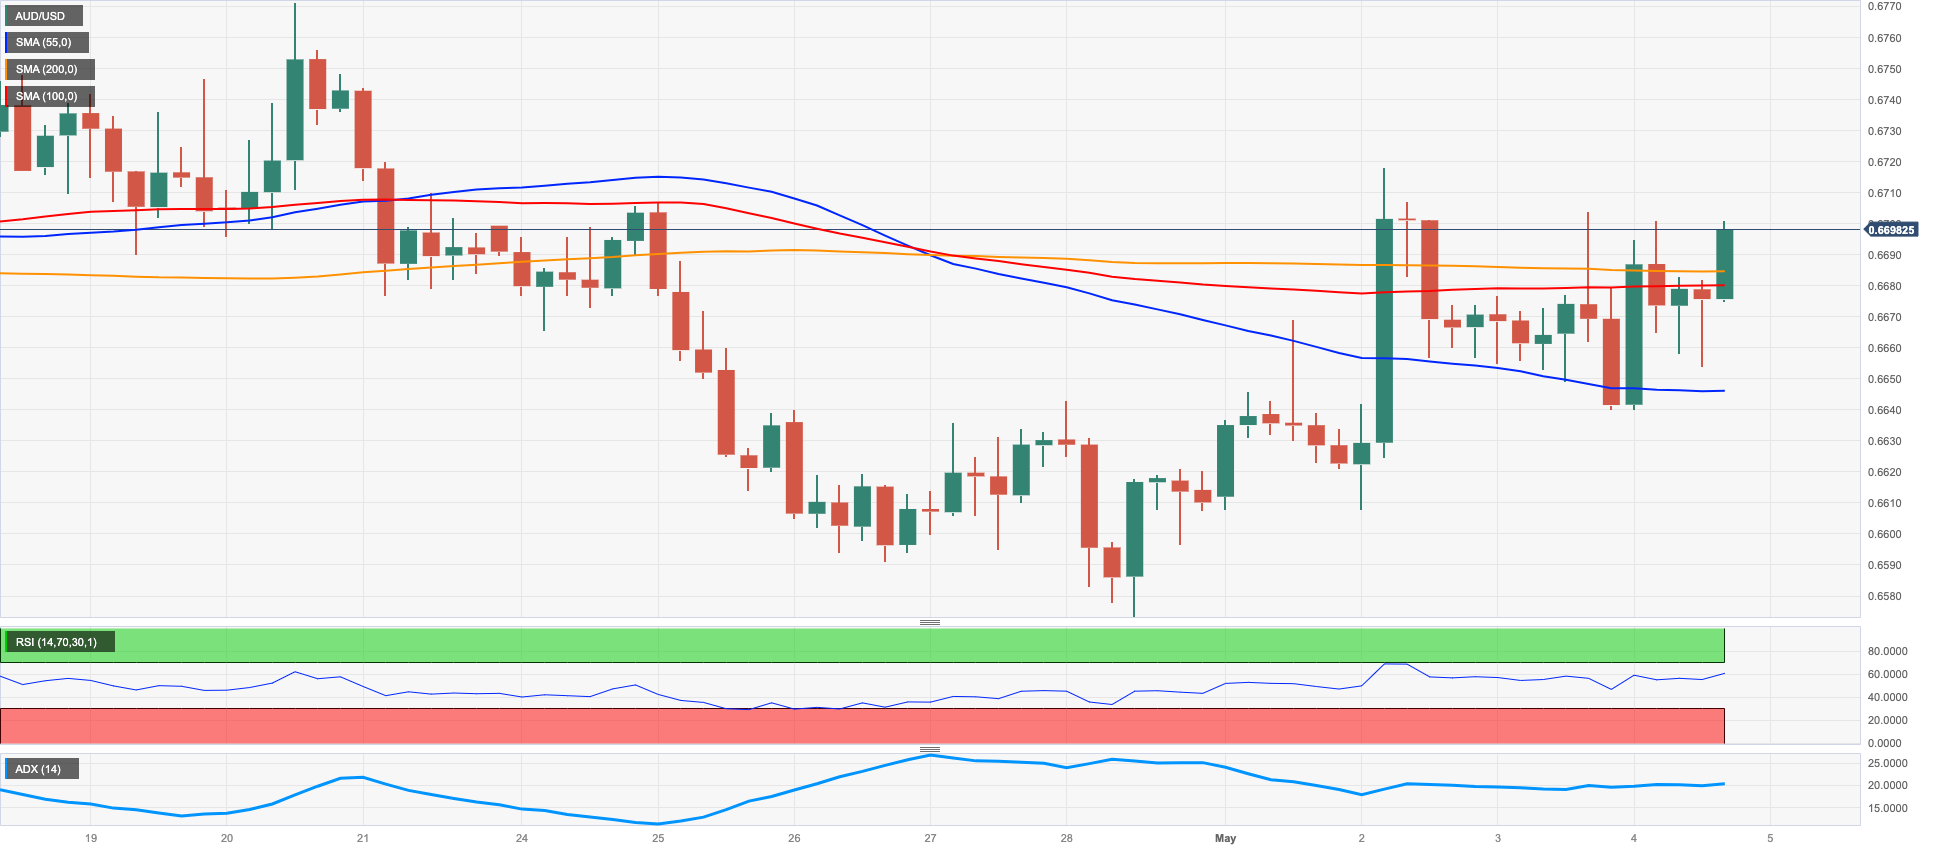
AUD/USD extended the weekly bounce and flirted with the key 0.6700, practically ignoring the decent improvement in the sentiment surrounding the greenback on Thursday.
Furthermore, the Aussie dollar remained on the positive foot despite the erratic performance of the commodity universe, where copper prices advanced marginally and the iron ore headed southwards.
In what was the sole release in Oz, the trade surplus rose to A$15.269B in March, with Exports up 4% vs. the previous month and Imports rising 2.0% MoM.
The AUD/USD is currently facing resistance at the key 200-day SMA at 0.6728. If the price continues to rise, the next targets are the weekly high at 0.6771 (April 20) and the April top at 0.6805 (April 14). Further up, the key round level at 0.7000 is a potential target, prior to the weekly peak at 0.7029 (February 14) and the 2023 high at 0.7157 (February 2). However, there is a possibility of a drop in the AUD/USD, with initial support at the April low of 0.6573 (April 28), ahead of the 2023 low at 0.6563 (March 10) and the weekly low at 0.6386 (November 10, 2022). The last level of support is the November 2022 low at 0.6272 (November 3). The daily RSI rose past the 52 hurdle.
Resistance levels: 0.6717 0.6771 0.6805 (4H chart)
Support levels: 0.6640 0.6620 0.6573 (4H chart)
GOLD
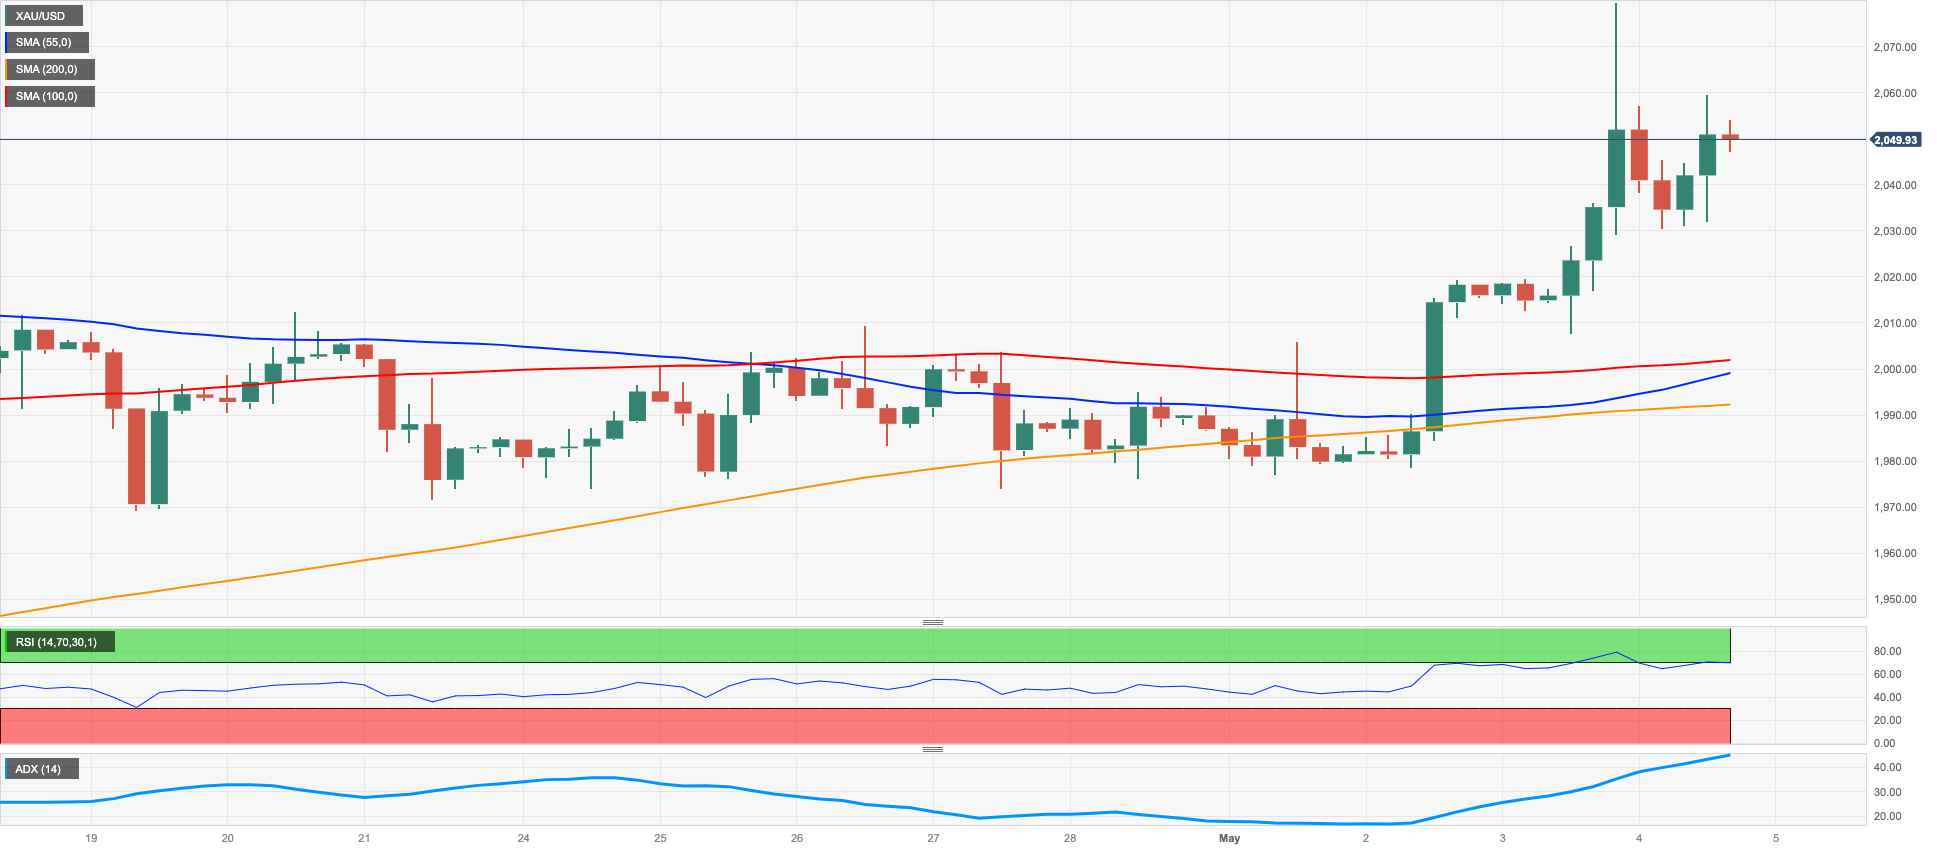
Gold prices maintained the monthly intense recovery and rose for the third consecutive session to levels just shy of the $2070 mark per ounce troy on Thursday.
The absence of traction in US yields across the curve in combination with persevering banking concerns as well as the expected pause in the Fed’s tightening cycle all lent further legs to the precious metal, which reached levels last seen over a year ago.
The daily pullback, however, appeared somewhat dented by the stronger dollar and the pledge by the ECB to keep hiking rates in the next months.
If the price of gold continues to rise, it will face resistance at multiple levels, including the 2023 high of $2067 (May 4), closely followed by the 2022 top of $2070 (March 8) and the all-time peak of $2075 (August 7 2020). If the ounce troy falls below the weekly low of $1969 (April 19), it may approach the April low of $1949 (April 3), and then find temporary support at the 55- and 100-day SMAs, which are at $1938 and $1906, respectively. Further declines might bring the price back to the March low of $1809 (March 8), and subsequently to the 2023 low of $1804 (February 28).
Resistance levels: $2067 $2070 $2075 (4H chart)
Support levels: $2008 $1991 $1969 (4H chart)
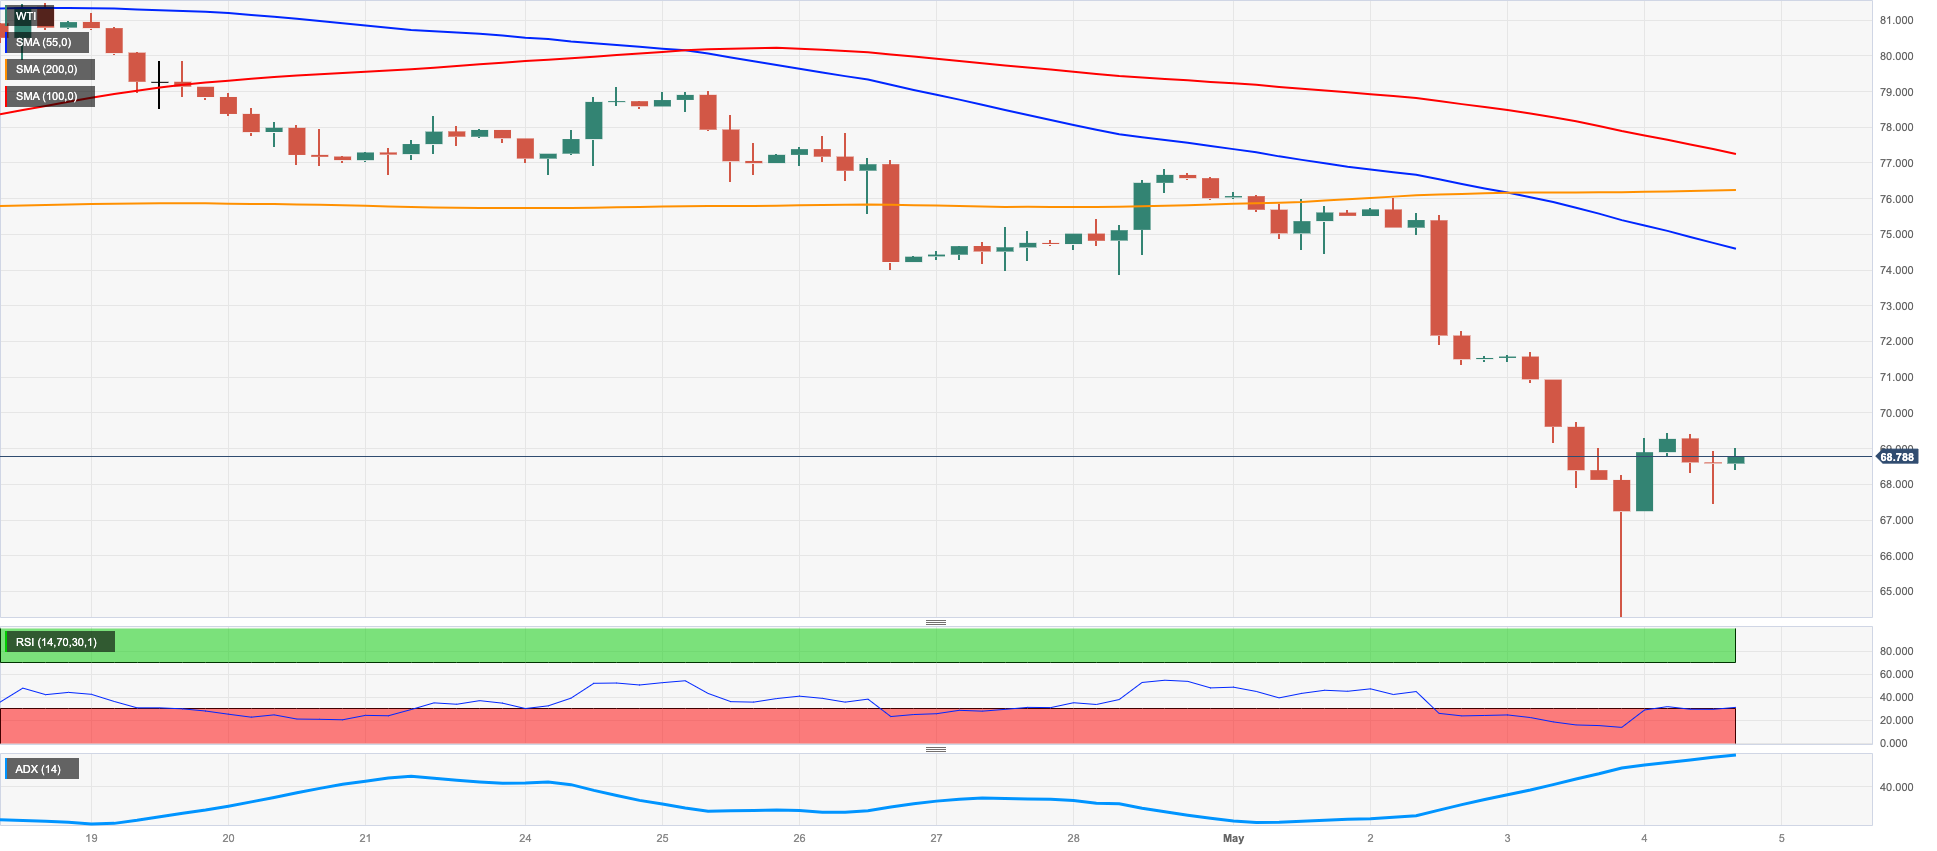
CRUDE WTI
WTI prices experienced a volatile trading session on Thursday, initially falling to new 2023 lows around $63.70 per barrel before rebounding towards the $70.00 mark, where they encountered resistance.
The markets appeared to be reacting to a number of factors, including the recent dovish hike by the Fed and the slower pace of tightening by the ECB, which eased some recession concerns. However, weaker-than-expected manufacturing sector results in China and an unexpected build in US crude oil inventories last week kept upward pressure on prices in check.
Looking ahead, Baker Hughes is set to release its weekly report on US drilling activity for the week ending May 5th, which could provide further insight into the state of the oil markets.
Overall, it remains to be seen how these various factors as well as the start of the OPEC+ planned output cut will impact WTI prices in the coming days and weeks.
WTI dropped to a new 2023 low of $63.73 (May 4). The commodity may decline to the December 2021 low of $62.46 (December 2) before reaching the critical $60.00 per barrel level if the latter is crossed. Instead, occasional bullish attempts are expected to meet the next hurdle not before the weekly high of $79.14 (April 24), which is close to the important $80.00 level. The 200-day SMA at $81.41 follows this. WTI may aim for the 2023 top of $83.49 (April 12) if it passes through this level, prior to the November 2022 peak of $93.73 (November 7).
Resistance levels: $71.74 $75.89 $79.14 (4H chart)
Support levels: $63.61 $62.42 $61.72 (4H chart)
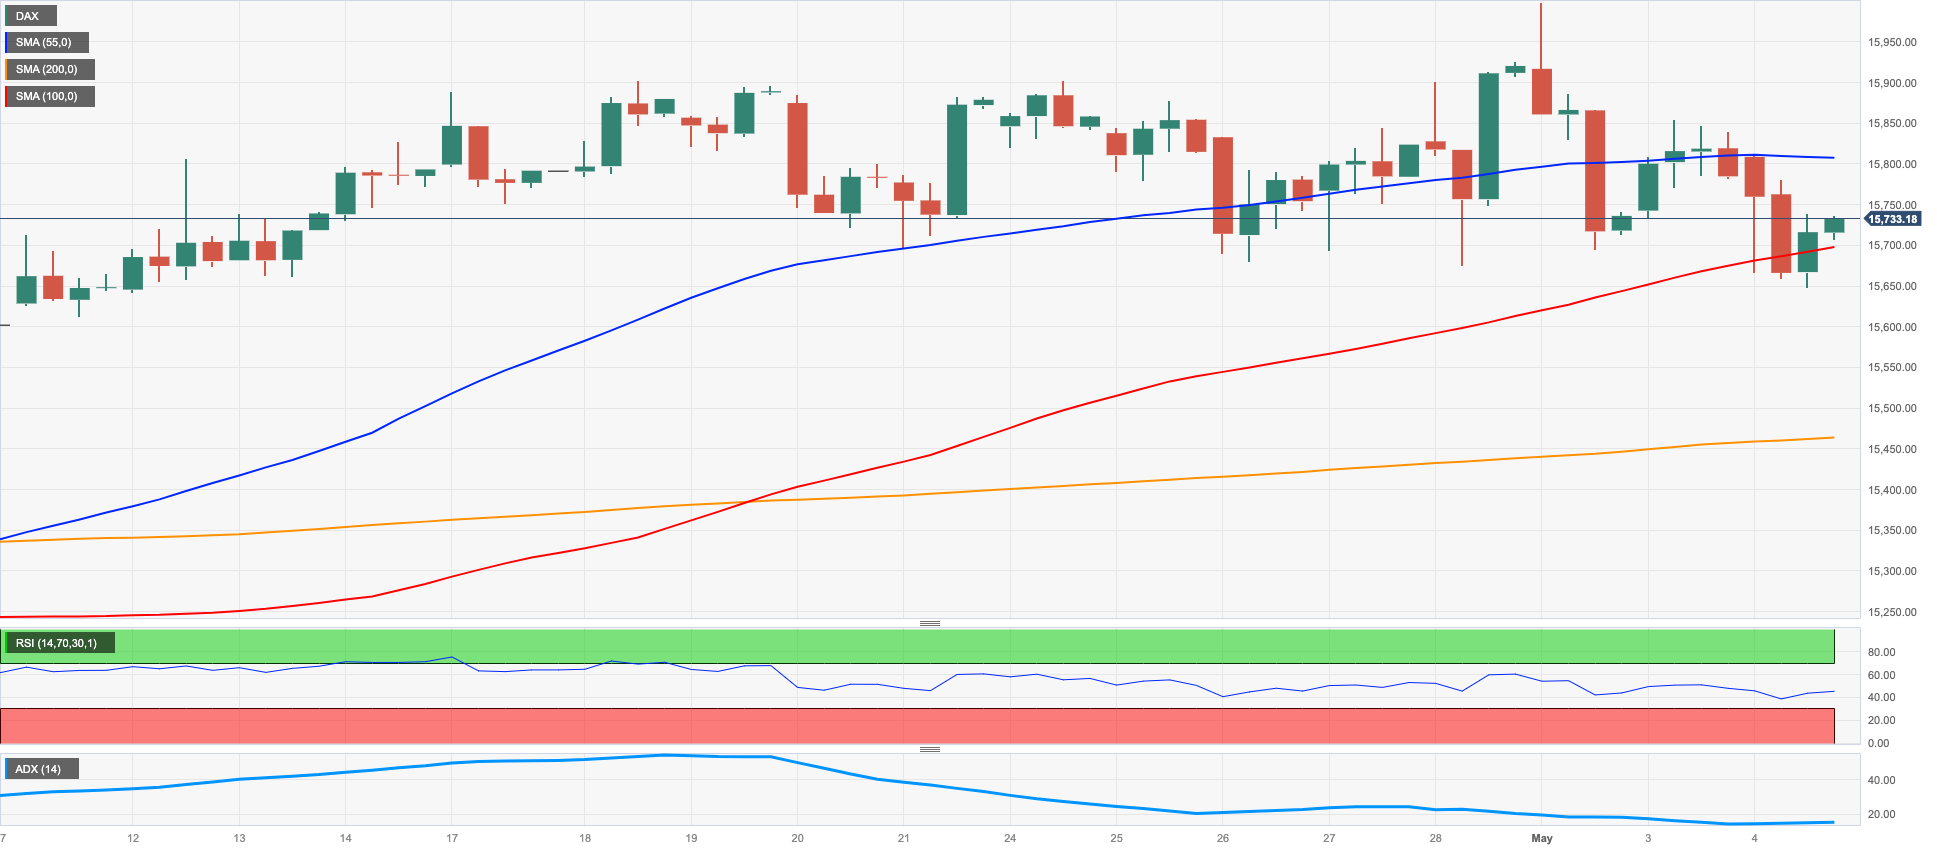
GER40
European markets were hit across the board on Thursday, following what was perceived as a hawkish message from the ECB at its event earlier in the day. As a result, German stocks tracked by the DAX40 dropped to multi-day lows near the 15600 region, before rebounding and ending the session just above 15700, which is within the prevailing consolidation since mid-April.
The ECB's decision to raise rates by 25 bps was widely anticipated, and leaving the door open to further hikes in the future, seemed to dampen fresh buying sentiment in the markets. The markets are already betting on two more hikes in June and July as the most likely candidates.
In the bond market, the 10-year benchmark Bund yields retreated for the third consecutive session, breaking below the 2.20% region.
In Germany, the trade surplus increased to €16.7B in March and the final Services PMI improved to 56.0 in April (from 53.7).
The 2022 peak at 16285 (January 5) may be threatened if the DAX40 is able to rise over the 2023 high at 16011 (May 2). In contrast, the provisional 55-day SMA (15483) is currently supporting the April low at 15482 (April 5), with the temporary 100-day SMA at 15145 acting as the next potential support level if the index continues to fall. The small support at 14809 (March 24), the March low at 14458 (March 20), and the important 200-day SMA at 14228 might all reappear with a further pullback. The daily RSI deflated below the 50 mark.
Best Performers: Qiagen, BMW ST, Deutsche Boerse
Worst Performers: Daimler, Zalando SE, MTU Aero
Resistance levels: 16011 16090 16285 (4H chart)
Support levels: 15662 15482 15453 (4H chart)
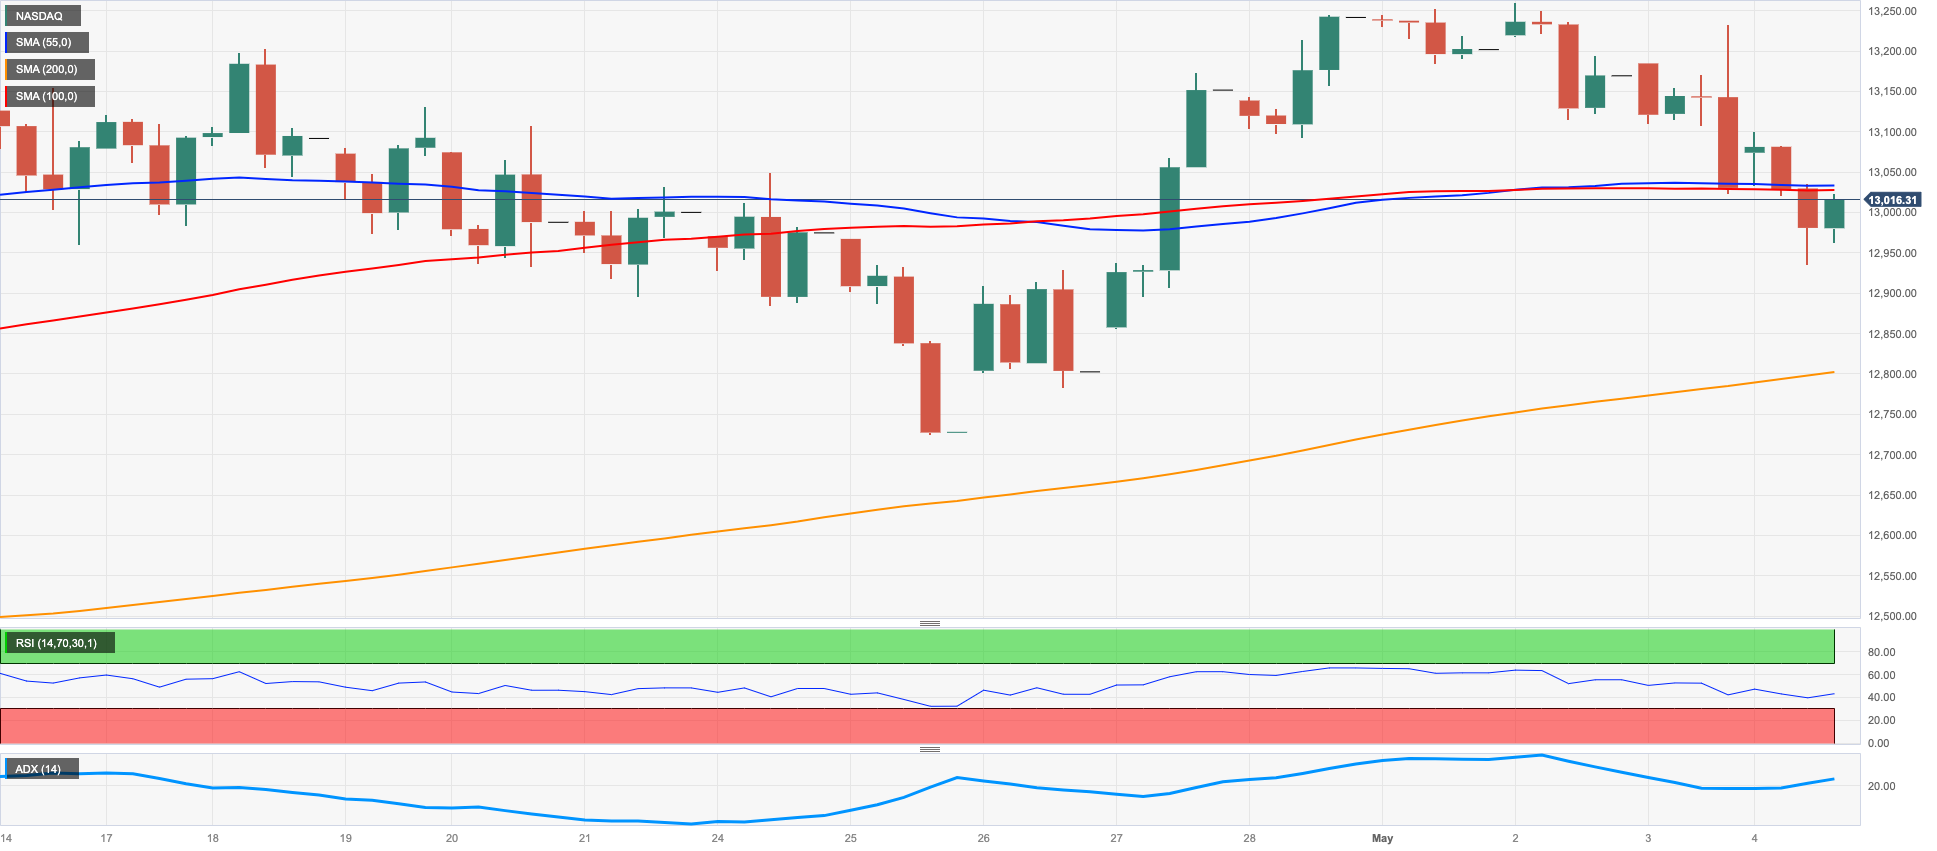
NASDAQ
The Nasdaq 100, the tech reference index, followed its US peers and fell to multi-day lows in the sub-13000 range on Thursday.
The index has been retracing since Monday and has been under pressure due to renewed concerns about the US banking system, while the poor performance of megacap Apple (ahead of the publication of corporate earnings after the closing bell in Wall St.) has also contributed to Thursday's pullback
The Nasdaq 100 started the month well on the defensive so far, almost fully retracing the strong advance seen in late April. Against that, the April low of 12724 (April 25) is expected to provide initial support in case the downward momentum gathers impulse. If this level is breached, the provisional 55-day SMA at 12647 and the weekly low at 12517 (March 28) may provide further support. A break below these levels could lead to the key 200-day SMA at 12076, prior to the March low at 11695 (March 13) and weekly lows at 11550 (January 25) and 11251 (January 19). Finally, extra weakness could challenge the 2023 low at 10696 (January 6). On the opposite side, the immediate resistance level remains at the 2023 high of 13287 (May 1) before the August 2022 top of 13720 (August 16) and the key round level of 14000. If upward momentum continues, the March 2022 peak of 15265 (March 29) could be the next target. The daily RSI deflated to the proximity of the 52 region.
Top Gainers: Datadog, Cognizant A, Moderna
Top Losers: Regeneron Pharma, Warner Bros Discovery Inc, Qualcomm
Resistance levels: 13287 13720 14277 (4H chart)
Support levels: 12938 12724 12517 (4H chart)
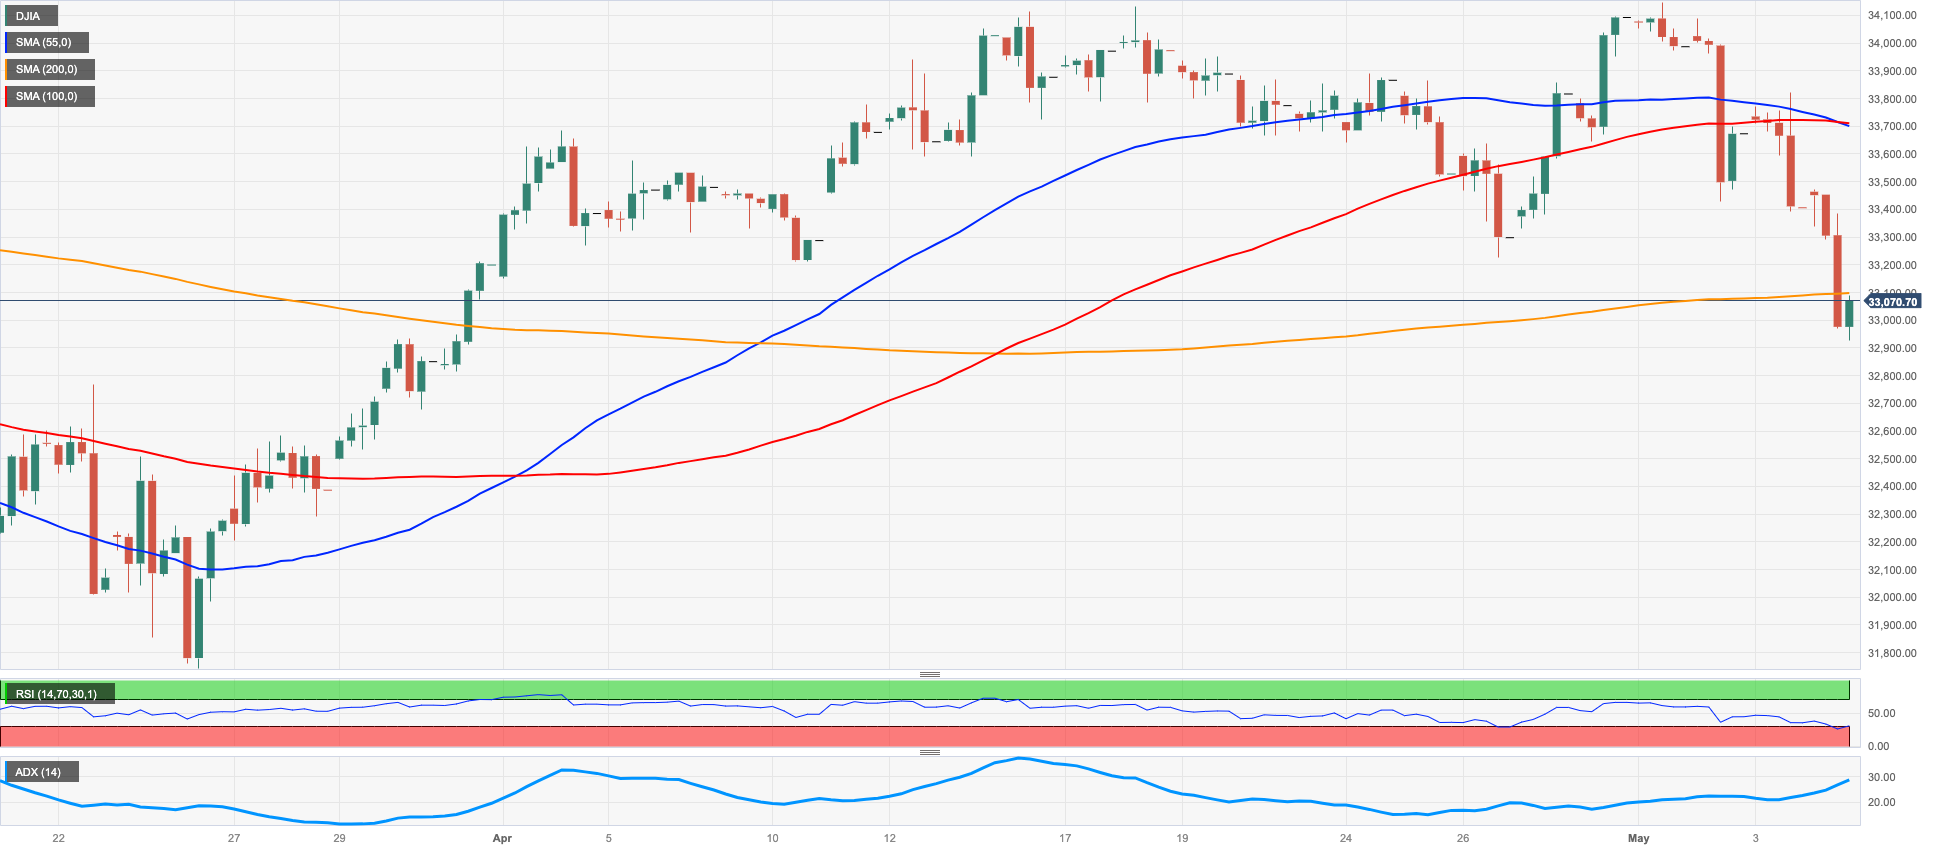
DOW JONES
Renewed banking concerns – this time with lender PacWest Bancorp taking centre stage – neutralized any optimism stemming from Wednesday’s FOMC event, where the Fed raised the Fed Funds Target Range (FFTR) by 25 bps as expected and signaled it might pause its hiking cycle as soon as in June.
Against that, US equities measured by the three major benchmark indices retreated markedly and clinched new multi-week lows on Thursday amidst the improved mood in the greenback and diminishing yields.
Overall, the tech-reference Nasdaq Composite increased 0.17% to 12147, the S&P500 declined 0.15% to 4111, and the Dow Jones fell 0.65% to 33465.
The Dow Jones clocked a new monthly low at 32967 (May 4), rapidly breaching the provisional contention levels at the 100- and 55-day SMAs at 33339 and 33117, respectively. Prior to the 2023 low at 31429 (March 15) and the 2022 low at 28660 (October 13), the important 200-day SMA at 32707 may offer additional support if the index continues to move down. The first obstacle on the upside, in the meantime, comes at the May high of 34257 (May 1), which is followed closely by the 2023 top of 34342 (January 13) and the December 2022 peak of 34712 (December 13). The April 2022 high of 35492 could be reached if the latter is broken above. The daily RSI plummeted to the 41 region.
Top Performers: Intel, Amgen, Microsoft
Worst Performers: Walt Disney, American Express, Boeing
Resistance levels: 33335 34257 34334 (4H chart)
Support levels: 32961 31805 31429 (4H chart)
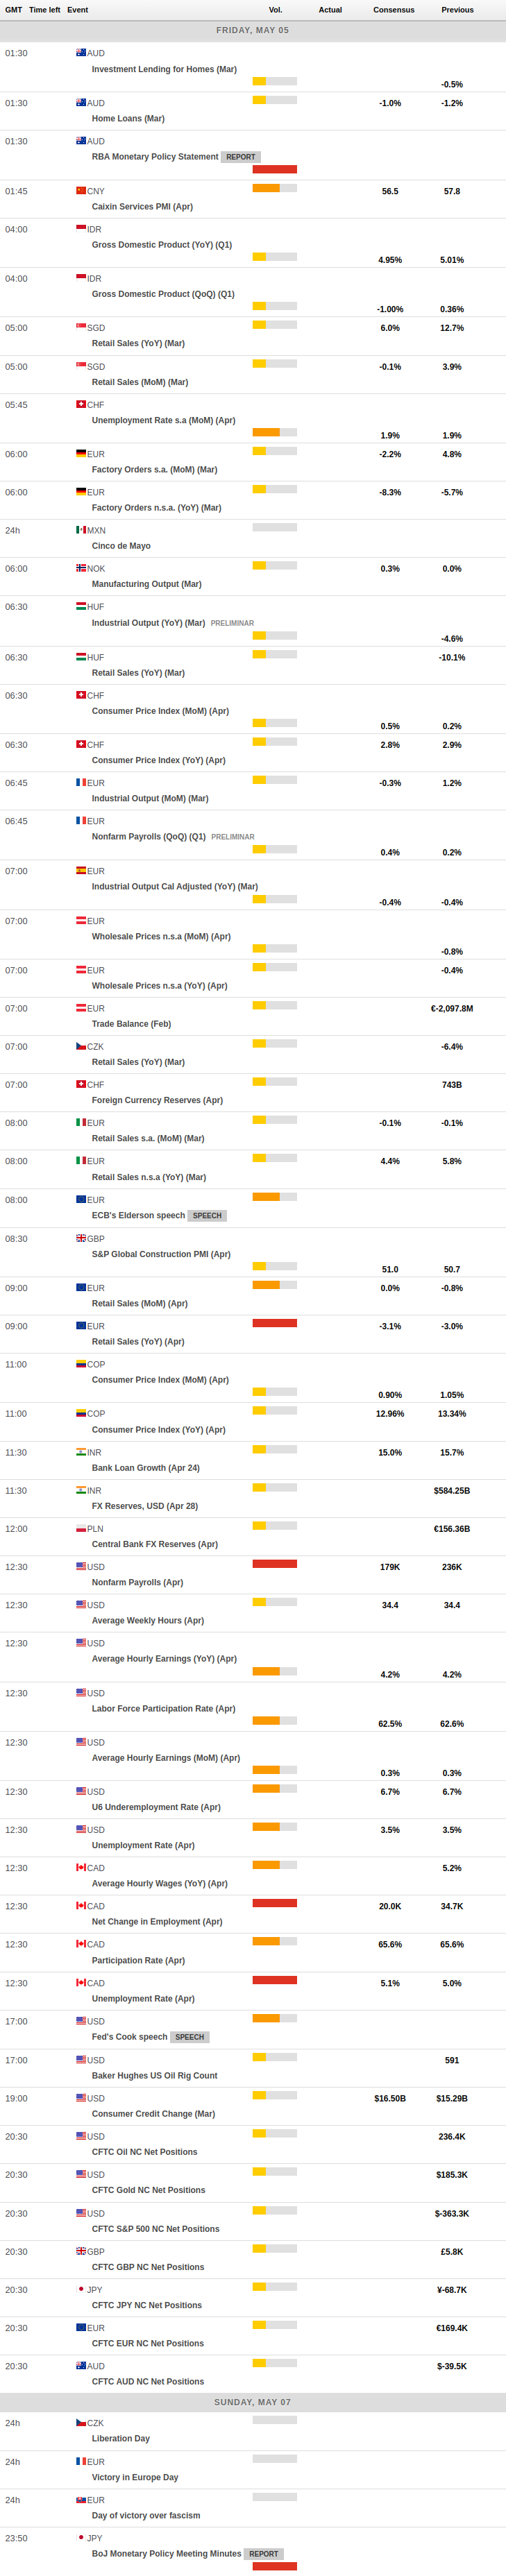
MACROECONOMIC EVENTS
All Information & Updates provided by:

All information relating to the financial markets available on this page has been prepared and issued by FXStreet (Forexstreet SL, Spain, Reg: B62498233) on the basis of publicly available information and all information believed to be reliable and does not conflict with Kuwaiti local laws, and all necessary care has been taken to before the company to ensure that the facts mentioned are correct from the source.
NCM Investment nor any of its directors or employees shall in any way be held responsible for the contents of this news, and the information contained on this page is intended only to provide clients with publicly available information and should not be construed as investment advice, report or analysis and/or constitute an offer or invitation to buy or sell financial instruments of any kind.
RISK WARNING: Forex and CFDs are highly risky leveraged products, as losses can exceed deposits. Please ensure you understand all the risks and take independent advice if necessary. NCM will segregate the clients based on the criteria of the regulator and its bylaws. NCM does not provide any advisory service; the material published does not constitute advice or a recommendation for a transaction in any financial instrument. NCM accepts no responsibility for any use of the content presented and any consequences of that use. Anyone acting on the information provided does so at their own risk.