
- Contact Us:
-

-

-

-


Daily Market Updates
08 May 2023
USDJPY
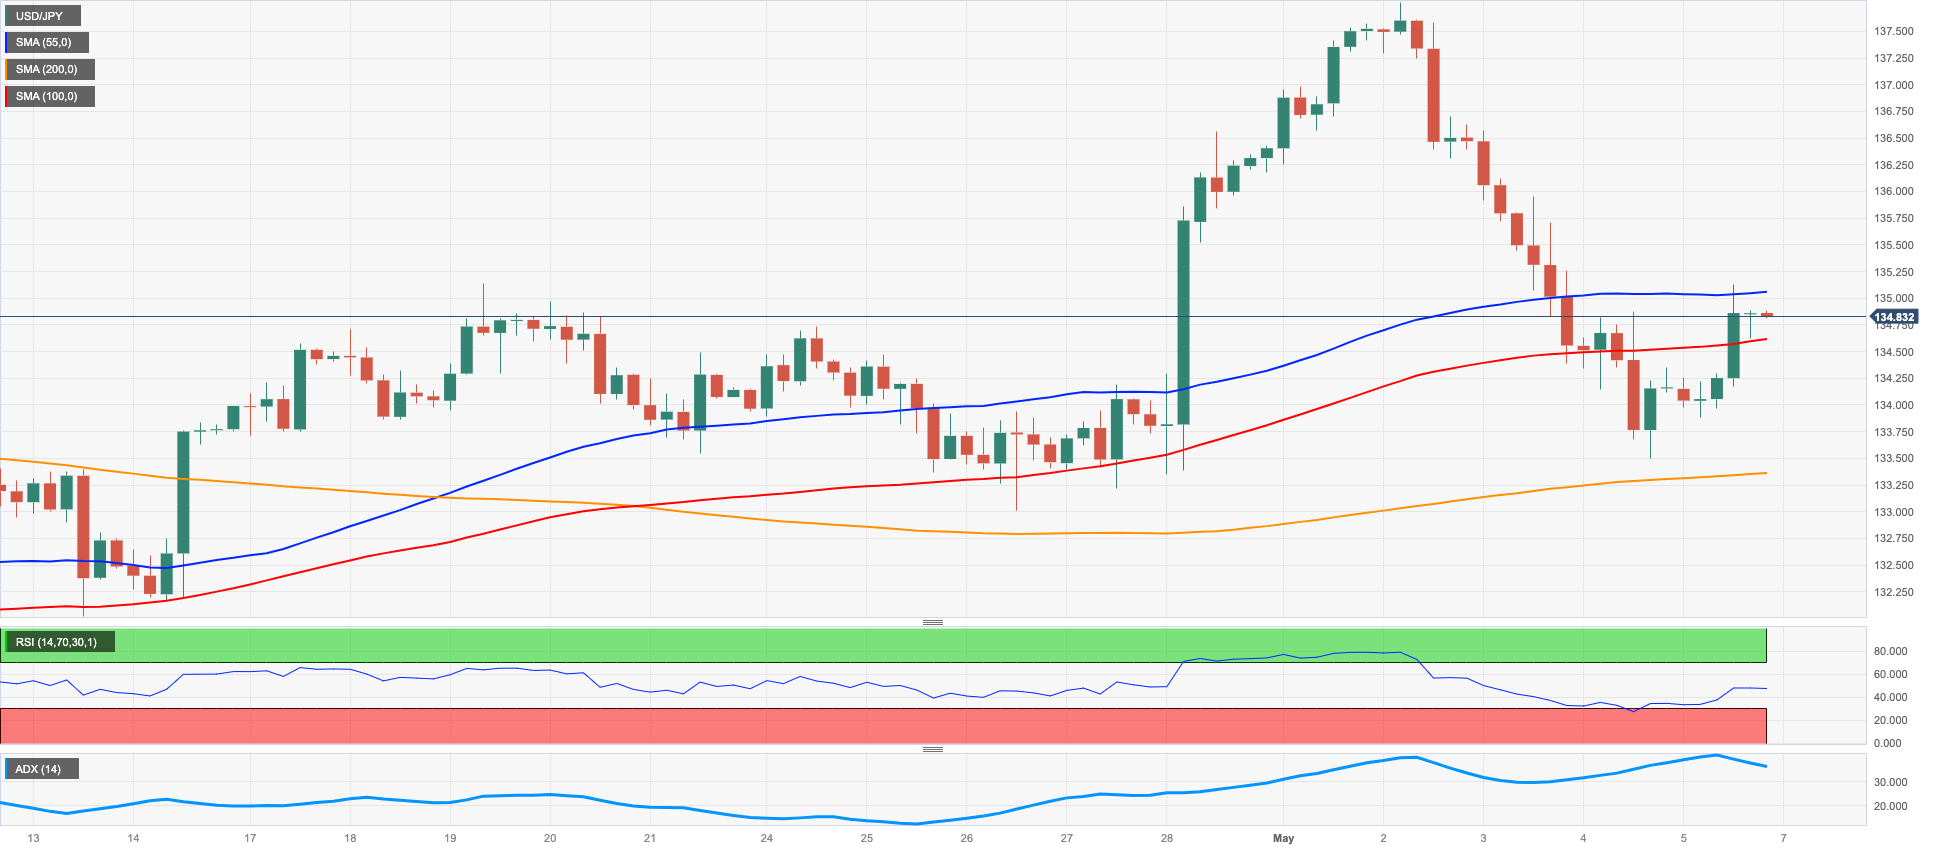
Finally, some respite for the USD/JPY came in the form of a marked rebound on Friday.
In fact, after three straight sessions with losses, spot managed to regain composure and stage a noticeable comeback from weekly lows in the mid-133.00s (May 4) to the 134.80 region seen on Friday.
The daily bounce in the pair was accompanied by the corrective uptick in US yields across the curve and despite the USD Index (DXY) drifting lower, while the Japanese bond market saw the JGB 10-year yields extend the range bound theme above 0.40%.
There were no data releases scheduled in the “Land of the Rising Sun”.
In the event of additional losses, USD/JPY is expected to revisit the weekly low of 133.01 (April 26), which is supported by the provisional 100-day SMA at 132.80 and comes before the minor level at 132.01 (April 13). Further down, the April low of 130.62 (April 5) is followed by the March low of 129.63 (March 24) and the February low of 128.08 (February 8). The 2023 low of 127.21 (January 16) is the next downside target. On the flip side, the immediate hurdle emerges at the 200-day SMA at 136.97 prior to the May peak of 137.77 (May 2) and the 2023 top of 137.91 (March 8). Extra gains could revisit the weekly tops of 139.89 (November 30, 2022) and 142.25 (November 21, 2022). The daily RSI picked up pace and trespassed 53.
Resistance levels: 135.12 137.77 137.91 (4H chart)
Support levels: 133.49 133.01 132.01 (4H chart)
GBPUSD
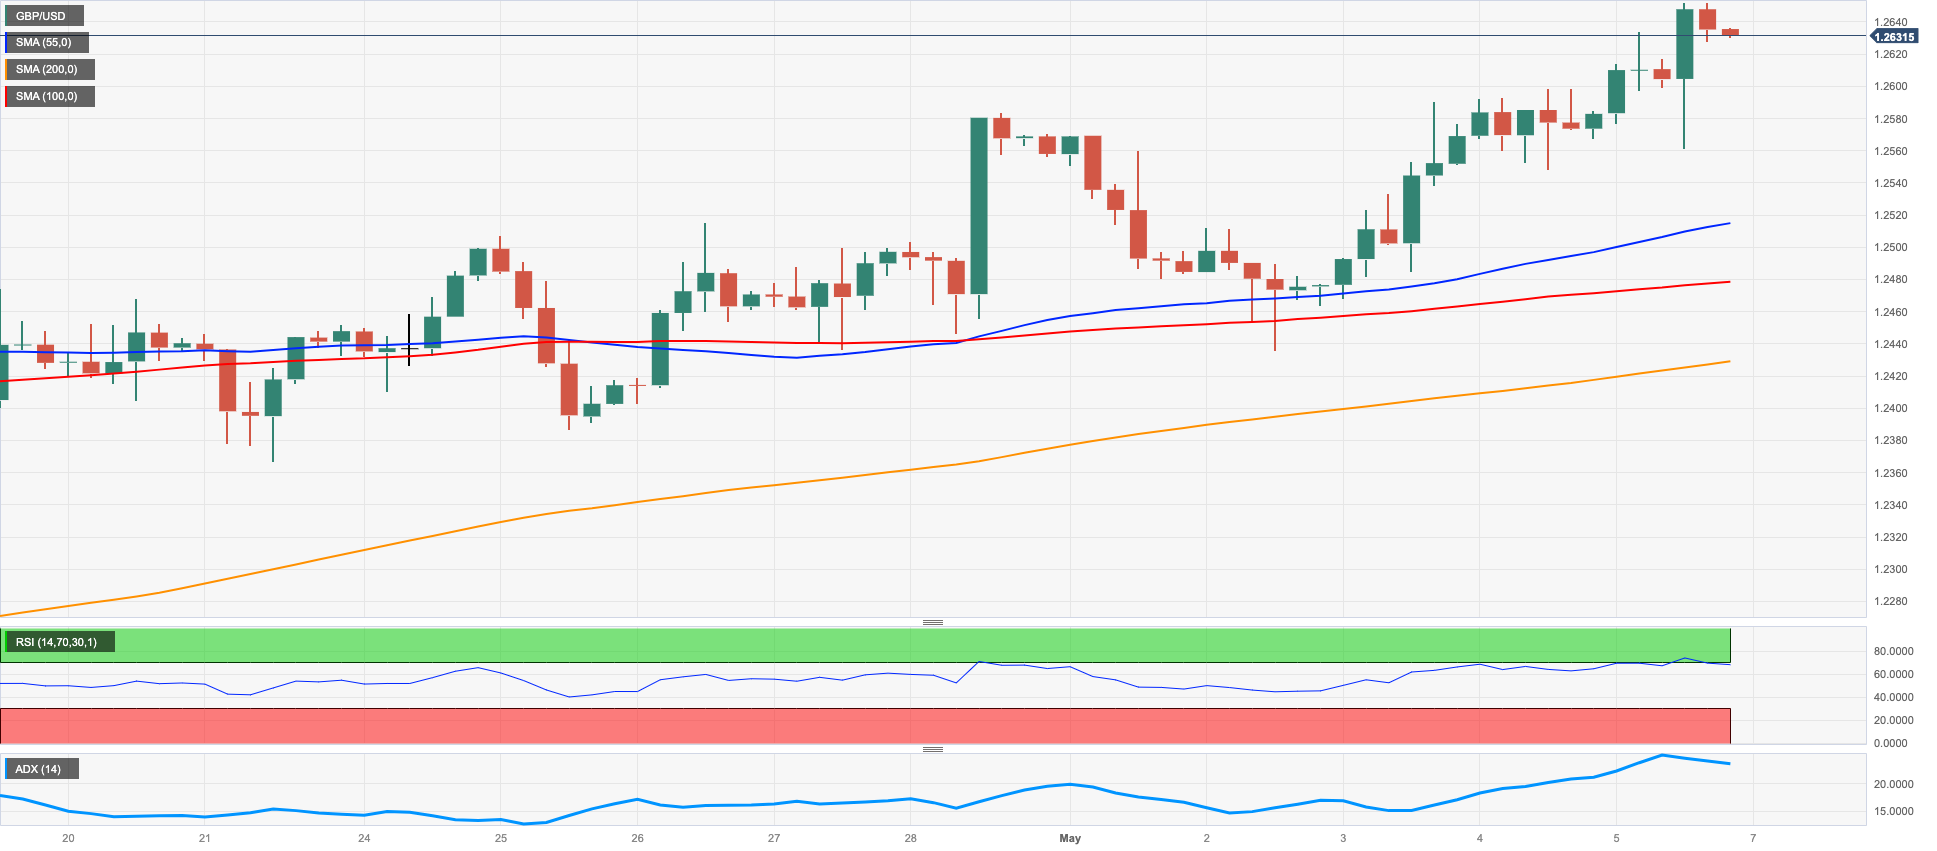
GBP/USD extended further its positive momentum, this time reaching levels last seen nearly a year ago well north of 1.2600 the figure. On a weekly basis, Cable closed the 8th consecutive week with gains for the first time since early-October/late-November 2004.
The main catalyst of the outstanding performance of the British pound in these past weeks can be found in the gradual decline in the US dollar as well as speculation that the BoE has still further to say when it comes to tightening its policy.
In the UK, the Construction PMI improved to 51.1 in April (from 50.7).
GBP/USD hit a fresh high for 2023 at 1.2652 on May 5, with buyers remaining focused on the May 2022 top at 1.2666 (May 27), the 200-week SMA at 1.2865, and the psychological level of 1.3000. Just the opposite, the immediate support level for Cable is at 1.2344 (April 10), which if breached, could put a test of the April low at 1.2274 (April 3) back on the radar, which appears underpinned by the interim 55-day SMA (1.2276). Further downside could potentially see spot drop to the key 200-day SMA at 1.1948, followed by the 2023 low at 1.1802 (March 8). The RSI surpassed the 64 barrier.
Resistance levels: 1.2652 1.2666 1.2772 (4H chart)
Support levels: 1.2547 1.2509 1.2435 (4H chart)
AUDUSD
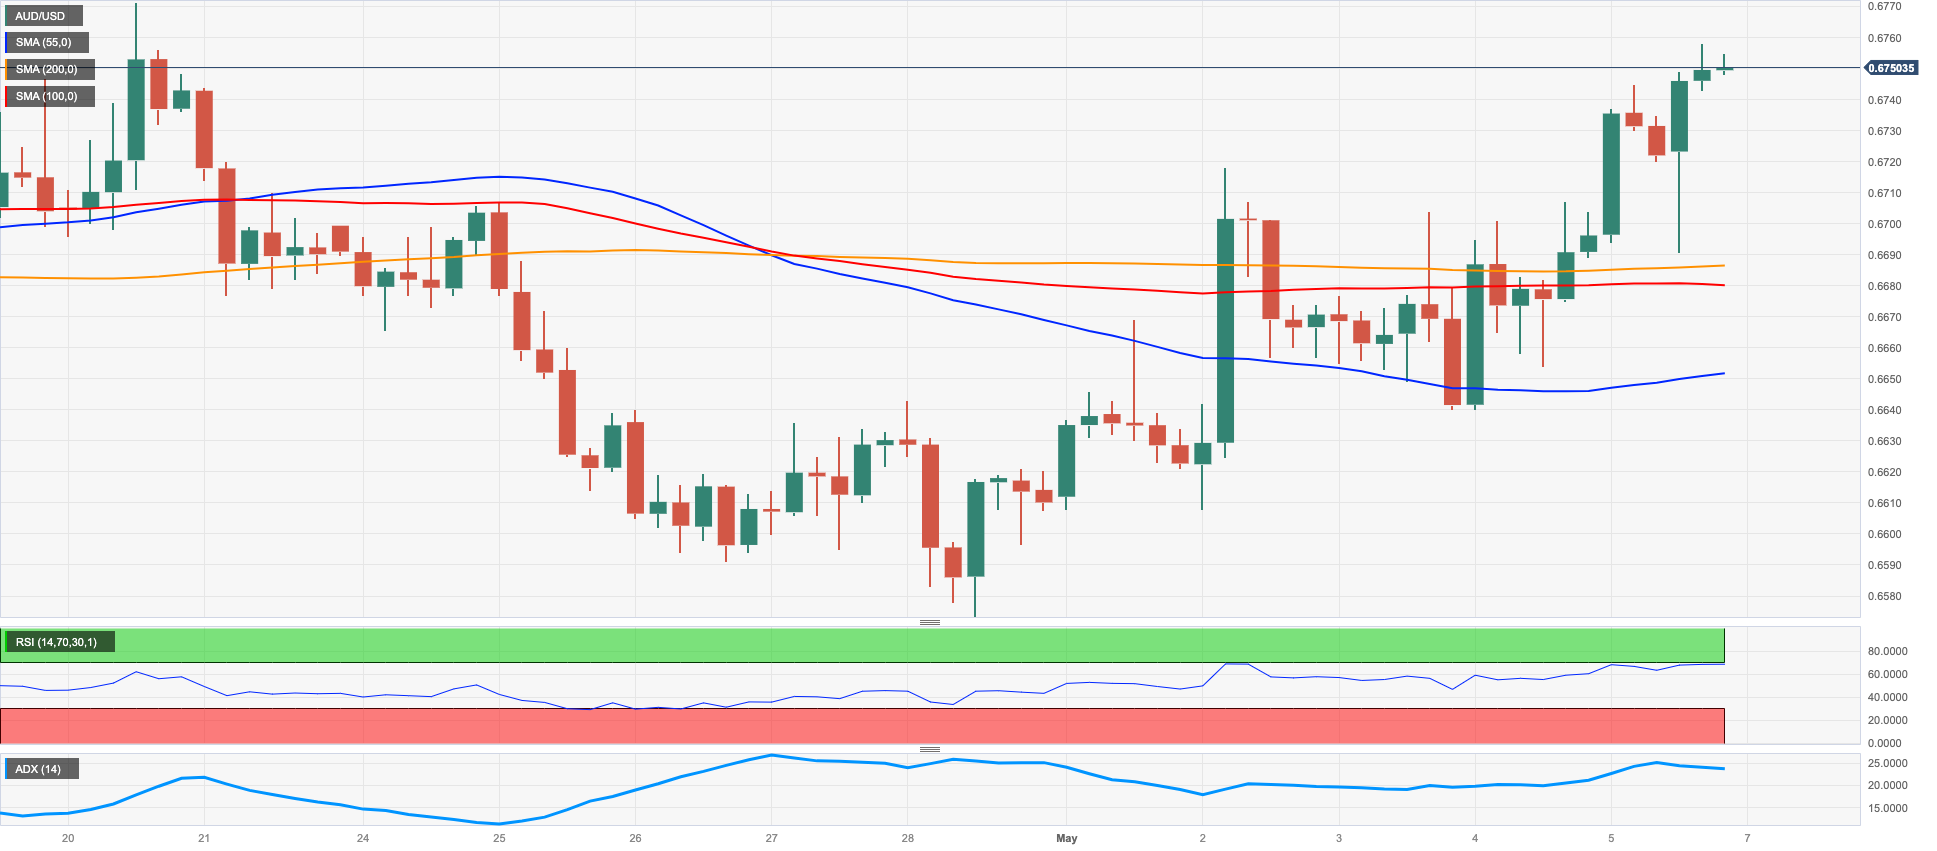
It was a positive week for the Aussie dollar overall.
Indeed, AUD/USD closed with gains in every session this week, managing to advance to 2-week highs past the 0.6750 region on Friday against the backdrop of persistent weakness in the greenback.
Also adding to the upbeat tone around the high-beta currency emerged the generalized optimistic session in the commodity complex in spite of the daily losses in the iron ore.
From the RBA, the Statement on Monetary Policy (SoMP) showed the central bank revised down its projections for growth and inflation, while the path for unemployment was reassessed to the upside across the forecast horizon.
Data wise Down Under, Home Loans expanded 5.5% MoM in March and Investment Lending for Homes rose 3.7% in March.
The AUD/USD left behind the key 200-day SMA (0.6727) and in doing so it has opened the door to extra gains. That said, the subsequent targets will be the weekly top at 0.6771 (April 20) and the April high at 0.6805 (April 14). Additionally, the key round level at 0.7000 is a potential target, ahead of the weekly top at 0.7029 (February 14) and the 2023 peak at 0.7157 (February 2). On the contrary, there is a possibility of a decline to the April low of 0.6573 (April 28), prior to the 2023 low at 0.6563 (March 10) and the weekly low at 0.6386 (November 10, 2022). The last level of support is the November 2022 low at 0.6272 (November 3). The daily RSI advanced past the 58 yardstick.
Resistance levels: 0.6757 0.6771 0.6805 (4H chart)
Support levels: 0.6685 0.6640 0.6620 (4H chart)
GOLD
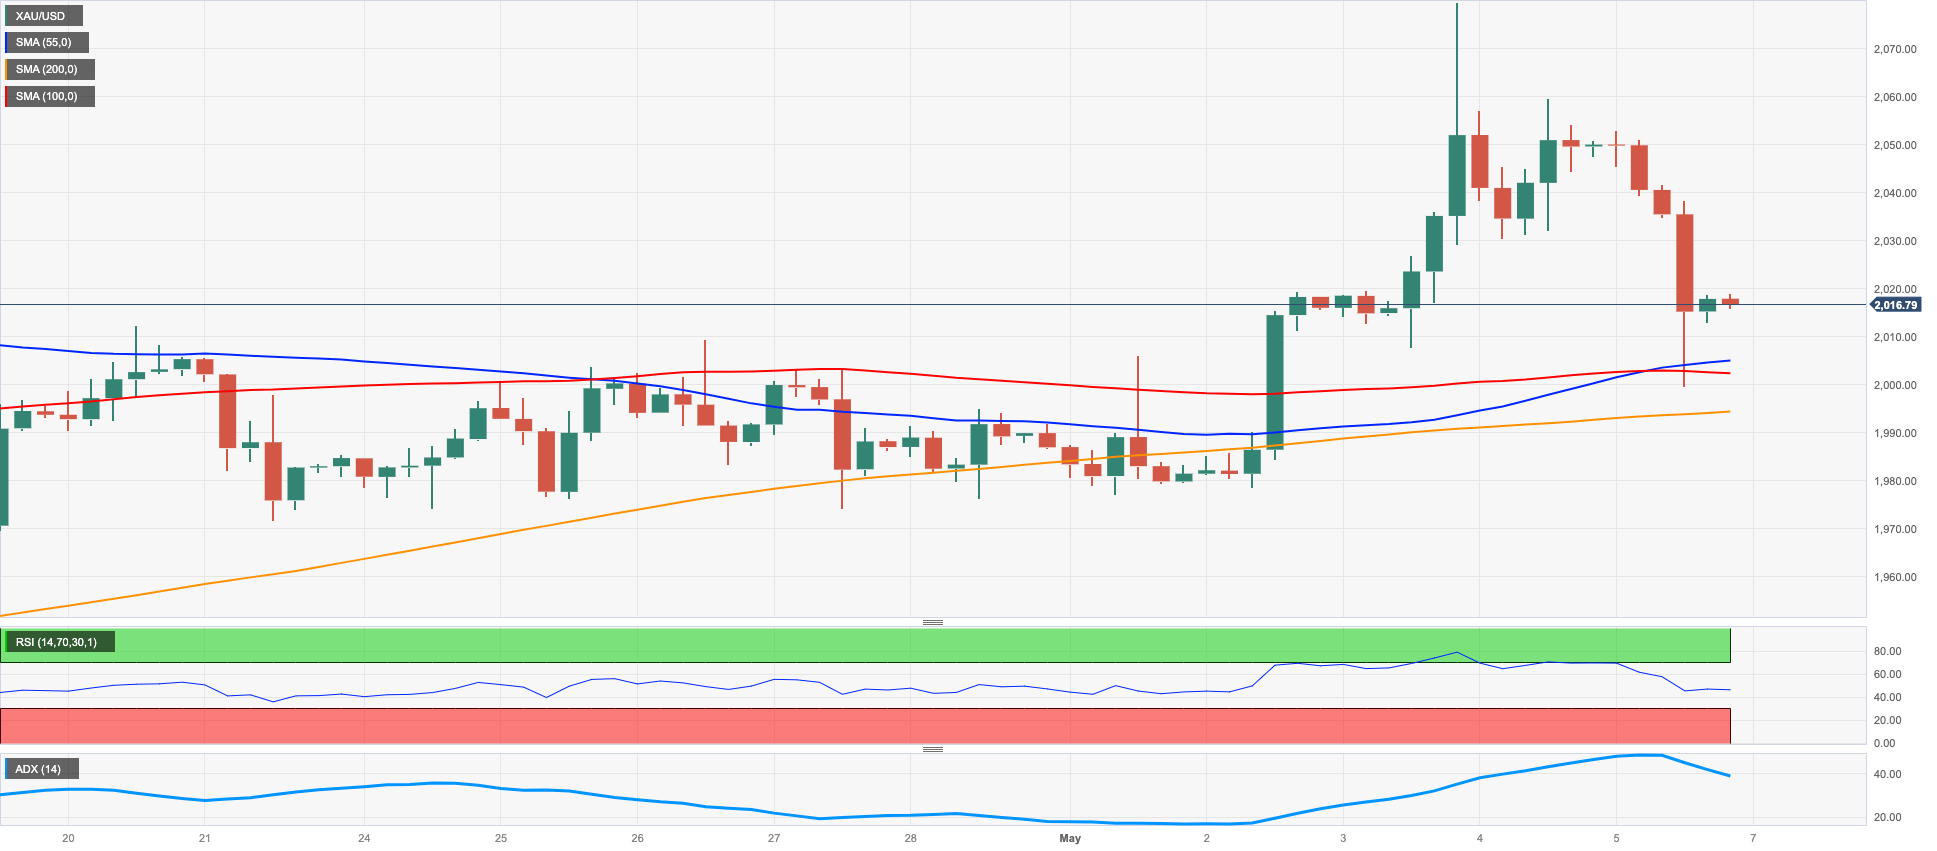
Prices of the ounce troy of the yellow metal reversed three daily gains in a row – including a new 2023 high at $2067 on May 4 – at the end of the week.
Furthermore, bullion briefly dipped just below the key $2000 mark before regaining some traction and ending the session with noticeable losses near $2015. ON a weekly basis, the precious metal charted the second advance in a row and seems to have embarked on a consolidative fashion for the time being.
The stronger-than-expected US jobs report poured cold water over expectations of a Fed’s potential pause at the June gathering amidst the current data-dependent stance from the central bank.
By the same token, US yields added to gains seen in the second half of the week and put the metal under further pressure, while the persistent selling bias in the dollar seems to have limited the downside somewhat on Friday.
Should the price of gold continue to increase, it will encounter resistance at various levels, with the 2023 high of $2067 (May 4) being the first hurdle, followed closely by the 2022 peak of $2070 (March 8) and the historical high of $2075 (August 7, 2020). On the contrary, if the ounce troy drops below the weekly low of $1969 (April 19), it may decline to the April low of $1949 (April 3) and then find provisional support at the 55- and 100-day SMAs at $1941 and $1908, respectively. Further downside could potentially see the price of gold retreat to the March low of $1809 (March 8) and ultimately to the 2023 low of $1804 (February 28).
Resistance levels: $2067 $2070 $2075 (4H chart)
Support levels: $1999 $1969 $1949 (4H chart)
CRUDE WTI
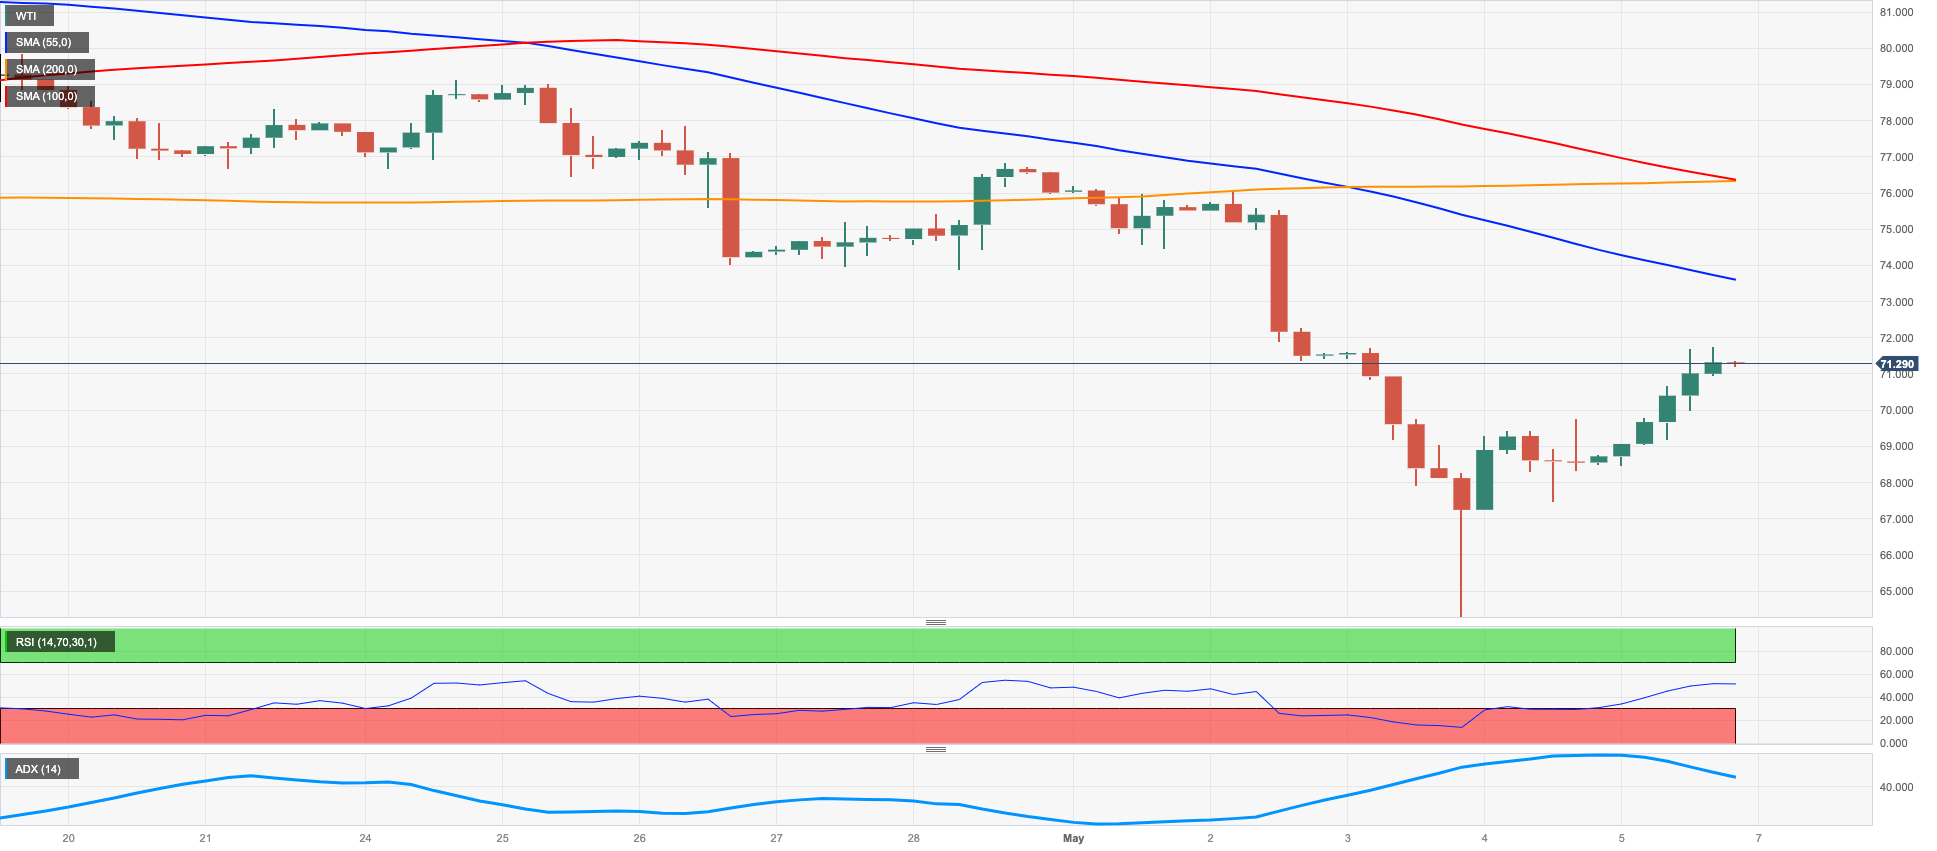
Prices of the WTI extended Thursday’s bounce and flirted with the $72.00 mark just to close around $71.30 at the end of the week.
The recovery seen in the second half of the week, however, did not prevent the commodity from closing the third week in a row with losses and approaching the key 200-week SMA ($66.86).
Crude oil regained traction on the back of alleviated recession concerns, which were in turn sparked after the solid prints from the US jobs report for the month of April. The offered stance in the greenback, in addition, was another driver of the daily uptick as well as rising speculation that the OPEC+ might announce another output cut at the cartel’s meeting next month.
In the docket, driller Baker Hughes said the oil rig count went down by 3 in the week to May 5, taking the US total active oil rigs to 588.
Crude oil prices remain under pressure despite the recent bounce. That said, the barrel of the WTI hit a new low for 2023 at $63.73 (May 4). If the December 2021 low of $62.46 (December 2) is reached, the commodity may fall even further to the key $60.00 mark per barrel. By contrast, sporadic bullish attempts are anticipated to confront resistance at the weekly high of $79.14 (April 24), which is in proximity to the critical $80.00 level. Following this, the 200-day SMA at $81.29 would come into play. If the commodity surpasses this level, it may aim for the 2023 top of $83.49 (April 12), prior to reaching the November 2022 peak of $93.73 (November 7).
Resistance levels: $71.77 $76.88 $79.14 (4H chart)
Support levels: $63.61 $62.42 $61.72 (4H chart)
GER40
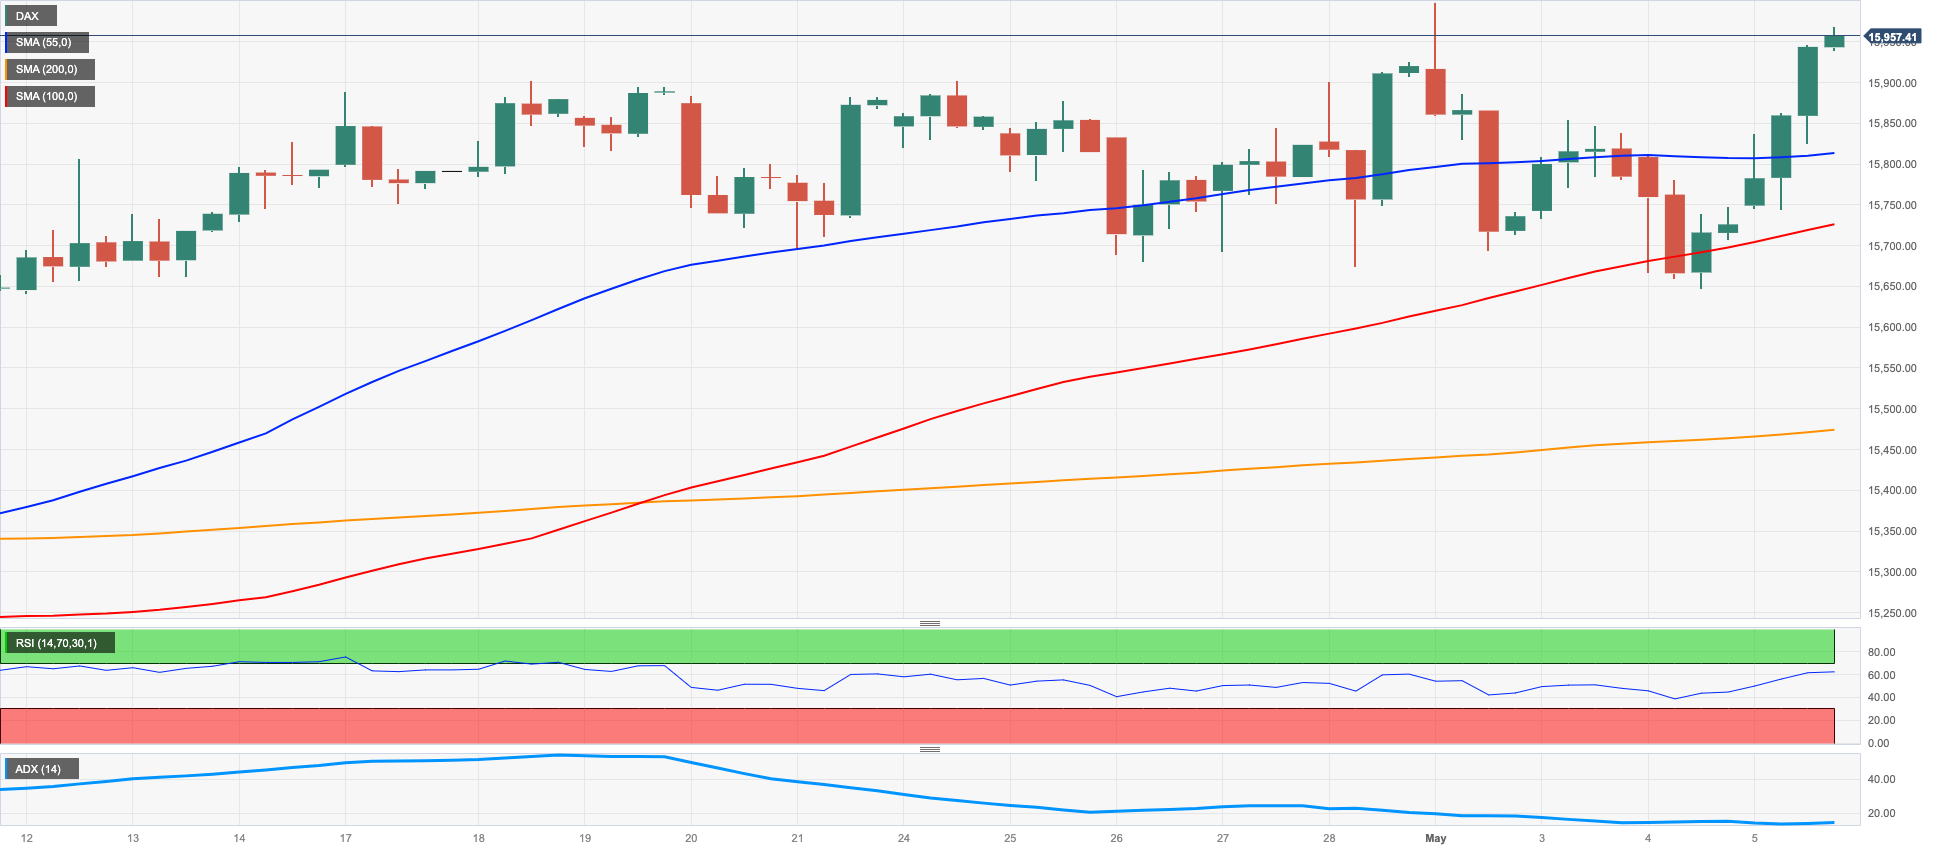
Markets on the old continent finished Friday's session on a high note, with Germany's DAX40 approaching the crucial 16000 mark once more.
Investors’ optimism was once again propped up by positive financial results of European blue-chip companies, while another strong US jobs report helped to boost investor confidence and alleviate concerns about a possible US recession for the time being.
In the meantime, the uptick in the DAX40 came in line with the rebound in the German 10-year Bund yields to the 2.30% area after three daily red sessions in a row.
Data wise in Germany, the Construction PMI eased to 42.0 in April and Factory Orders disappointed big time after a 10.7% contraction in March.
If the DAX40 manages to surpass the 2023 high at 16011 (May 2), the 2022 peak at 16285 (January 5) may come under threat. Having said that, the interim 55-day SMA at 15494 is currently providing support for the April low at 15482 (April 5), while the provisional 100-day SMA at 15163 could serve as the next potential contention zone if the index continues to decline. A further pullback might bring back the minor support at 14809 (March 24), the March low at 14458 (March 20), and the key 200-day SMA at 14242. The daily RSI edged higher and surpassed the 60 mark.
Best Performers: Adidas, Covestro, Commerzbank
Worst Performers: Deutsche Post, Allianz, RWE AG ST
Resistance levels: 16011 16090 16285 (4H chart)
Support levels: 15662 15482 14809 (4H chart)
NASDAQ
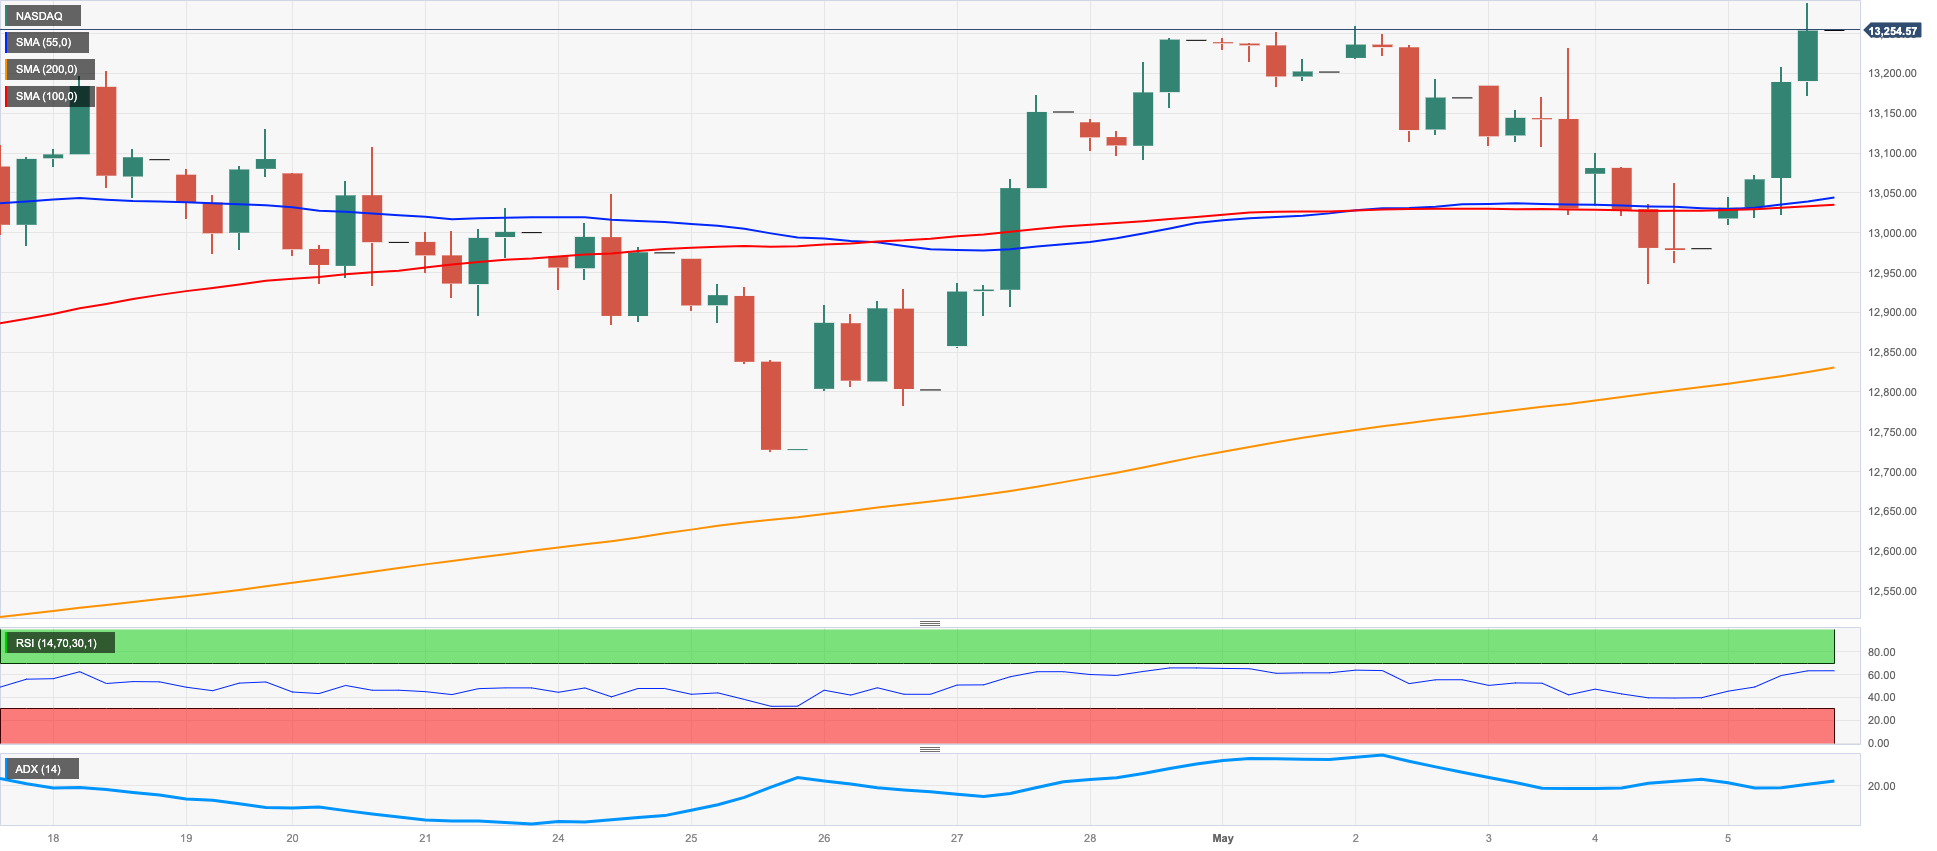
On Friday, the Nasdaq 100 closed with gains for the first time this week, having risen to levels last seen in mid-August 2022 around the 13300 region.
At the end of the week, positive corporate results from Apple, along with reduced concerns about the banking industry and optimism that the US economy could avoid a recession, contributed to the upward momentum in the US tech sector.
Moreover, the positive sentiment was further bolstered by the offered stance of the US dollar, leading to a partial reversal of the recent downward movement in the index.
The Nasdaq 100 has had a defensive start to the month, undoing much of the strong advance it made in late April. However, the index clinched a new 2023 high at 13291 on May 5. The surpass of this region could lead up to a test of the August 2022 peak of 13720 (August 16) and the significant round level of 14000. If upward momentum continues, the next target could be the March 2022 top of 15265 (March 29). The other way around, and in the event that the downward momentum gains steam, the April low of 12724 (April 25) is expected to offer initial support ahead of the provisional 55-day SMA at 12657 and the weekly low at 12517 (March 28). A drop below these levels could lead to the critical 200-day SMA at 12080, before the March low at 11695 (March 13) and weekly lows at 11550 (January 25) and 11251 (January 19). Further weakness, in the meantime, could challenge the 2023 low at 10696 (January 6). The daily RSI jumped to the boundaries of the 60 zone.
Top Gainers: Fortinet, Tesla, Diamondback
Top Losers: Atlassian Corp Plc, PDD Holdings DRC, Booking
Resistance levels: 13291 13720 14277 (4H chart)
Support levels: 12938 12724 12517 (4H chart)
DOW JONES
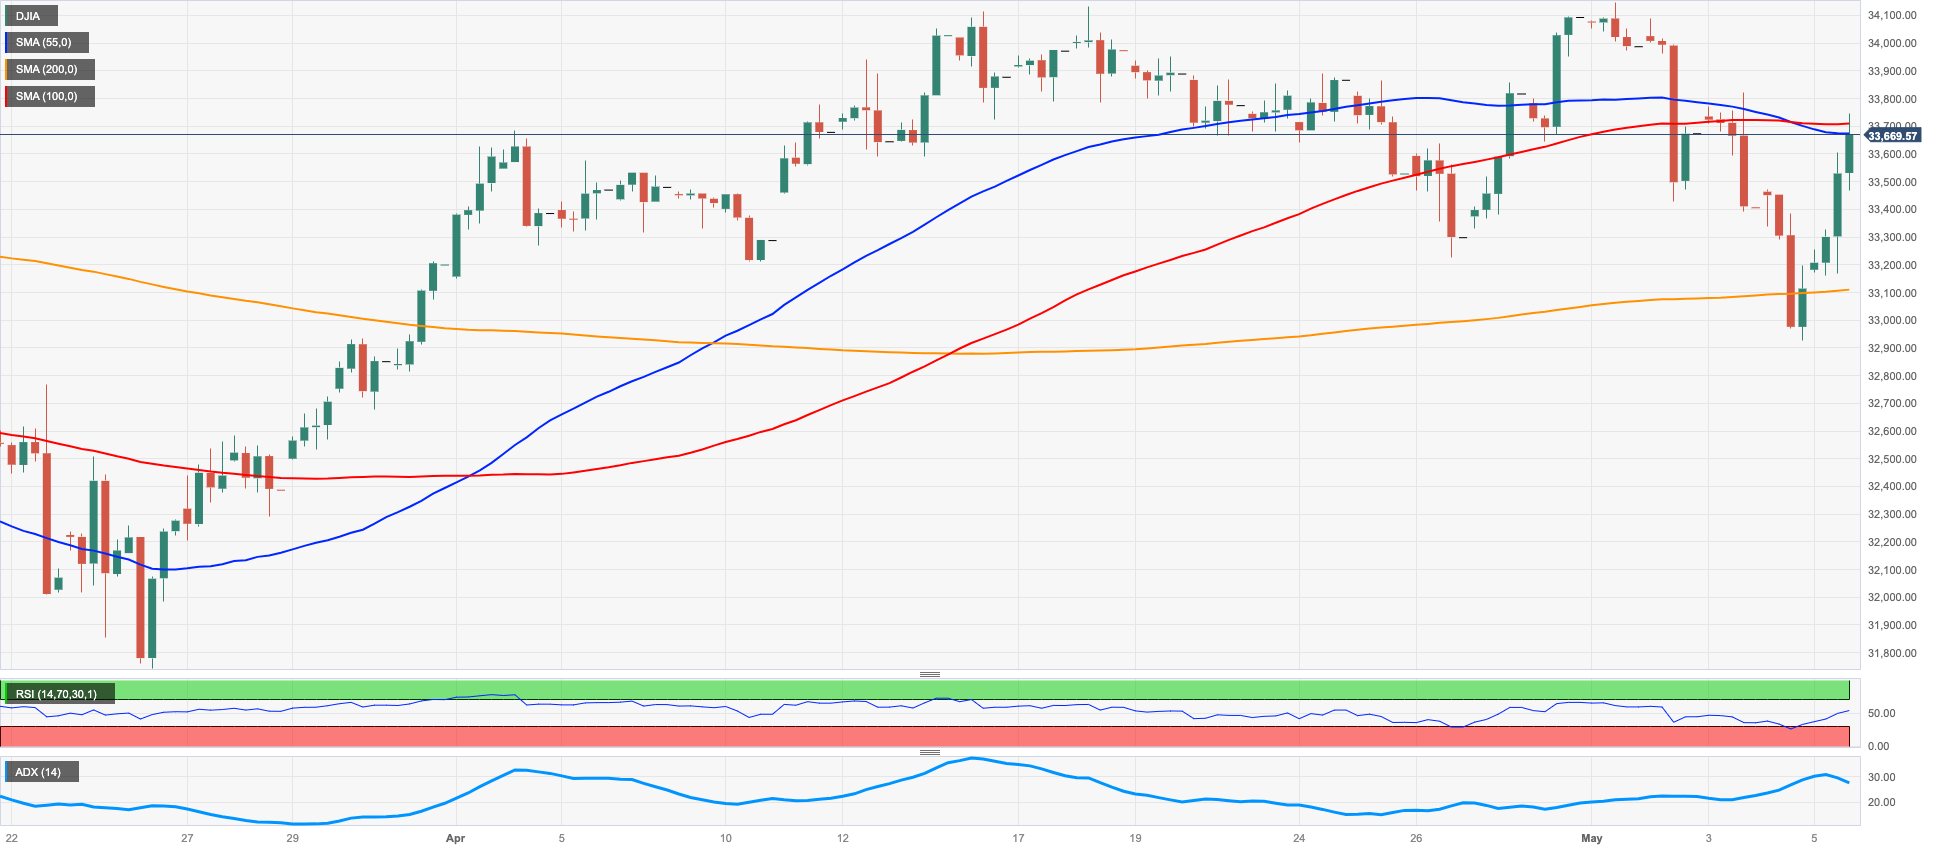
A very positive session saw the three major US stock indices advance markedly at the end of the week, as the tech-heavy Nasdaq Composite rose 2.25% to 12235, the S&P500 gained 1.85% to 4136, and the Dow Jones climbed 1.65% to 33674.
The buying interest prevailed among traders on Friday, boosted by better-than-expected earnings results from megacap Apple, while mitigated banking fears also added to the sentiment.
In addition, firm readings from the US Nonfarm Payrolls for the month of April emphasized once again the resilience of the labour market and seem to have also spooked the spectre of an economic slowdown for the time being.
Further recovery in the Dow Jones should meet the first barrier at the May top of 34257 (May 1), which precedes the 2023 peak of 34342 (January 13) and the December 2022 peak of 34712. (December 13). If the previous top is broken, the April 2022 high of 35492 could be reached. Meanwhile, immediate contention aligns at the May low of 32967 (May 4), before the key 200-day SMA at 32717. Down from here, the 2023 low at 31429 (March 15) may provide additional support prior to the 2022 low at 28660 (October 13). The daily RSI leapt past the 52 level.
Top Performers: Apple, Walt Disney, Visa A
Worst Performers: Intel, Merck&Co, Procter&Gamble
Resistance levels: 33811 34257 34334 (4H chart)
Support levels: 33333 32937 31805 (4H chart)
MACROECONOMIC EVENTS

All Information & Updates provided by:

All information relating to the financial markets available on this page has been prepared and issued by FXStreet (Forexstreet SL, Spain, Reg: B62498233) on the basis of publicly available information and all information believed to be reliable and does not conflict with Kuwaiti local laws, and all necessary care has been taken to before the company to ensure that the facts mentioned are correct from the source.
NCM Investment nor any of its directors or employees shall in any way be held responsible for the contents of this news, and the information contained on this page is intended only to provide clients with publicly available information and should not be construed as investment advice, report or analysis and/or constitute an offer or invitation to buy or sell financial instruments of any kind.
RISK WARNING: Forex and CFDs are highly risky leveraged products, as losses can exceed deposits. Please ensure you understand all the risks and take independent advice if necessary. NCM will segregate the clients based on the criteria of the regulator and its bylaws. NCM does not provide any advisory service; the material published does not constitute advice or a recommendation for a transaction in any financial instrument. NCM accepts no responsibility for any use of the content presented and any consequences of that use. Anyone acting on the information provided does so at their own risk.