
- Contact Us:
-

-

-

-


Daily Market Updates
09 May 2023
USDJPY
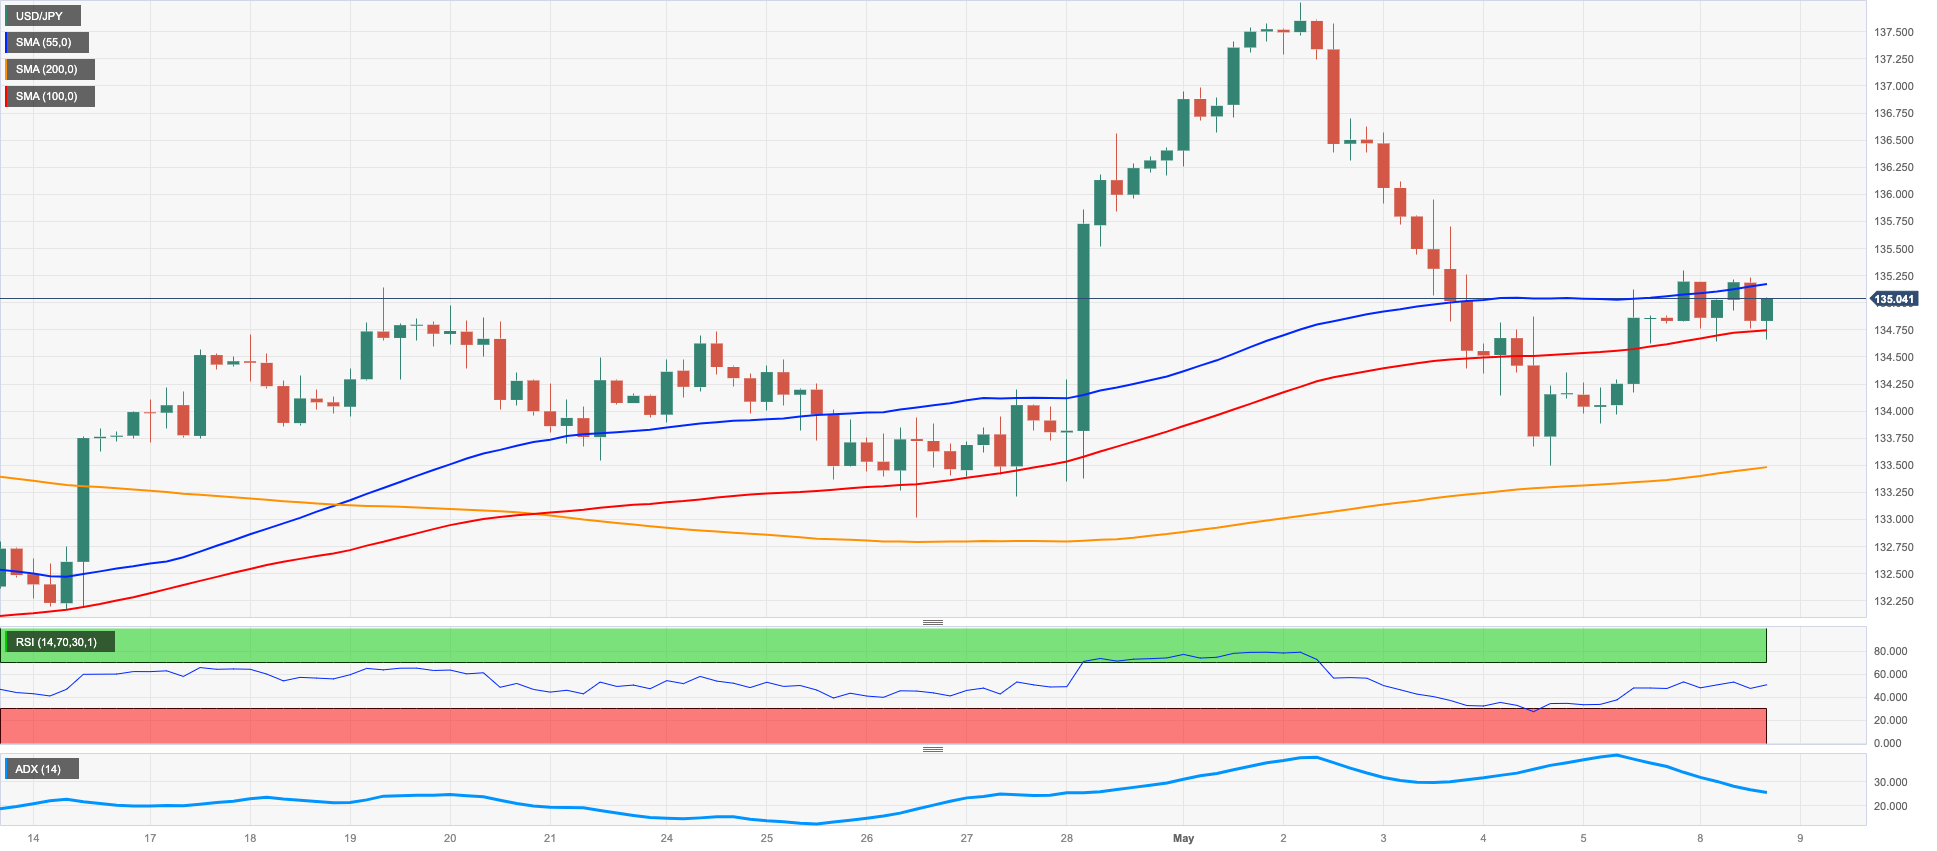
USD/JPY alternated up & downs in an inconclusive start of the week following an unsuccessful attempt to advance further north of the 135.30 zone on Monday.
The equally irresolute move in the greenback seems to have weighed on spot in spite of the continuation of the march north in US yields across the curve amidst investors’ assessment of Friday’s stronger-than-estimated Nonfarm Payrolls.
No news from the Japanese bond market, where the JGB 10-year reference extended the side-lined mood just below the 0.45% region.
In the domestic calendar, the BoJ published its Minutes of the March 9-10 meeting, where some members showed concern about the likelihood that inflation may increase faster than anticipated, while many leant towards maintaining the current ultra-accommodative stance, at the time when members showed consensus in that the economy remains surrounded by uncertainty.
Additional releases saw the final Jibun Bank Services PMI at 55.4 in April (from 55.0).
If losses continue, USD/JPY is anticipated to retest the weekly low of 133.01 (April 26), which is supported by the interim 100-day SMA at 132.78 and is prior to the minor level at 132.01 (April 13). The April low of 130.62 (April 5), the March low of 129.63 (March 24) and the February low of 128.08 (February 8) are all located below that. The next downside objective is the 2023 low of 127.21 (January 16). Just the opposite, the first up-barrier appears at the 200-day SMA at 136.99, which comes before the May peak of 137.77 (May 2) and the 2023 top of 137.91 (March 8). The weekly highs of 139.89 (November 30, 2022) and 142.25 (November 21, 2022) could be revisited with additional gains.
Resistance levels: 135.29 137.77 137.91 (4H chart)
Support levels: 133.49 133.01 132.01 (4H chart)
GBPUSD
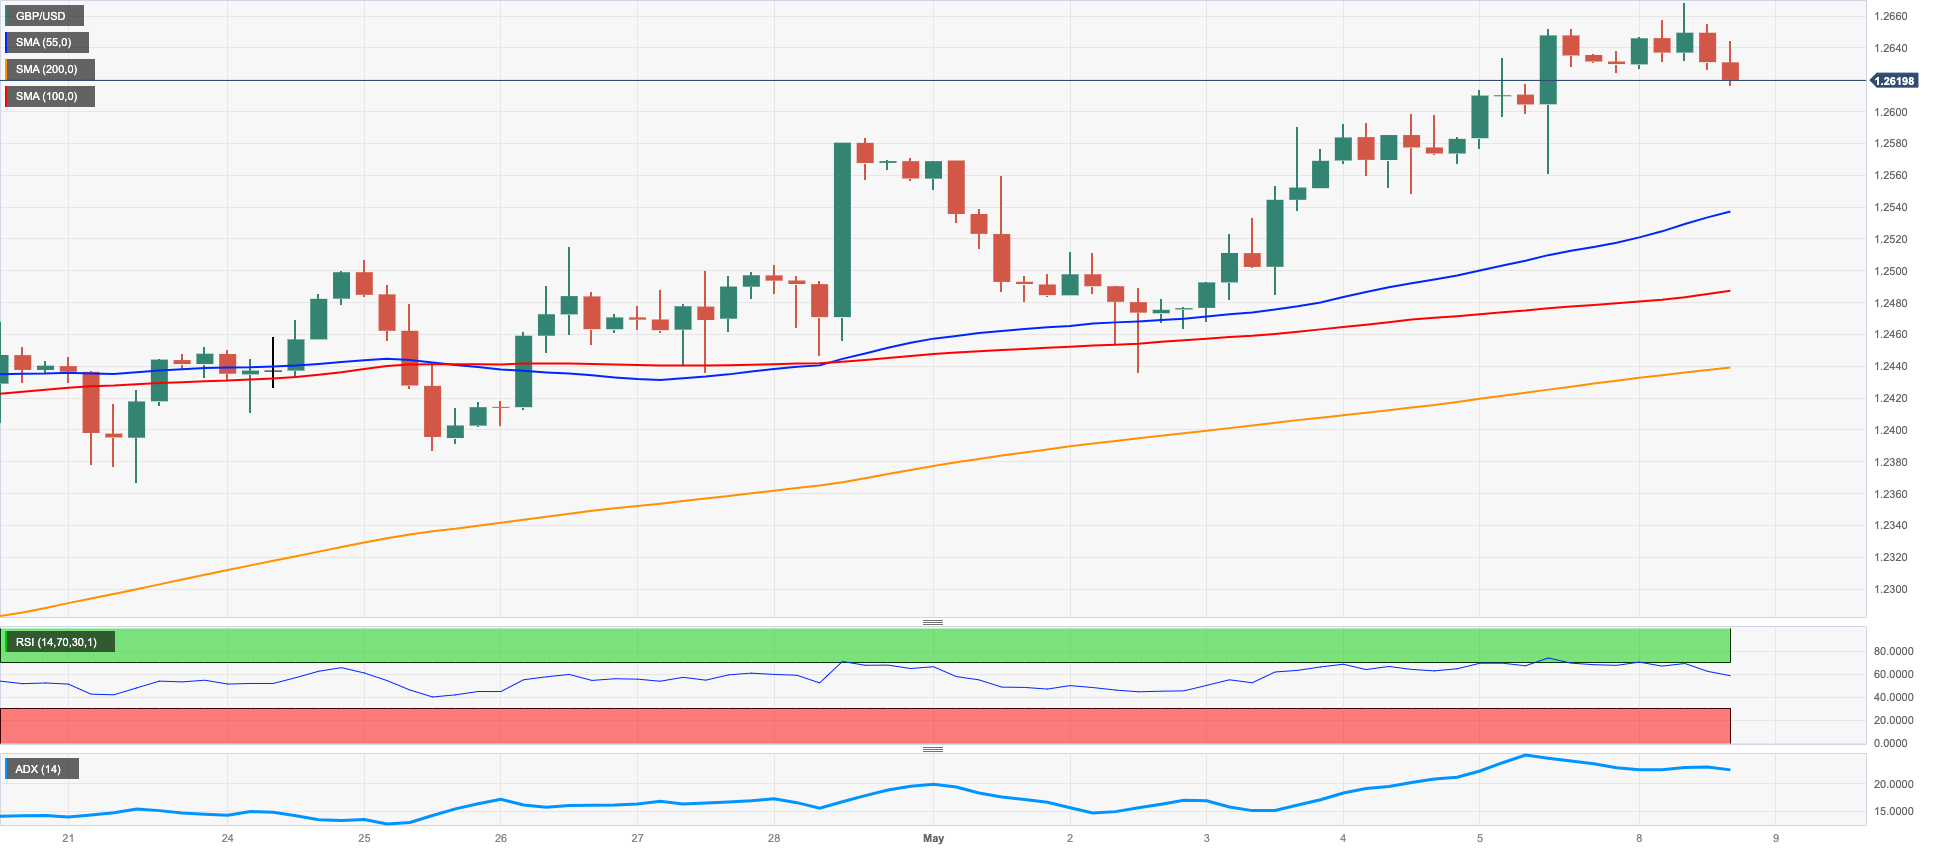
The upside momentum in GBP/USD looks everything but abated so far. Indeed, Cable gathered extra pace and advanced to levels last seen in April 2022 in the proximity of 1.2670 on Monday before giving away those gains amidst the late bounce in the dollar, always amidst the inactivity in the UK markets due to the Bank Holiday for the coronation of King Charles III.
The vacillating mood around the greenback lent initial wings to the British pound and somehow underpinned the bid bias in the rest of the risk-associated universe at the beginning of the week.
GBP/USD reached a new top in 2023 at 1.2668 on May 8. Buyers are now focused on the 200-week SMA at 1.2866 ahead of the psychological level of 1.3000. On the flip side, immediate support for Cable is situated at 1.2344 (April 10). If this level is breached, it could lead to a test of the temporary 55-day SMA at 1.2287 ahead of the April low at 1.2274 (April 3). Further downside movement may result in the spot dropping to the significant 200-day SMA at 1.1950, followed by the 2023 low at 1.1802 (March 8). The daily RSI advanced to the proximity of 65.
Resistance levels: 1.2668 1.2772 1.3089 (4H chart)
Support levels: 1.2547 1.2435 1.2386 (4H chart)
AUDUSD
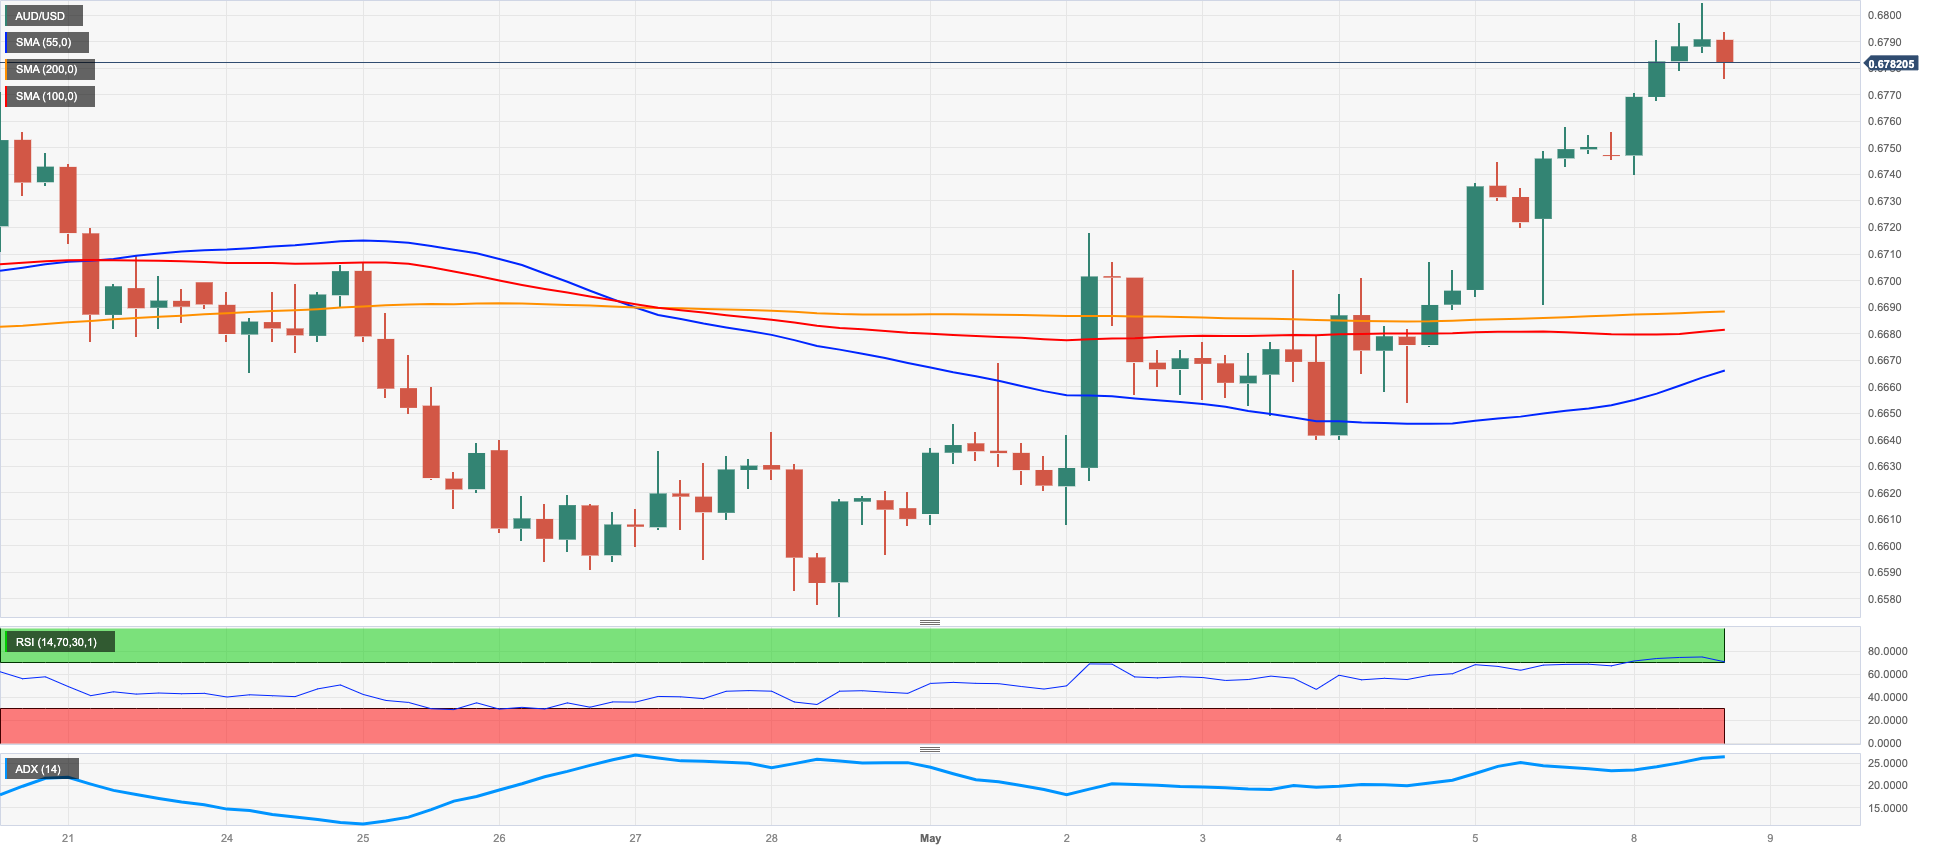
The optimism around the Aussie dollar remained well and sound for yet another session on Monday.
Against that, AUD/USD trespassed the 0.6800 mark to print new 4-week highs amidst the inconclusive-to-negative price action around the greenback at the beginning of the week.
The AUD, at the same time, managed well to offset another pullback in prices of the iron ore, while further upside was recorded in copper prices amidst the mixed tone in the broader commodity complex.
In Oz, flash Building Permits are expected to have contracted 0.1% MoM in March and the Business Confidence tracked by NAB improved to 0 in April (from -1).
AUD/USD closed above the significant 200-day SMA (0.6726) in the previous session, indicating potential further upward movement. As a result, the next target to watch for is the weekly peak at 0.6805 (April 14). Furthermore, the key round level of 0.7000 could act as a potential target, followed by the weekly high at 0.7029 (February 14) and the highest point in 2023 at 0.7157 (February 2). On the other hand, there is a chance of a decline towards the April low of 0.6573 (April 28), prior to reaching the lowest point in 2023 at 0.6563 (March 10) ahead of the weekly low at 0.6386 (November 10, 2022) seconded by the November 2022 low of 0.6272 (November 3). The daily RSI advanced past the 61 yardstick.
Resistance levels: 0.6803 0.6920 0.7029 (4H chart)
Support levels: 0.6688 0.6640 0.6620 (4H chart)
GOLD
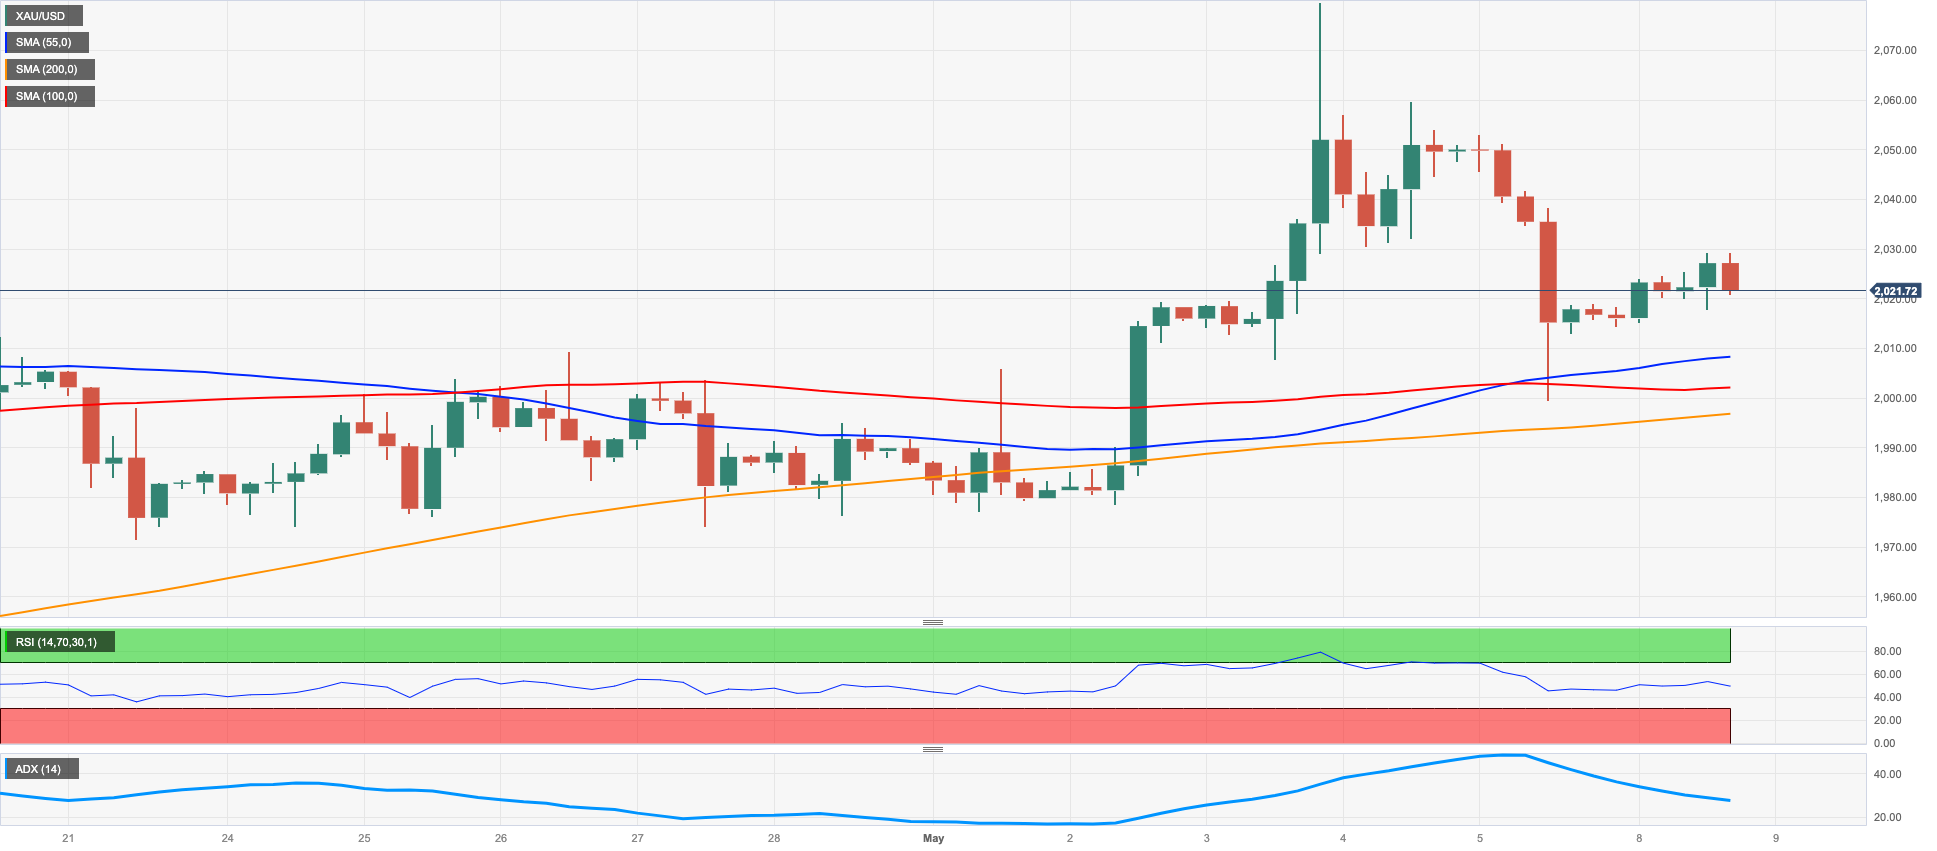
Gold prices regained the smile and recouped part of Friday’s strong retracement, managing at the same time to revisit the $2030 zone at the beginning of the week.
Modest losses in the greenback, persistent banking concerns and the debt ceiling issue all seem to have been enough to spark a bout of fresh strength in the precious metal.
Moving forward, bullion is expected to remain under scrutiny in light of the release of key US inflation figures on May 10 following Chief Powell’s fresh emphasis on data results.
If the price of gold continues to rise, it will face resistance at several levels. The first hurdle will be at the 2023 high of $2067 (May 4), followed closely by the 2022 peak of $2070 (March 8) and the historical top of $2075 (August 7, 2020). On the other hand, if the yellow metal experiences a drop below the weekly low of $1969 (April 19), it could fall towards the April low of $1949 (April 3), which appears bolstered by the interim 55-day SMA at $1945 and comes ahead of the provisional 100-day SMAs at $1910. In case of further downside, the price of gold may retreat to the March low of $1809 (March 8) and eventually to the 2023 low of $1804 (February 28).
Resistance levels: $2067 $2070 $2075 (4H chart)
Support levels: $1999 $1969 $1949 (4H chart)
CRUDE WTI
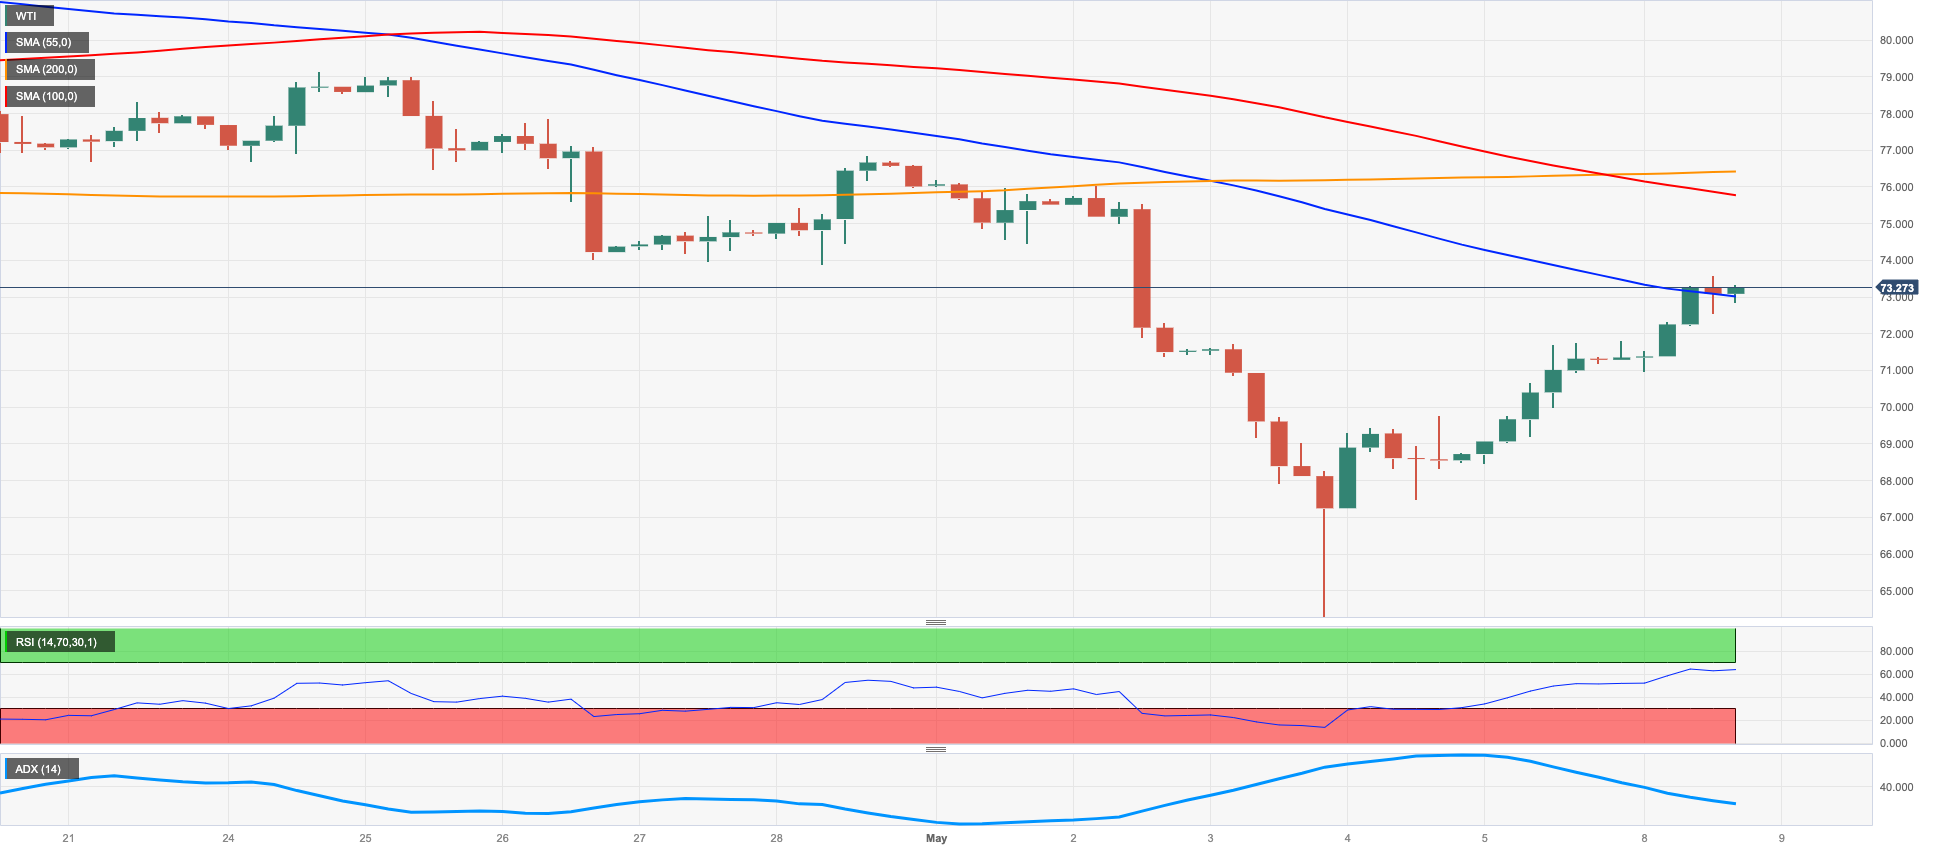
Further upside in prices of the crude oil saw the barrel of the WTI climb to 4-day peaks north of the $73.00 mark at the beginning of the week.
Indeed, a better-than-expected US jobs report in April (published on Friday) reinforced the view that a soft landing in the US economy is still on the table, boosting further the demand for the commodity amidst mitigating recession jitters.
Later in the week, the API and the EIA will report on weekly US crude oil inventories in the week ended on May 5th.
The price of crude oil continues to face downward pressure despite recent gains. Notably, the price of WTI oil reached a new low for 2023, falling to $63.73 per barrel on May 4. If the December 2021 bottom of $62.46 (December 2) is reached, oil prices could drop even further toward the key $60 level. In contrast, oil prices may face resistance from sporadic upward movements, confronting resistance at the weekly high of $79.14 (April 24), near the critical $80 level. If oil surpasses this resistance, the 200-day SMA at $81.16 would come into play. North of this level, prices could aim for the 2023 peak of $83.49 (April 12), before reaching the November 2022 high of $93.73 (November 7).
Resistance levels: $73.65 $76.88 $79.14 (4H chart)
Support levels: $63.61 $62.42 $61.72 (4H chart)
GER40
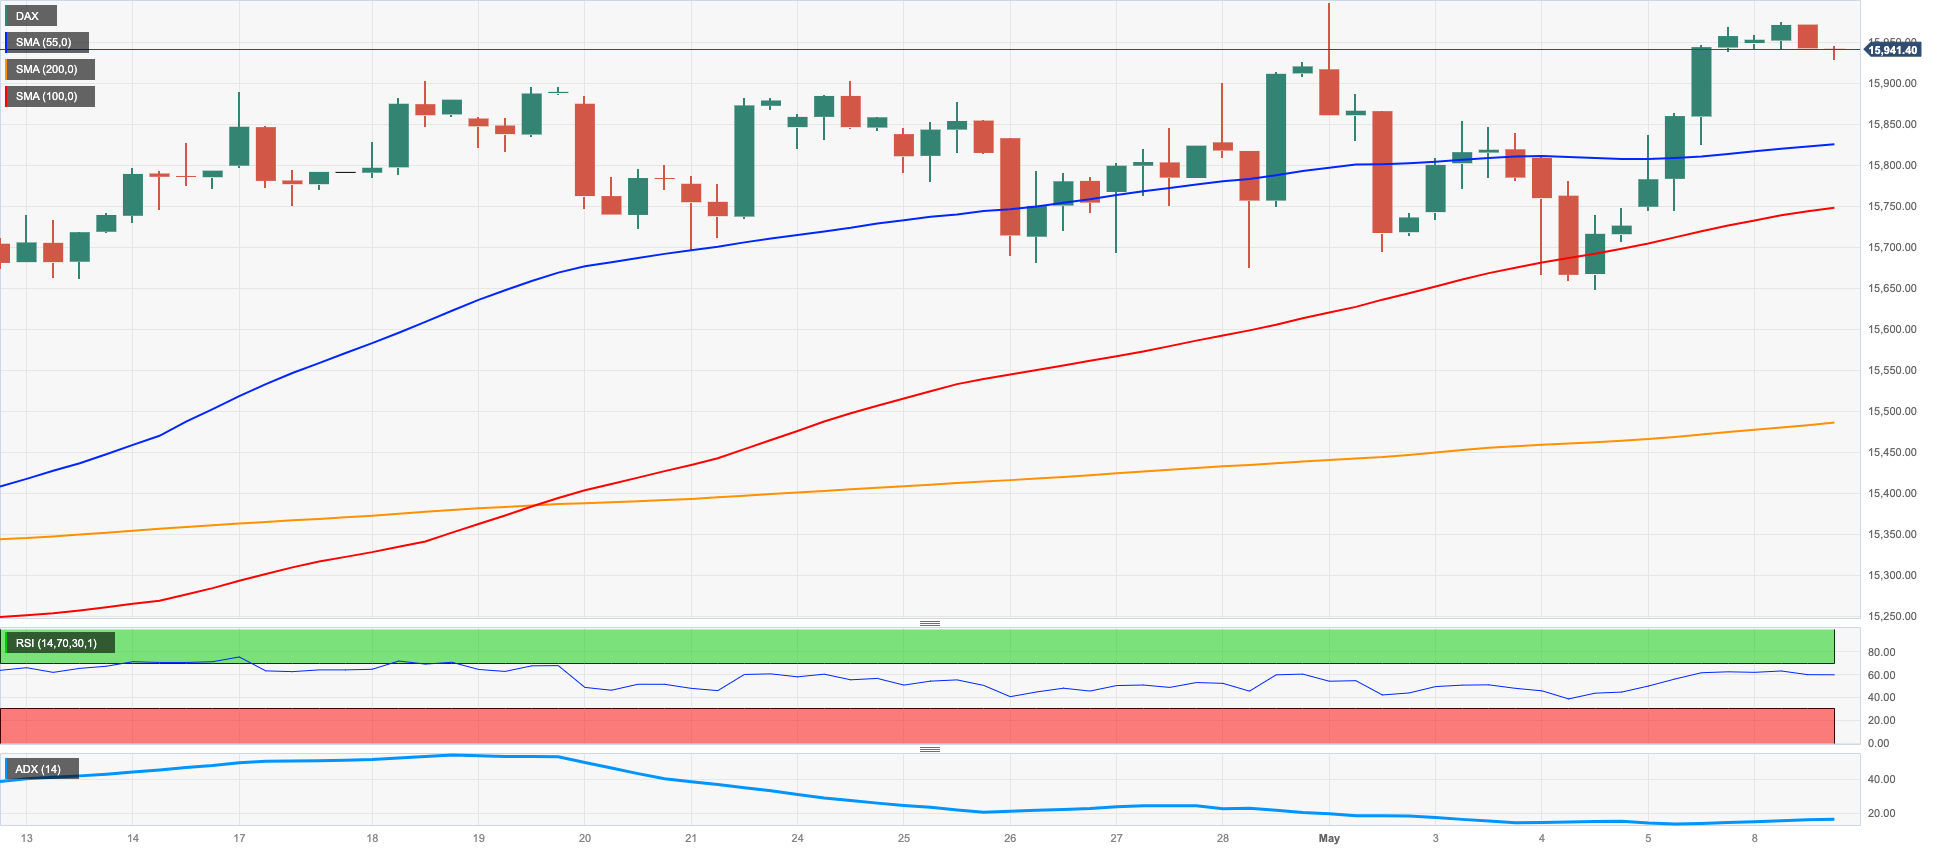
European equities traded mostly on a positive foot on Monday with the exception of the German benchmark DAX40, which retreated marginally and ended the session in levels just shy of the 16000 mark.
Market participants remained in the side-lines in the old continent as many were still digesting Friday’s US Nonfarm Payrolls, while speculation of potential rate cuts by the Fed in the next months vs. the most likely continuation of the ECB’s hiking cycle in June and July have started to gather steam.
The flattish activity in the index came in contrast to the second session with gains in the 10-year Bund yields, this time approaching the 2.35% region.
In Germany, Industrial Production contracted 3.4% in March vs. a month earlier.
If the DAX40 surpasses the high of 16011 reached on May 2, it may pose a threat to the peak of 16285 recorded on January 5, 2022. However, the current interim 55-day SMA at 15494 is providing support for the April low of 15482 (April 5). Meanwhile, if the index continues to decline, the provisional 100-day SMA at 15163 might become the next potential contention zone. A further pullback could bring minor support levels back into play, including 14809 (March 24), 14458 (March 20), and the key 200-day SMA at 14242. The daily RSI has increased and exceeded the 60 threshold.
Best Performers: Adidas, Covestro, Commerzbank
Worst Performers: Deutsche Post, Allianz, RWE AG ST
Resistance levels: 16011 16090 16285 (4H chart)
Support levels: 15662 15482 14809 (4H chart)
NASDAQ
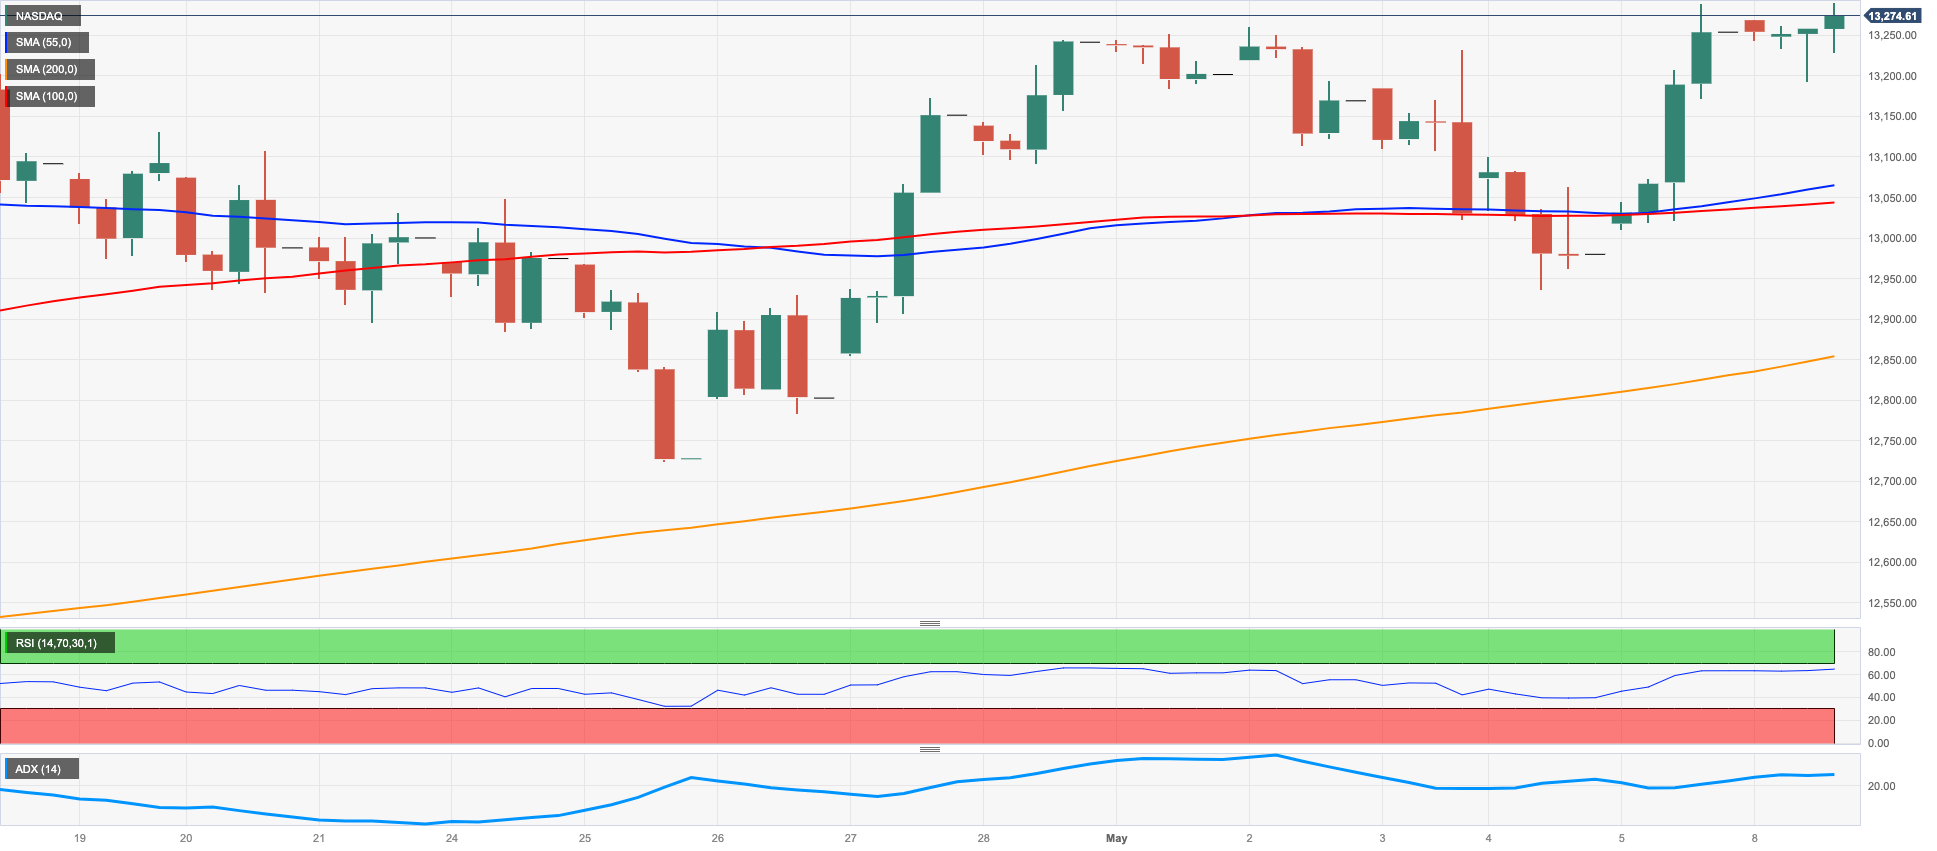
Tech equities kicked in the new trading week in a positive fashion and flirted with the so far yearly peak near 13300 on Monday
Alternating mood in the dollar, higher US yields across the curve and cautiousness ahead of the publication of the US CPI (May 10) did nothing to prevent the Nasdaq 100 from extending Friday’s positive momentum, which was underpinned by positive performance of AMD, Nvidia and Alphabet.
The Nasdaq 100 continues to target the 2023 high at 13291 (May 5). The outperformance of this district could pave the way to a trial of the August 2022 pinnacle of 13720 (August 16) and the huge round degree of 14000. Assuming vertical force proceeds, the following objective could be the March 2022 top of 15265 (March 29). The reverse way around, and if the descending energy gets momentum, the April low of 12724 (April 25) is supposed to offer introductory help in front of the interim 55-day SMA at 12673 and the weekly low at 12517 (March 28). A dip under these levels could prompt the key 200-day SMA at 12084 to re-emerge on the horizon, preceding the March low at 11695 (March 13) and week by week lows at 11550 (January 25) and 11251 (January 19). Further shortcoming, meanwhile, could challenge the 2023 low at 10696 (January 6). The everyday RSI surpassed the 60 level.
Top Gainers: Zscaler, Crowdstrike Holdings Inc, Airbnb
Top Losers: Moderna, Atlassian Corp Plc, Align
Resistance levels: 13291 13720 14277 (4H chart)
Support levels: 12938 12724 12517 (4H chart)
DOW JONES
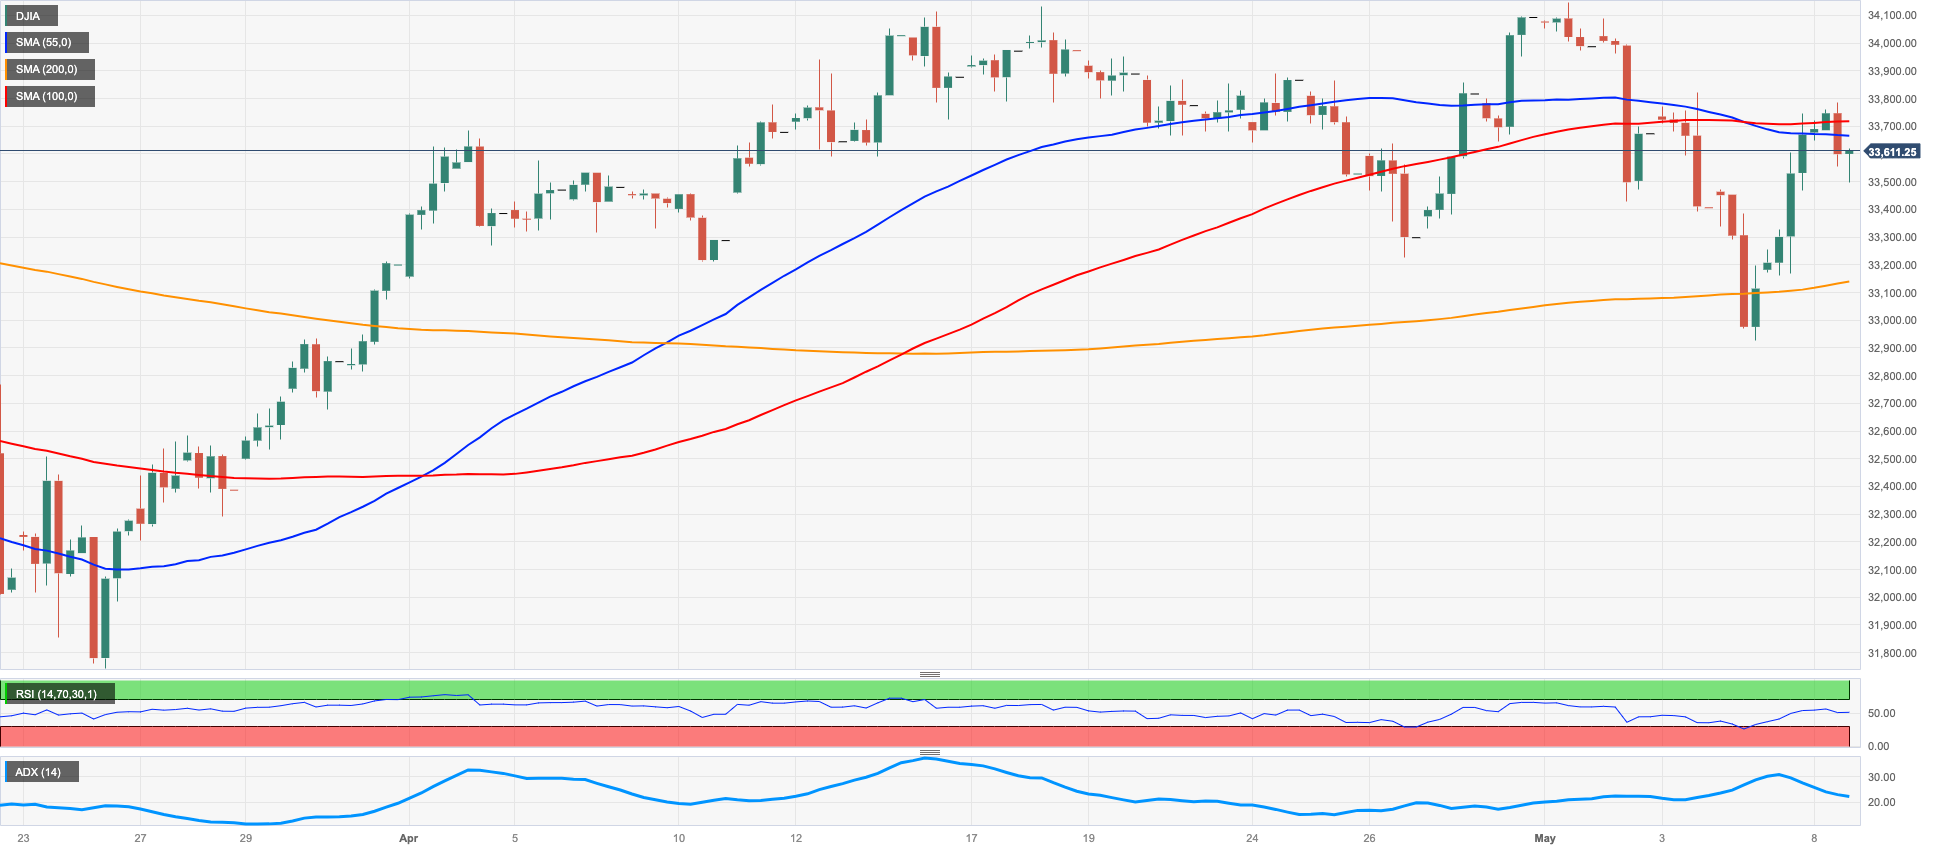
US equities tracked by the three major stock indices started the week in a poor note, with the Dow Jones retreating 0.29% to 33584, the S&P500 dropping 0.05% to 4134 and the tech-heavy Nasdaq Composite deflating 0.02% to 12234.
In fact, investors’ sentiment remained divided between prudence ahead of the release of US inflation figures later in the week, corporate earnings results and somewhat diminishing bets on a probable US recession – the latter reinvigorated by above-expectations Nonfarm Payrolls.
The Dow Jones is expected to encounter resistance as it continues to recover. The first hurdle it will face is the May top of 34257 (May 1), followed by the 2023 peak of 34342 (January 13) and the December 2022 high of 34712 (December 13). The surpass of the latter could motivate the index to potentially reach the April 2022 high of 35492. However, if the index experiences a decline, it may find support at the May low of 32967 (May 4), followed by the key 200-day SMA at 32724. Further south, the 2023 low at 31429 (March 15) may provide additional support before reaching the 2022 low at 28660 (October 13). The daily RSI slipped back below the 52 mark.
Top Performers: Walt Disney, American Express, Travelers
Worst Performers: Walgreen Boots, 3M, Home Depot
Resistance levels: 34257 34334 34712 (4H chart)
Support levels: 33330 32937 31805 (4H chart)
MACROECONOMIC EVENTS

All Information & Updates provided by:

All information relating to the financial markets available on this page has been prepared and issued by FXStreet (Forexstreet SL, Spain, Reg: B62498233) on the basis of publicly available information and all information believed to be reliable and does not conflict with Kuwaiti local laws, and all necessary care has been taken to before the company to ensure that the facts mentioned are correct from the source.
NCM Investment nor any of its directors or employees shall in any way be held responsible for the contents of this news, and the information contained on this page is intended only to provide clients with publicly available information and should not be construed as investment advice, report or analysis and/or constitute an offer or invitation to buy or sell financial instruments of any kind.
RISK WARNING: Forex and CFDs are highly risky leveraged products, as losses can exceed deposits. Please ensure you understand all the risks and take independent advice if necessary. NCM will segregate the clients based on the criteria of the regulator and its bylaws. NCM does not provide any advisory service; the material published does not constitute advice or a recommendation for a transaction in any financial instrument. NCM accepts no responsibility for any use of the content presented and any consequences of that use. Anyone acting on the information provided does so at their own risk.