
- Contact Us:
-

-

-

-


Daily Market Updates
10 May 2023
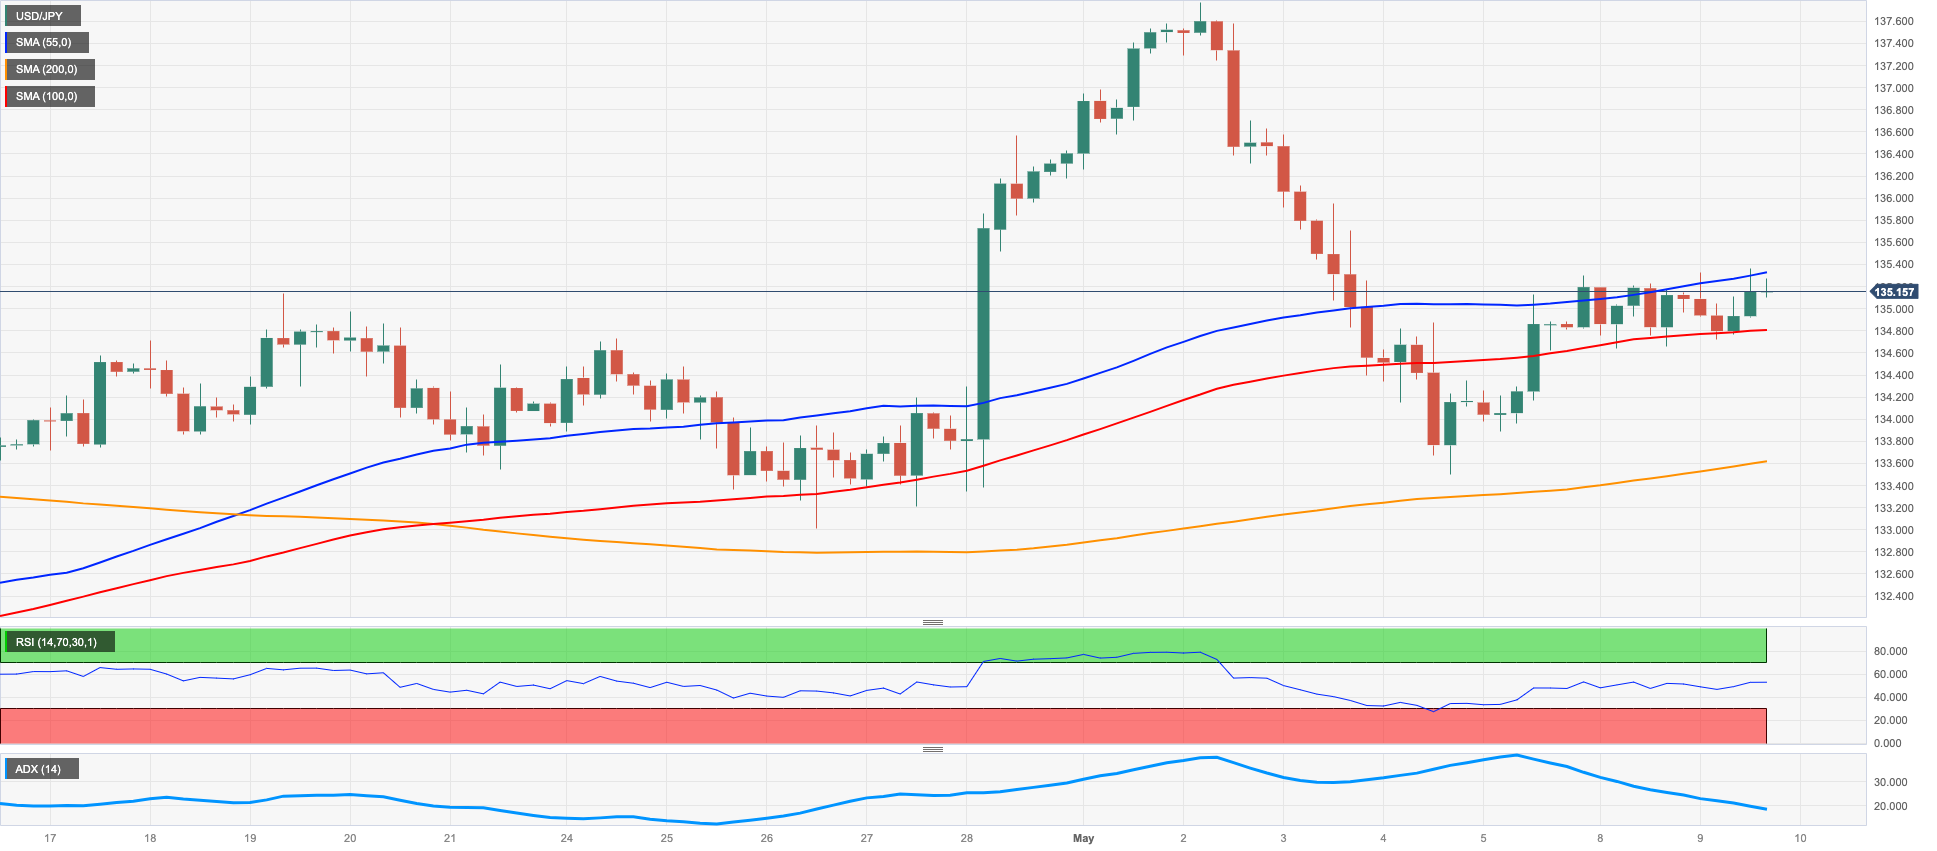
USDJPY
USD/JPY set aside the BoJ-induced knee-jerk to the 134.70 region during early trade and reclaimed the area beyond 135.00 the figure on the back of another positive performance of the greenback as well as the persistent uptick in US yields across the curve.
Back to the BoJ, Governor K. Ueda testified before Parliament early in Asian trade hours that he intends to end the YCC program and then begin shrinking the balance sheet whenever the inflation outlook demonstrates that a sustained 2.0% inflation is possible.
In the Japanese bond market, the JGB 10-year yields showed no signs of life and remained confined to the multi-week range bound theme above the 0.40% level.
In the domestic calendar, Household Spending contracted at an annualized 1.9% in March and 0.8% vs. the previous month.
The continuation of the recovery faces the initial resistance level at the 200-day SMA at 137.00, before the May peak of 137.77 (May 2) and the 2023 top of 137.91 (March 8). Further gains could enable a revisit to the weekly highs of 139.89 (November 30, 2022) and 142.25 (November 21, 2022). On the contrary, if the losses persist, the pair is expected to test the weekly low of 133.01 (April 26), which is supported by the interim 100-day SMA at 132.82 and precedes the minor level at 132.01 (April 13). Below that, the April low of 130.62 (April 5), the March low of 129.63 (March 24), and the February low of 128.08 (February 8) are all situated. The next target on the downside is the 2023 low of 127.21 (January 16). The everyday RSI advanced marginally to the 55 region.
Resistance levels: 135.29 137.77 137.91 (4H chart)
Support levels: 133.49 133.01 132.01 (4H chart)
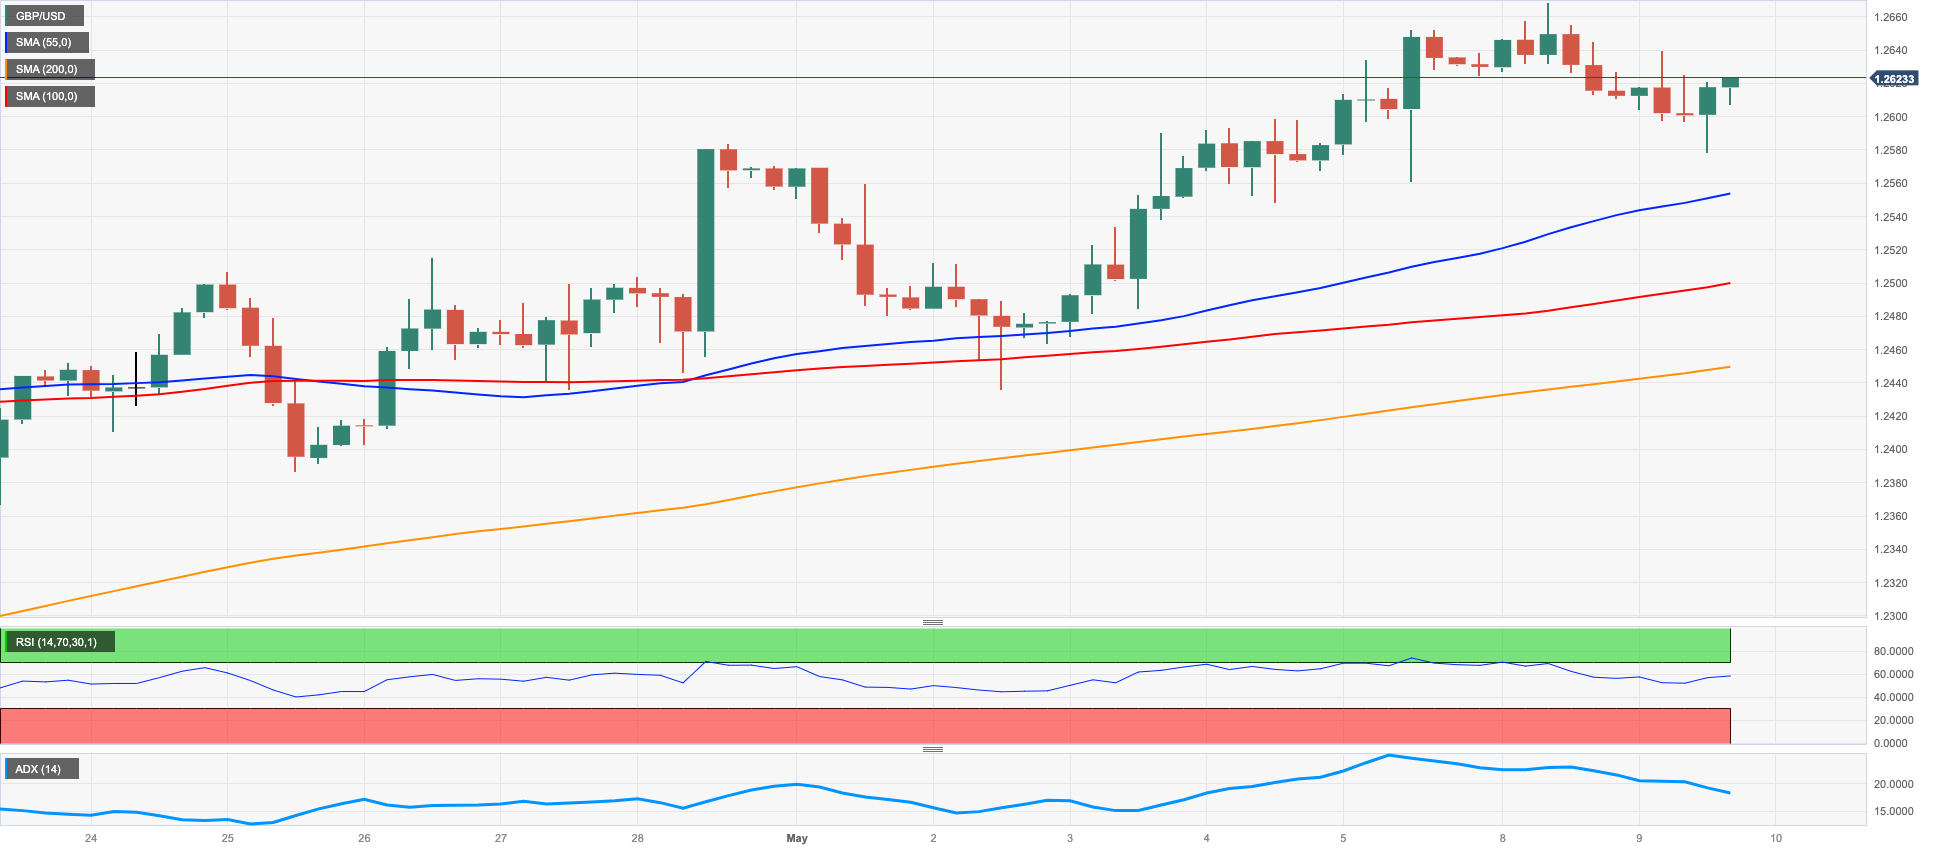
GBPUSD
Following an earlier drop to the 1.2580/75 band, GBP/USD managed to regain some balance and reclaimed the 1.2600 barrier and beyond towards the end of Tuesday’s session, ending up the day with humble gains.
The firmer tone in the greenback initially weighed on Sterling and sponsored the early bearish move in Cable, although the current positive mood around the quid seems to have limited the downside somewhat and keep spot on the positive side.
Moving forward, the British pound should face heightened volatility in light of the upcoming BoE meeting on April 11, where the central bank is expected to raise the policy rate by 25 bps.
In the UK docket, April results showed the BRC Retail Sales Monitor improved 5.2% from a year earlier, while the House Price Index tracked by Halifax dropped 0.3% MoM and rose 0.1% YoY. Additionally, BBA Mortgage Rate climbed to 7.41% (from 7.22%).
Immediate support for GBP/USD can be found at the May low of 1.2435 (May 2) seconded by the weekly low of 1.2344 (April 10). If this level is breached, it could lead to a test of the interim 55-day SMA at 1.2296, followed by the April low at 1.2274 (April 3). Further downward movement might cause the pair to drop to the significant 200-day SMA at 1.1952, and potentially even reach the 2023 low of 1.1802 (on March 8). Conversely, Cable reached a new high for the year 2023, hitting 1.2668 (May 8). Currently, buyers are directing their attention towards the 200-week SMA of 1.2865, as well as the psychological level of 1.3000. The daily RSI ticked lower to the vicinity of 61.
Resistance levels: 1.2639 1.2668 1.2772 (4H chart)
Support levels: 1.2577 1.2547 1.2435 (4H chart)
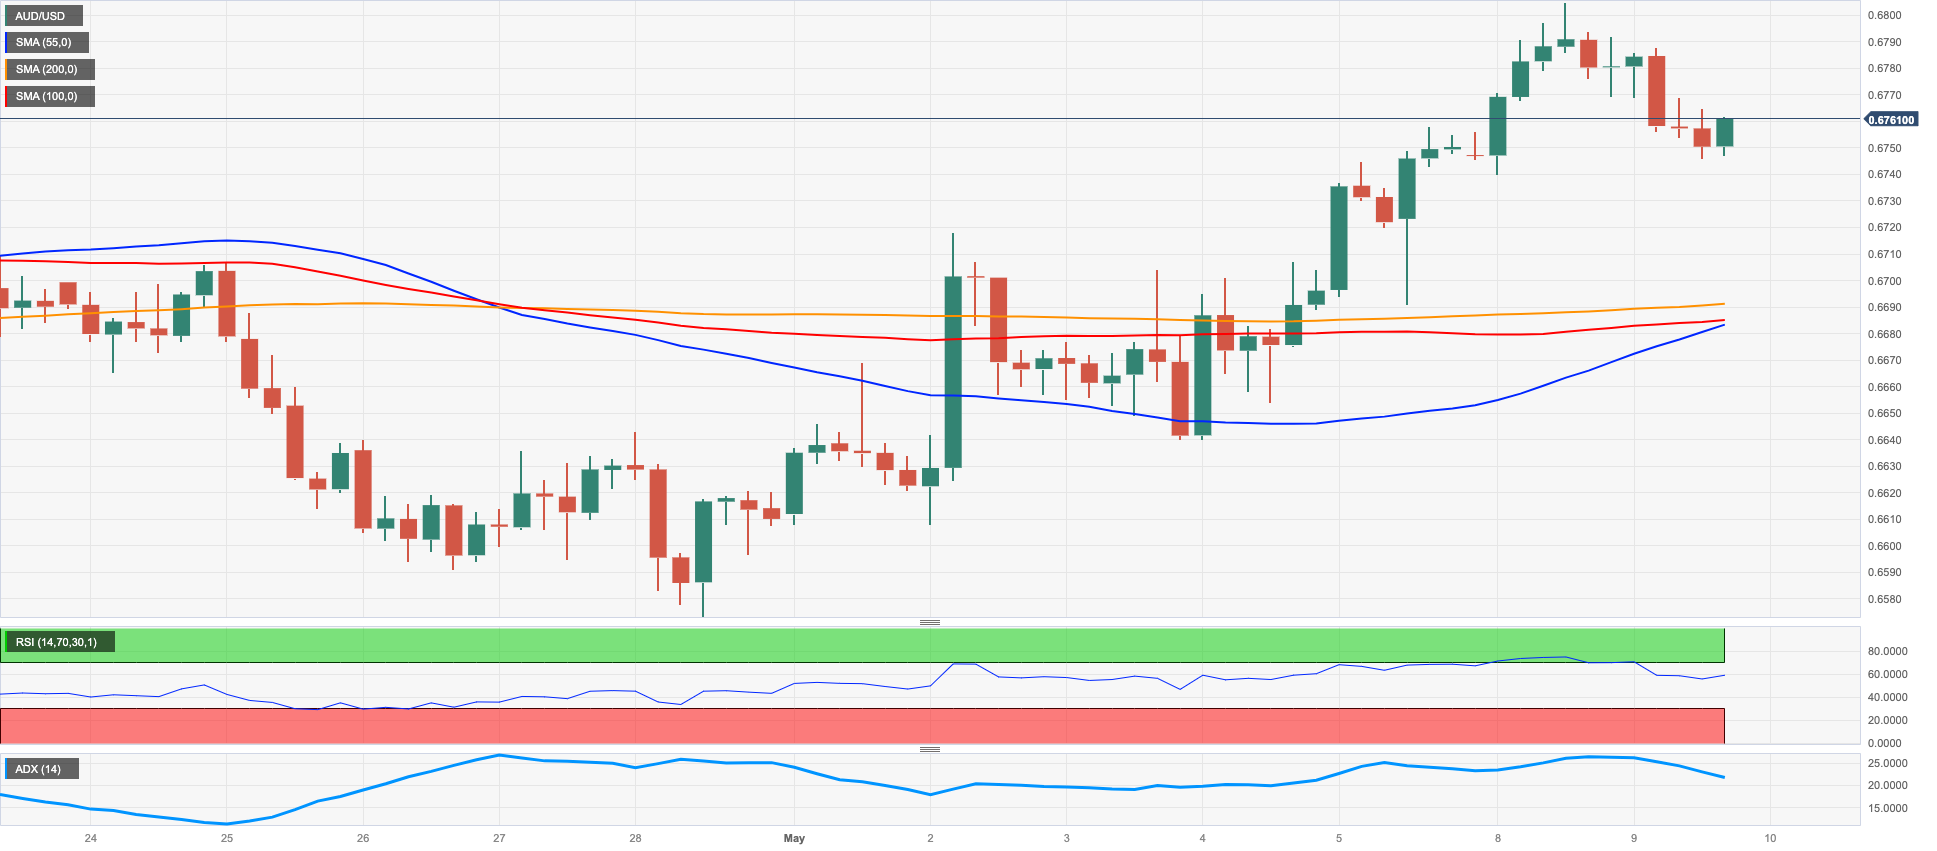
AUDUSD
AUD/USD halted the 6-day positive streak and returned to the mid-0.6700s on turnaround Tuesday.
Further strength in the greenback and the mixed performance in the commodity galaxy weighed on the Aussie dollar despite the marked recovery in prices of the iron ore.
In addition, discouraging readings from the Chinese trade balance results also collaborated with the bearish tone in the pair and bolstered the corrective move from Monday’s peaks past 0.6800.
In Oz, last Retail Sales rose at a monthly 0.4% in what was the sole release on Tuesday. On another front, Treasurer Chalmers reported powerful monetary figures in the yearly spending plan estimates, as he sees a 0.2% of GDP surplus for the ongoing monetary year 2022-2023 and a 0.5% of GDP deficit in the 2023-2024 financial year.
AUD/USD faces an immediate support at the key 200-day SMA at 0.6725 prior to the temporary 55-day SMA at 0.6690. Further weakness could see the chance of a decrease towards the April low of 0.6573 (April 28), prior to reaching the lowest point in 2023 of 0.6563 (March 10) before the weekly low of 0.6386 (November 10, 2022) and the November 2022 low of 0.6272 (November 3). Just the opposite, the next point to watch for is the May high of 0.6803 (May 8) just before the weekly top at 0.6805 (April 14). Beyond that, the key round level of 0.7000 could be a potential target, followed by the weekly peak of 0.7029 (February 14) and the highest point in 2023 of 0.7157 (February 2). The daily RSI dropped to the proximity of 57.
Resistance levels: 0.6803 0.6920 0.7029 (4H chart)
Support levels: 0.6746 0.6688 0.6640 (4H chart)
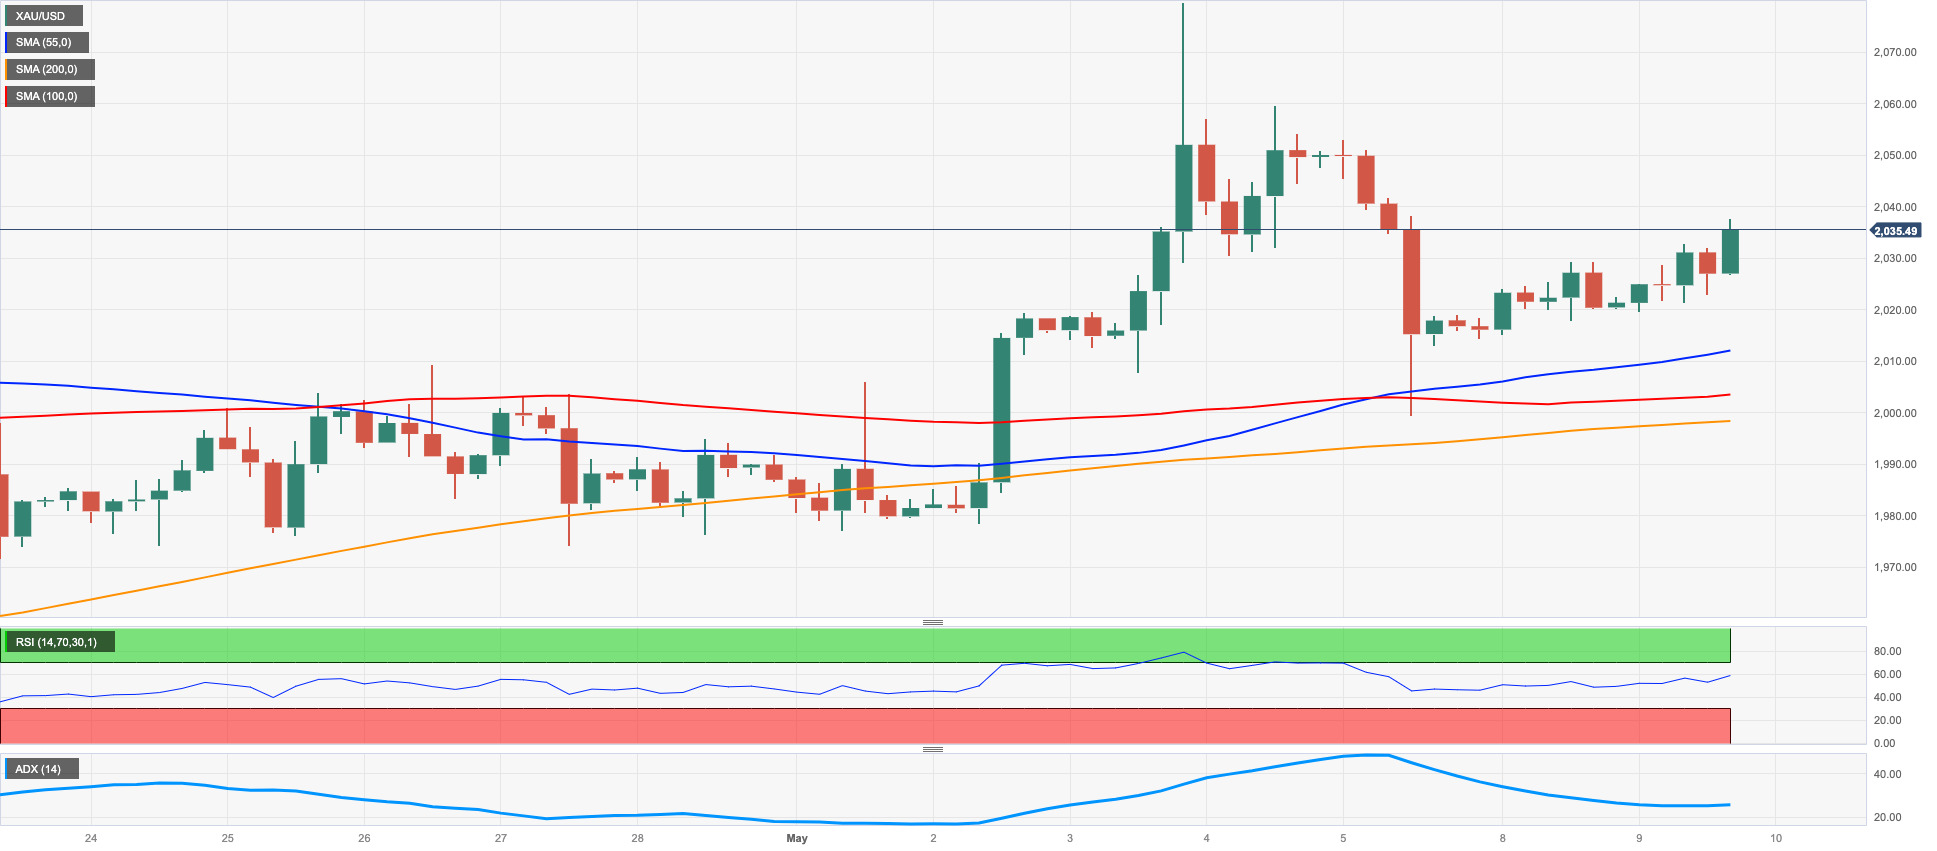
GOLD
Gold prices ignored the move higher in the greenback and another positive session in US yields across the curve and added to Monday’s gains, revisiting the $2030 region, or 2-day highs.
As a matter of fact, traders re-positioned in the precious metal ahead of the key release of US inflation figures on Wednesday, where market consensus expects inflation pressures to have retreated further in April, which should in turn bolster the idea of a Fed’s pause in June.
On the off chance that the cost of gold keeps on rising, it will confront obstruction at a few levels. The principal obstacle will be at the 2023 high of $2067 (May 4), followed intently by the 2022 pinnacle of $2070 (March 8) and before the all-time top of $2075 (August 7, 2020). Then again, if the yellow metal encounters a dip under the week after week low of $1969 (April 19), it could fall towards the April low of $1949 (April 3), which seems reinforced by the interval 55-day SMA at $1948 and comes in front of the temporary 100-day SMAs at $1913. In the event of additional drawback, the yellow metal might withdraw to the March low of $1809 (March 8) and ultimately to the 2023 low of $1804 (February 28).
Resistance levels: $2067 $2070 $2075 (4H chart)
Support levels: $1999 $1969 $1949 (4H chart)
CRUDE WTI
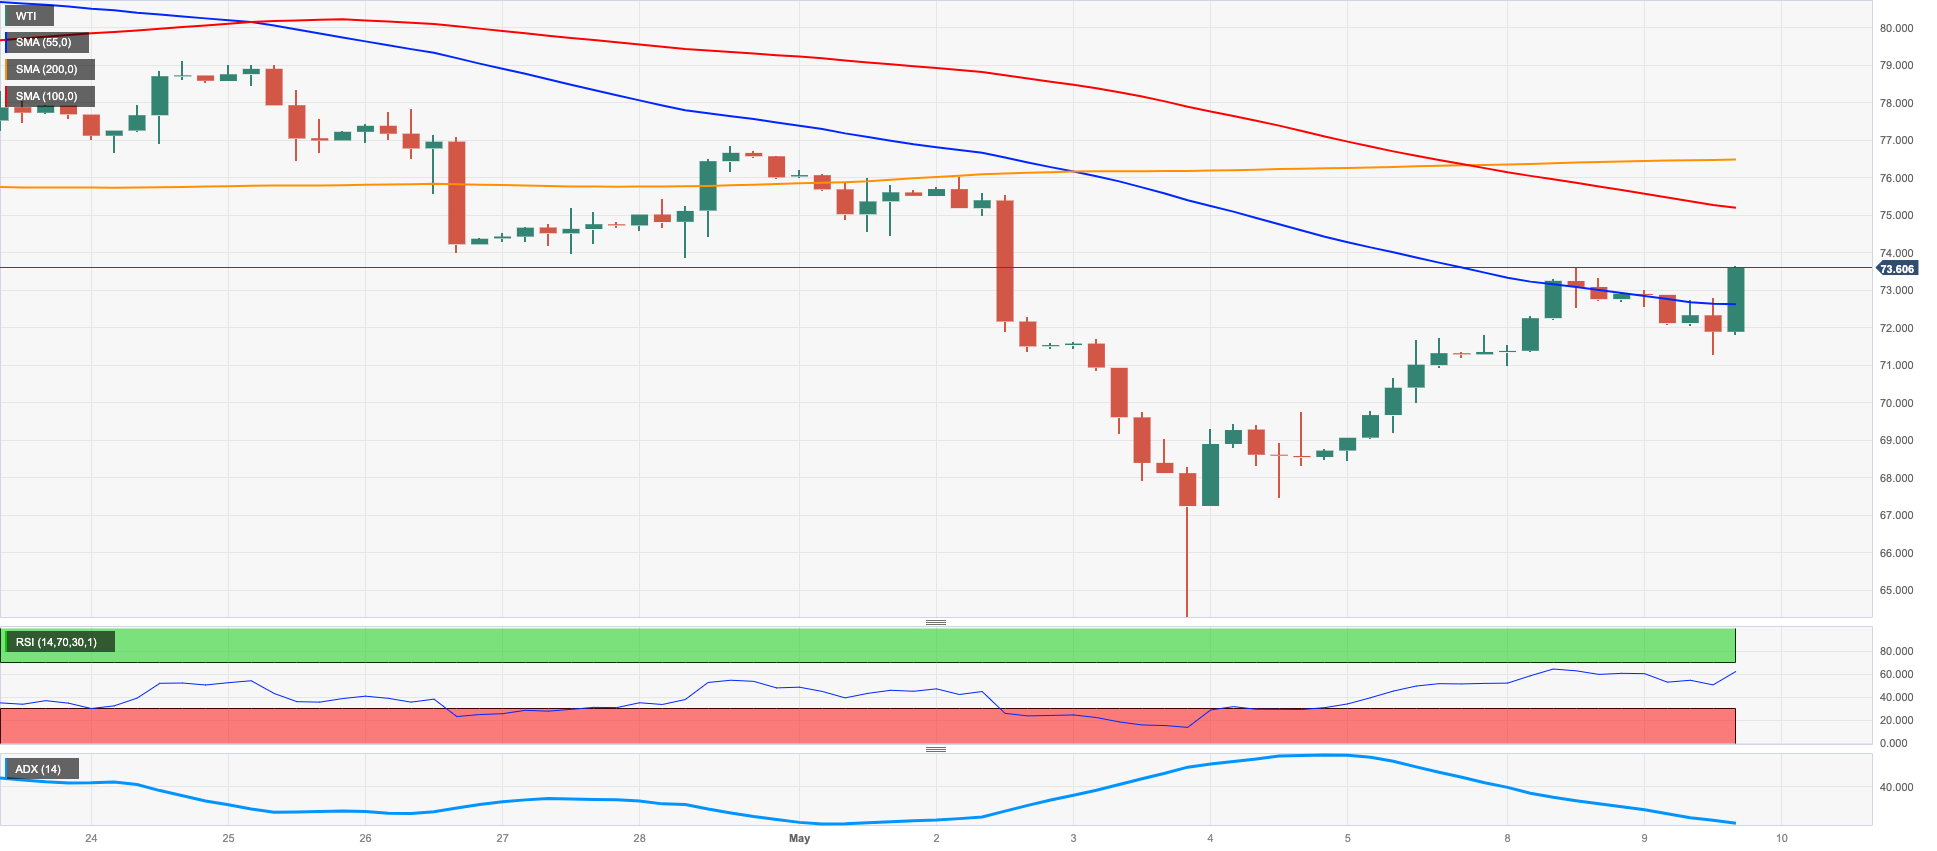
The recent uptrend in crude oil prices was halted on Tuesday in response to omnipresent demand concerns, this time exacerbated following disheartening results from the Chinese trade balance during April, while unease around the banking sector and a potential economic slowdown also added to the sour mood among traders.
Without a doubt, costs of the WTI quickly eroded initial losses on the back of supply disturbances coming from rapidly spreading fires in the Canadian region of Alberta, as they stayed wild and took steps to keep further oil shut in.
Following the closing bell in Wall St, the API will report on weekly US crude oil inventories in the week ended on May 5th ahead of the DoE’s official report on Wednesday.
The price of crude oil has been facing continuous downward pressure despite some recent gains. In particular, the price of WTI has reached a new low for 2023, dropping to $63.73 per barrel on May 4. If the December 2021 bottom of $62.46 (December 2) is reached, oil prices could fall further towards the key $60 level. By contrast, oil prices may face resistance from occasional upward movements, confronting resistance at the weekly high of $79.14 (April 24), close to the critical $80 level. If oil surpasses this resistance, the 200-day SMA of $81.03 could come into play. Above this level, prices could target the 2023 peak of $83.49 (April 12), before reaching the November 2022 high of $93.73 (November 7).
Resistance levels: $73.65 $76.88 $79.14 (4H chart)
Support levels: $63.61 $62.42 $61.72 (4H chart)
GER40
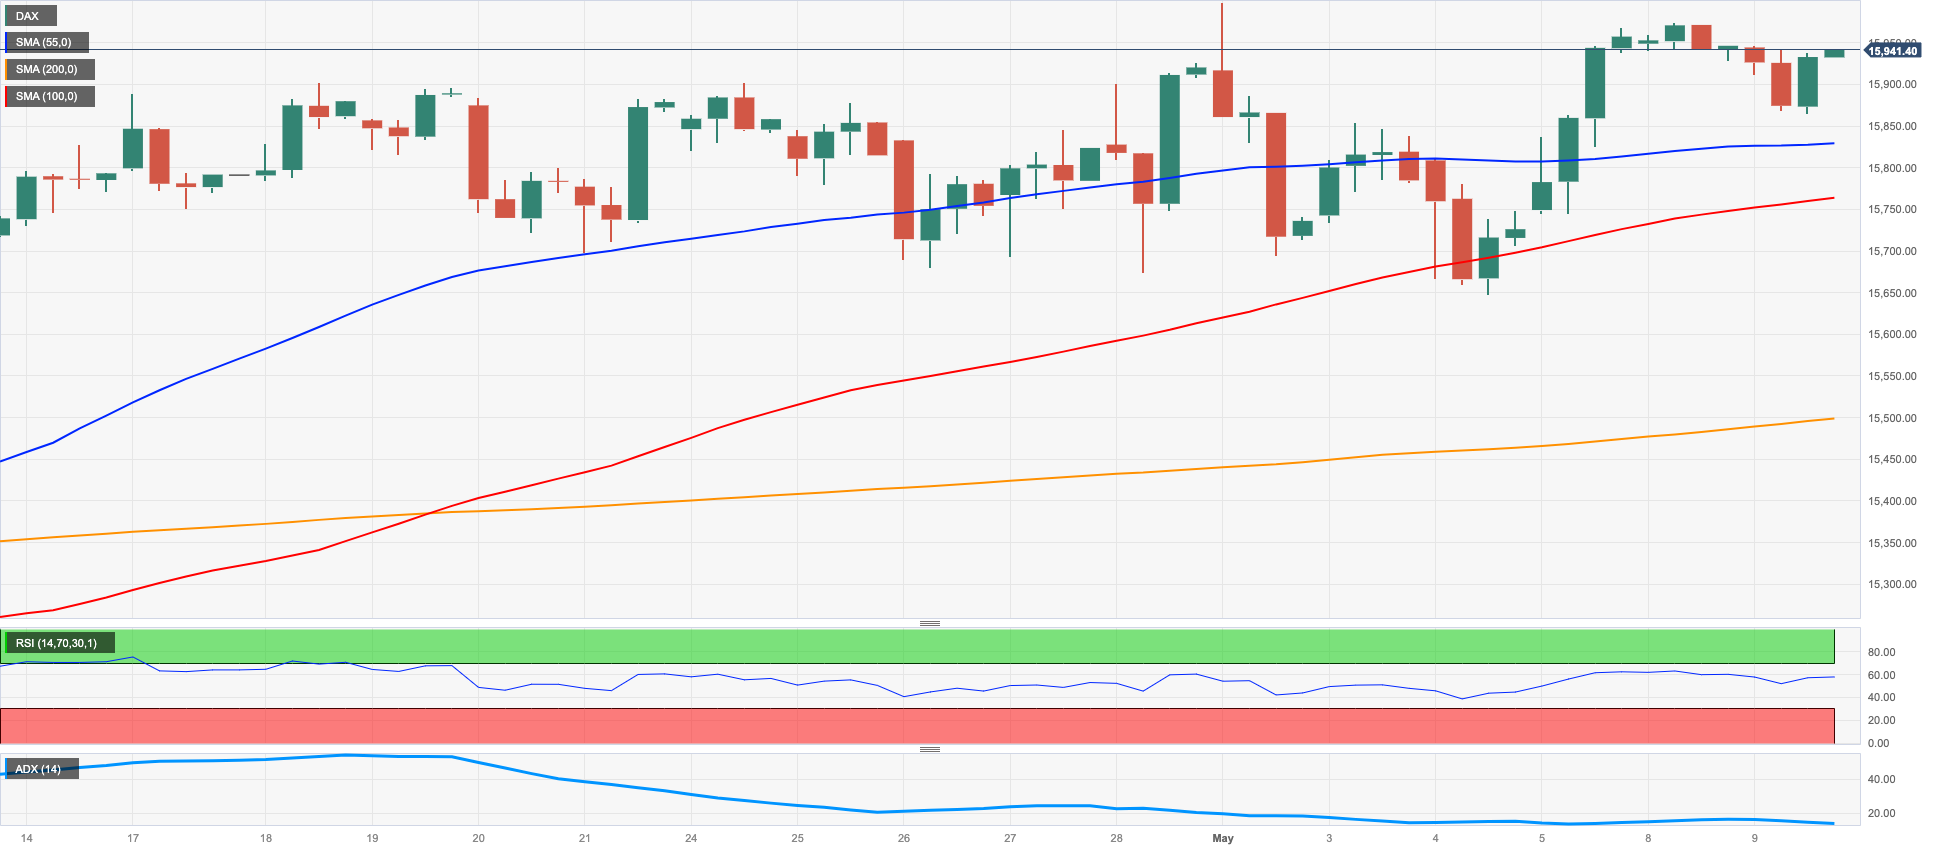
The German reference DAX40 ended the session around Monday’s closing levels in the 16000 zone on Tuesday.
In fact, the index maintained the multi-week consolidative theme in the upper end of the range well in place amidst steady prudence ahead of the publication of US CPI on May 10.
Also adding to investors’ attention was the disappointing results from the Chinese trade balance in April, while jitters around the Swedish housing market appear to have raised some eyebrows in the old continent as well as the persistently hawkish narrative from ECB’s rate setters, as this time Board members Kazaks and Kazimir favoured the continuation of the bank’s hiking cycle in the next months.
In Germany, the 10-year Bund yields followed their US peers and rose for the third straight session, this time retesting the 2.35% region.
If the DAX40 exceeds the 2023 top of 16011 (May 2), it may represent a challenge to the January 2022 high of 16285 (January 5). On the contrary, the May low at 15662 (May 4) emerges as the immediate contention prior to the temporary 55-day SMA at 15494 and the April low of 15482. (April 5). Meanwhile, if the index continues to fall, the interim 100-day SMA at 15192 might become the next potential contention zone. A deeper decline might reintroduce minor support levels such as 14809 (March 24), 14458 (March 20), and the important 200-day SMA at 14270. The daily RSI appeared flattish near 60.
Best Performers: Fresenius SE, RWE AG ST, Munich Re Group
Worst Performers: Sartorius AG VZO, Zalando SE, Adidas
Resistance levels: 16011 16090 16285 (4H chart)
Support levels: 15662 15482 14809 (4H chart)
NASDAQ
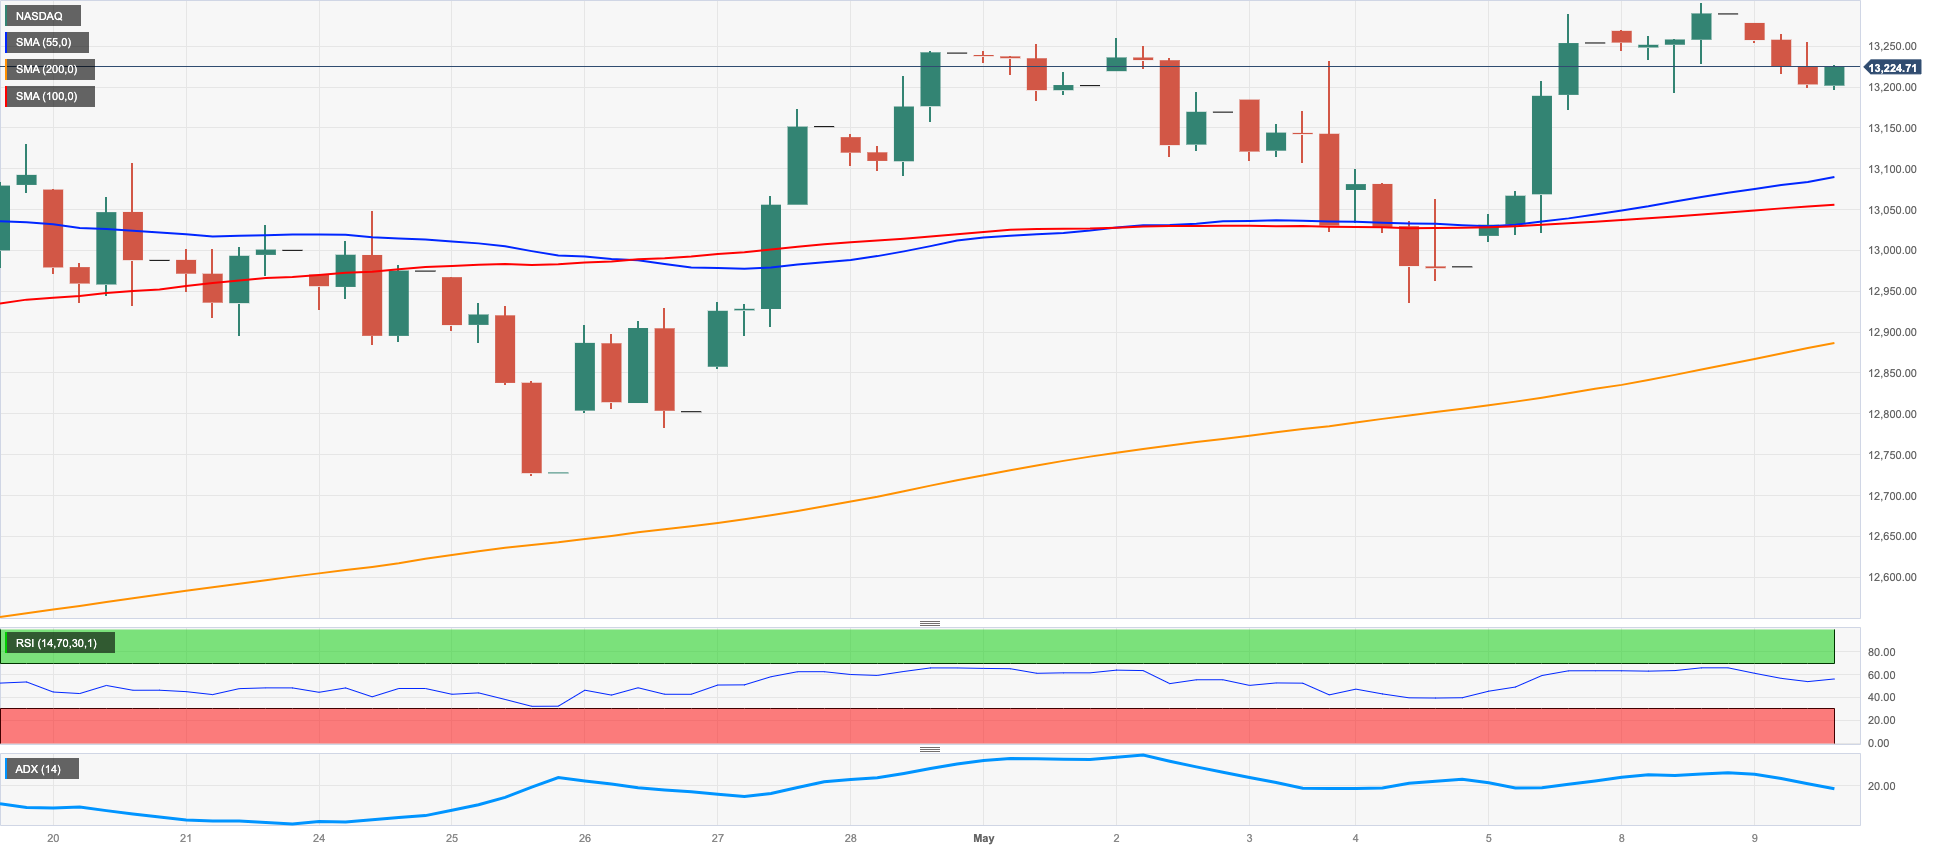
The tech benchmark Nasdaq 100 reversed four consecutive sessions with gains and dropped markedly on Tuesday.
Tech equities remained on the defensive in response to poor forecasts from key players in the sector, while the intense move higher in the dollar coupled with the equally robust pick-up in US yields also undermined the sentiment.
The Nasdaq 100 is targeting its 2023 top at 13302 (May 8) and a strong performance in this region may lead to a re-test of the August 2022 peak of 13720 (August 16) and the significant resistance level of 14000. If the upward momentum continues, the next target could be the March 2022 high of 15265 (March 29). Having said that, if there is a downward trend, the so far May low at 12938 (May 4) should hold the initial test seconded by the April low of 12724 (April 25), followed by the interim 55-day SMA at 12673 and the weekly low at 12517 (March 28). If these levels are breached, it could trigger a re-test of the key 200-day SMA at 12084, followed by the March low at 11695 (March 13) and the weekly lows at 11550 (January 25) and 11251 (January 19). Further weakness may challenge the 2023 low at 10696 (January 6). The daily RSI receded to the 56 zone.
Top Gainers: Zscaler, Datadog, Atlassian Corp Plc
Top Losers: PayPal Holdings Inc, Lucid Group, Globalfoundries
Resistance levels: 13302 13720 14277 (4H chart)
Support levels: 12938 12724 12517 (4H chart)
DOW JONES
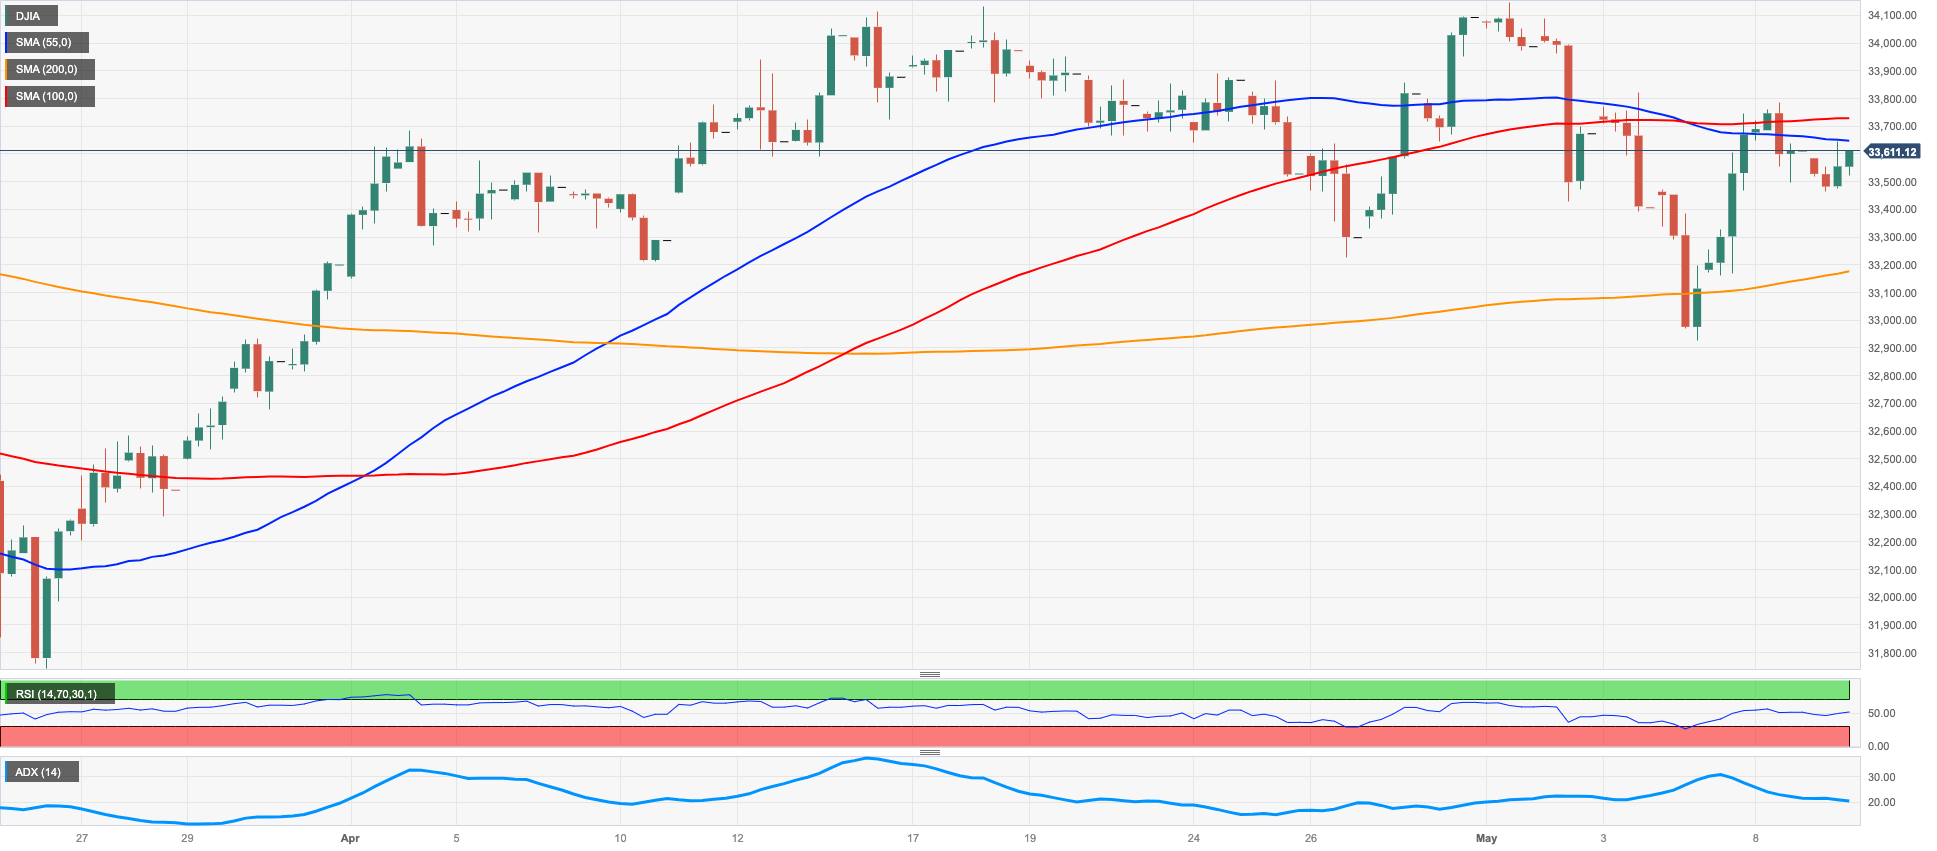
The bearish sentiment dominated the mood among investors and motivated the three major US stock indices to trade on the defensive on Tuesday.
Indeed, rising cautiousness ahead of the release of US inflation figures measured by the CPI on Wednesday in combination with discouraging projections from many blue chip companies collaborated with the downtick in equities and kept buyers at bay.
All in all, the Dow Jones retreated 0.11% to 33581, the S&P500 deflated 0.35% to 4123 and the tech-reference Nasdaq Composite dropped 0.53% to 12191.
The Dow Jones is supposed to experience opposition as it keeps on recuperating. The main obstacle it will confront is the May top of 34257 (May 1), trailed by the 2023 pinnacle of 34342 (January 13) and the December 2022 high of 34712 (December 13). The outperform of the last option could propel the index to possibly arrive at the April 2022 high of 35492 (April 21). Notwithstanding, in the event that the Dow encounters a downfall, it might find support at the May low of 32967 (May 4), trailed by the key 200-day SMA at 32724. Further south, the 2023 low at 31429 (March 15) may offer extra help prior to arriving at the 2022 low at 28660 (October 13). The day-to-day RSI receded to the sub-51 area.
Top Performers: Salesforce Inc, Boeing, Travelers
Worst Performers: Intel, 3M, Nike
Resistance levels: 34257 34334 34712 (4H chart)
Support levels: 33325 32937 31805 (4H chart)
MACROECONOMIC EVENTS

All Information & Updates provided by:

All information relating to the financial markets available on this page has been prepared and issued by FXStreet (Forexstreet SL, Spain, Reg: B62498233) on the basis of publicly available information and all information believed to be reliable and does not conflict with Kuwaiti local laws, and all necessary care has been taken to before the company to ensure that the facts mentioned are correct from the source.
NCM Investment nor any of its directors or employees shall in any way be held responsible for the contents of this news, and the information contained on this page is intended only to provide clients with publicly available information and should not be construed as investment advice, report or analysis and/or constitute an offer or invitation to buy or sell financial instruments of any kind.
RISK WARNING: Forex and CFDs are highly risky leveraged products, as losses can exceed deposits. Please ensure you understand all the risks and take independent advice if necessary. NCM will segregate the clients based on the criteria of the regulator and its bylaws. NCM does not provide any advisory service; the material published does not constitute advice or a recommendation for a transaction in any financial instrument. NCM accepts no responsibility for any use of the content presented and any consequences of that use. Anyone acting on the information provided does so at their own risk.