
- Contact Us:
-

-

-

-


Daily Market Updates
11 May 2023
USDJPY
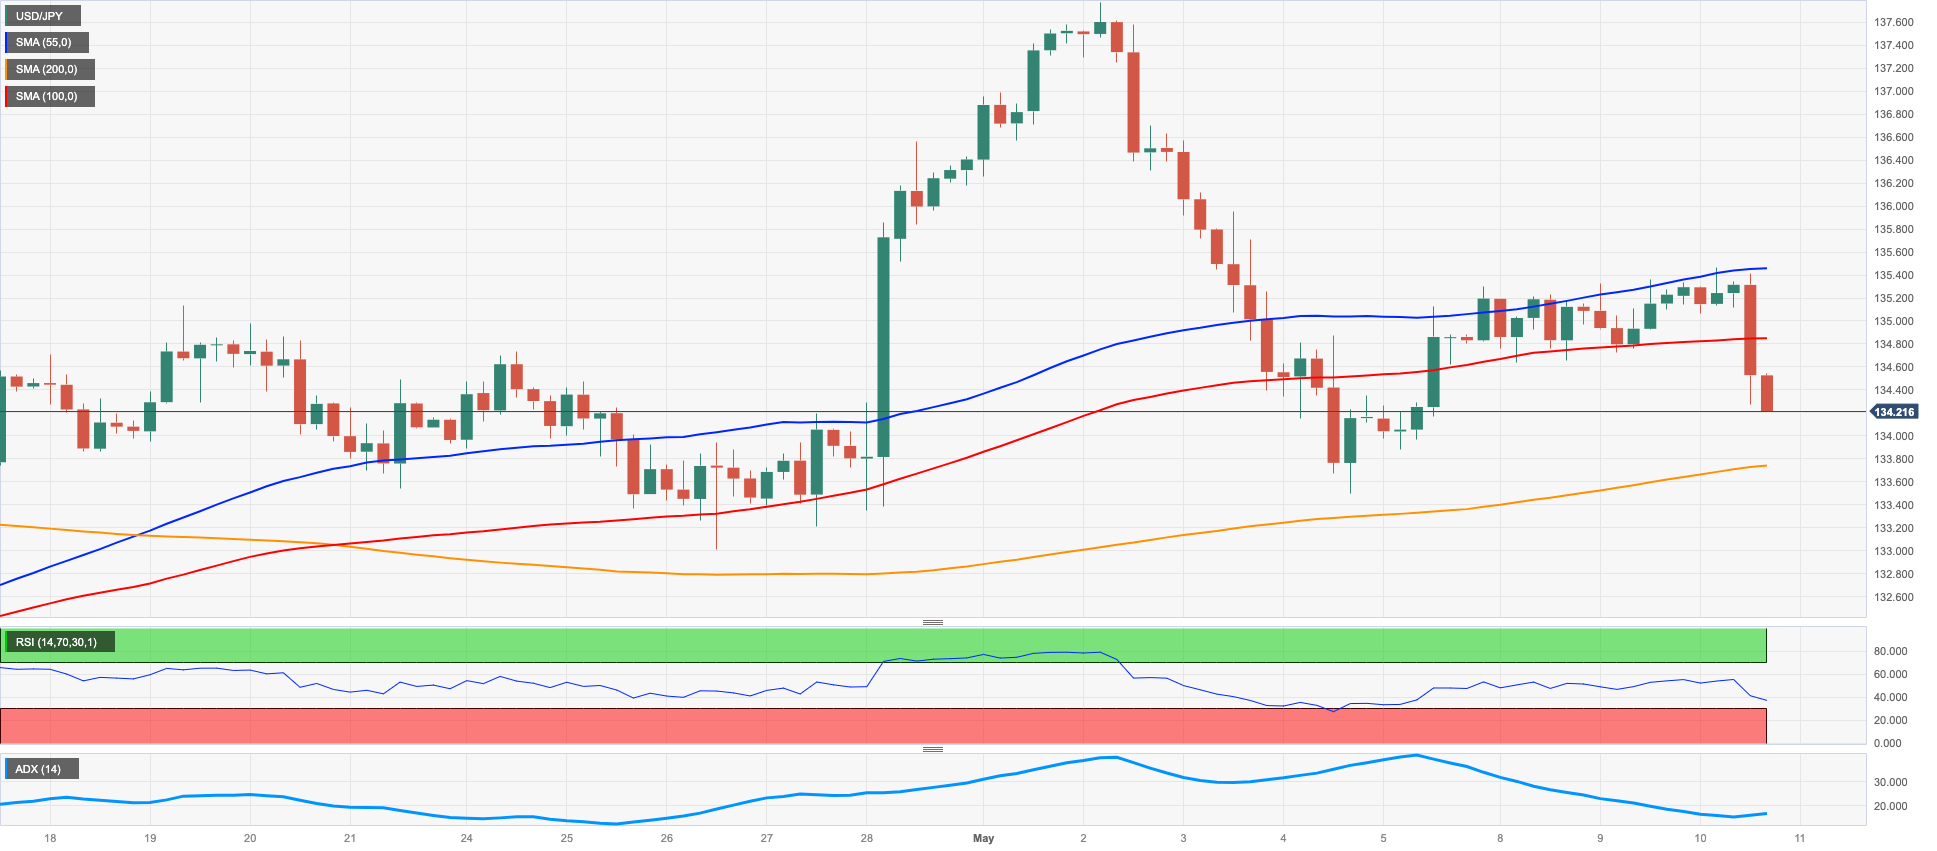
USD/JPY dropped markedly amidst an equally strong correction in both the greenback and US yield rates across the curve.
Indeed, the US dollar saw its daily gains rapidly eroded in response to softer-than-estimated US inflation figures in April. Indeed, further moderation in US consumer prices appears to have given the Fed room to pause its tightening cycle (as soon as at the June event).
By the same token, US yields abruptly changed course and left behind many sessions with gains.
In Japan, preliminary prints for the month of March expect the Coincident Index to hold steady at 98.7 and the Leading Economic Index to ease a tad to 97.5.
The ongoing recovery is met with initial resistance at the 200-day SMA located at 137.00. This resistance level comes before reaching the peak of 137.77 (May 2) and the highest point of the year at 137.91 (March 8). If further gains are achieved, there is potential for a retest of the weekly tops of 139.89 (November 30, 2022) and 142.25 (November 21, 2022). Conversely, if the losses continue, the currency pair is expected to test the weekly low of 133.01 (April 26), which is supported by the temporary 100-day SMA at 132.84. This is followed by a minor support level at 132.01 (April 13). If the decline persists, the pair may reach the April low of 130.62 (April 5), the March low of 129.63 (March 24), and the February low of 128.08 (February 8). The next downside target would be the lowest point of 2023 at 127.21 (January 16). The daily RSI came under pressure and breached the 50 threshold.
Resistance levels: 135.45 137.77 137.91 (4H chart)
Support levels: 134.19 133.49 133.01 (4H chart)
GBPUSD
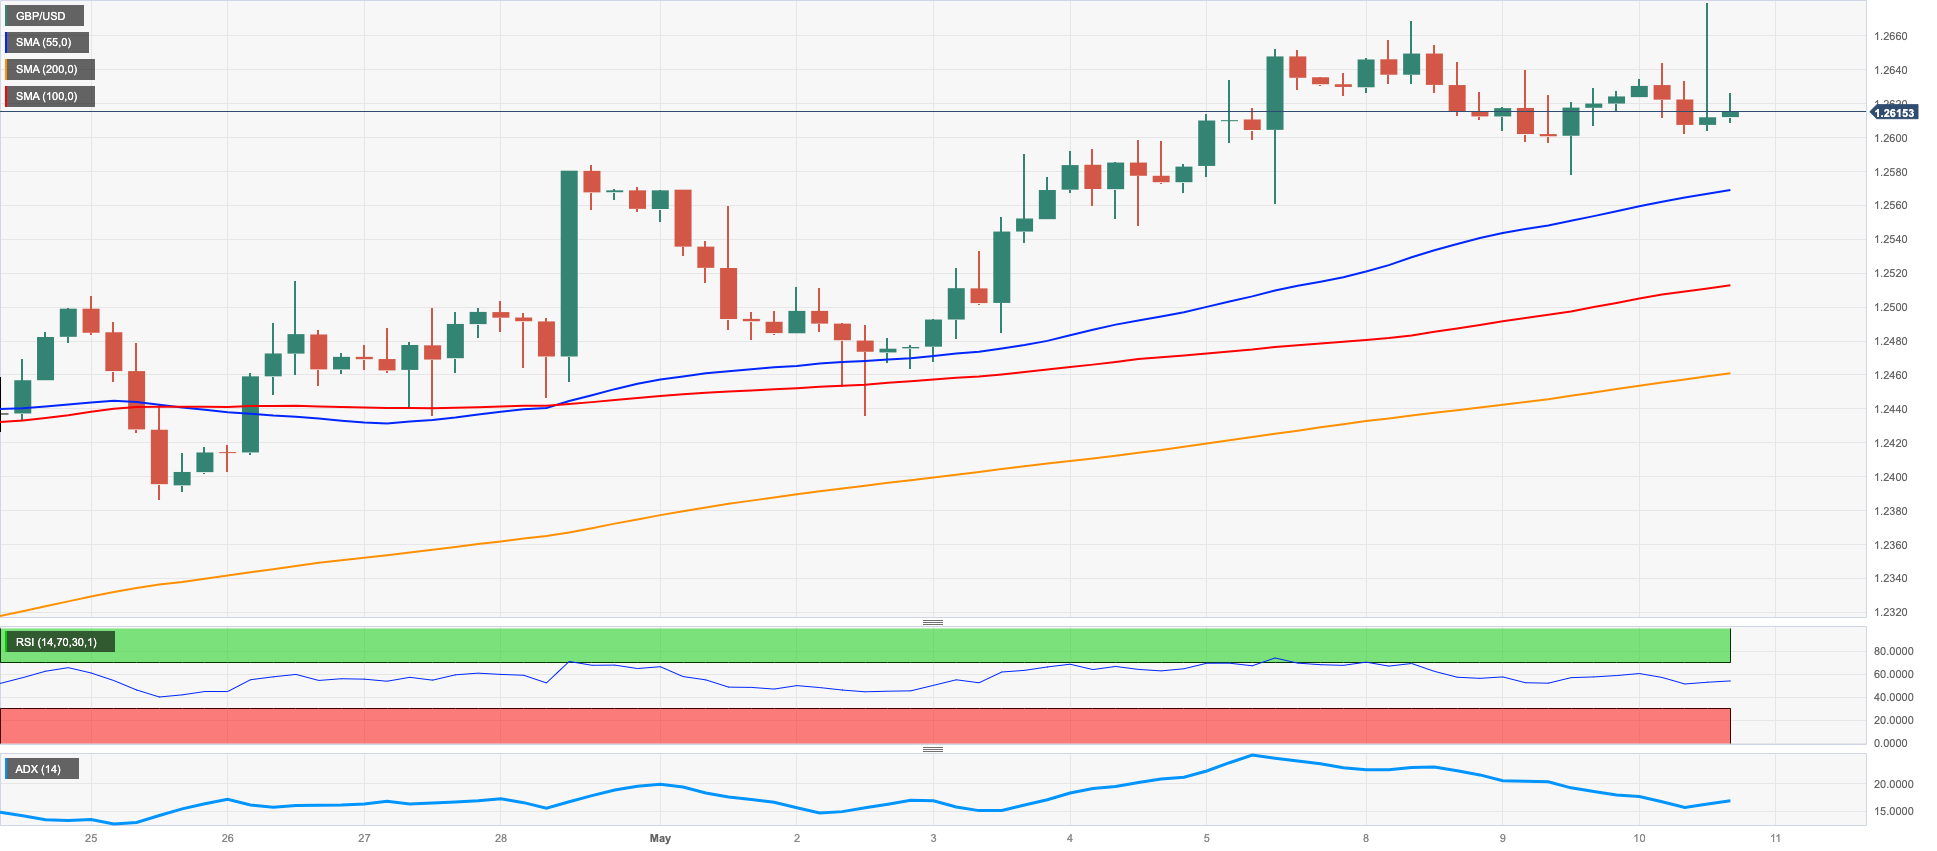
The resumption of the selling bias in the greenback lent fresh legs to the risk complex and motivated GBP/USD to initially climb to new 2023 highs near 1.2680. Cable, however, gave away those gains and ended with humble losses amidst another late bounce in the buck on Wednesday.
Indeed, the greenback quickly faded early gains after US inflation measured by the CPI receded for yet another month in April, confirming the persistent loss of momentum in inflation and adding to the idea that the Fed could likely make an impasse of its hiking cycle in June.
There were no data releases across the Channel on Wednesday other than a 10-year Gilt auction, which came at 3.849%.
GBP/USD faces the next target at the 2023 top at 1.2668 (May 8). Currently, buyers are focused on the 200-week SMA of 1.2865, as well as the psychological level of 1.3000. Alternatively, Cable has immediate support at the May low of 1.2435 (May 2) and the weekly low of 1.2344 (April 10). If these levels are broken, it may trigger a test of the provisional 55-day SMA at 1.2306, followed by the April low at 1.2274 (April 3). In the event of further downward movement, the pair could potentially drop to the significant 200-day SMA at 1.1954, and even reach the 2023 low of 1.1802 (March 8). The daily RSI drifted lower and broke below 62.
Resistance levels: 1.2679 1.2772 1.3089 (4H chart)
Support levels: 1.2577 1.2547 1.2435 (4H chart)
AUDUSD
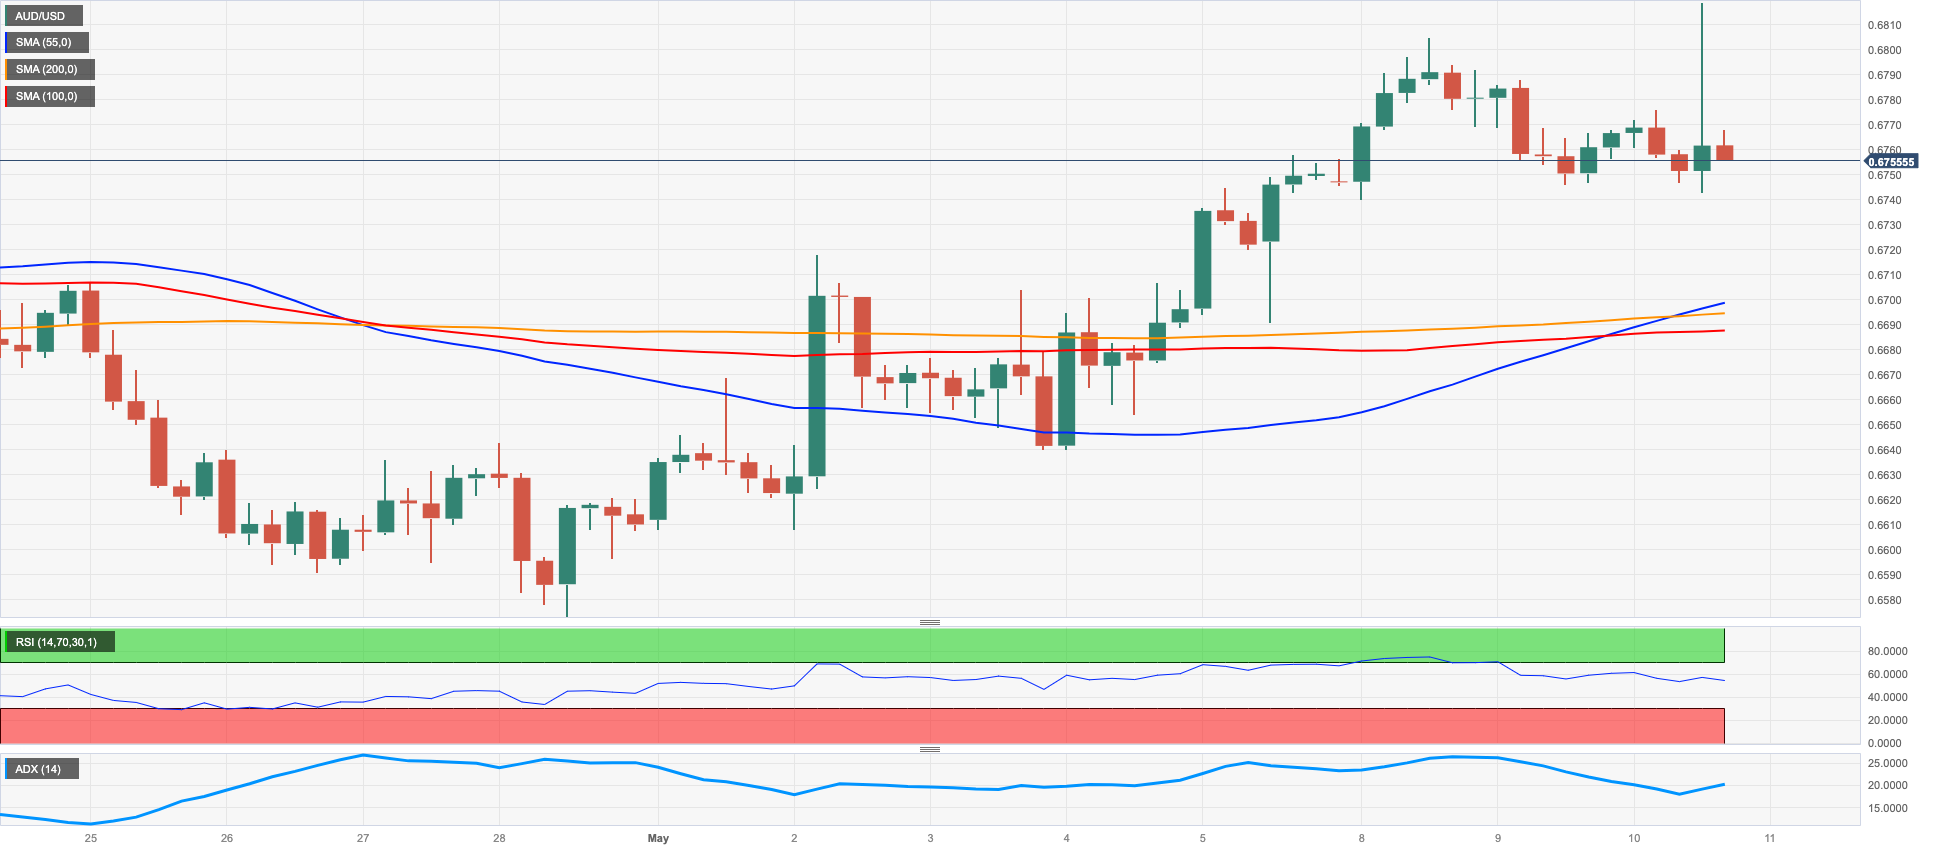
AUD/USD couldn't support the early move to new 3-month tops close to 0.6820 and gave that development over to end Wednesday’s session adding to the earlier day's losses close to 0.6750.
The CPI-led substantial dip in the greenback helped the Aussie dollar to reclaim its grin, although the abrupt uptick lacked follow through.
On the not-so-bright side, the generalized poor performance in the commodity galaxy seems to have also collaborated with the downside bias in spot.
The Australian calendar was empty on Wednesday.
Immediately to the upside for AUD/USD, the next point to watch for is the May high of 0.6818 (May 10). Once this level is cleared, the critical round level of 0.7000 might be a viable goal, followed by the weekly top of 0.7029 (February 14) and the 2023 peak of 0.7157 (February 2nd). On the contrary, the major 200-day SMA at 0.6724 provides initial support for the pair, followed by the provisional 55-day SMA at 0.6690. Further weakening may result in a drop towards the April low of 0.6573 (April 28), before hitting the 2023 low of 0.6563 (March 10) prior to the weekly low of 0.6386 (November 10, 2022) and the November 2022 low of 0.6272. (November 3). The daily RSI lost traction and approached the 56 zone.
Resistance levels: 0.6818 0.6920 0.7029 (4H chart)
Support levels: 0.6744 0.6692 0.6640 (4H chart)
GOLD
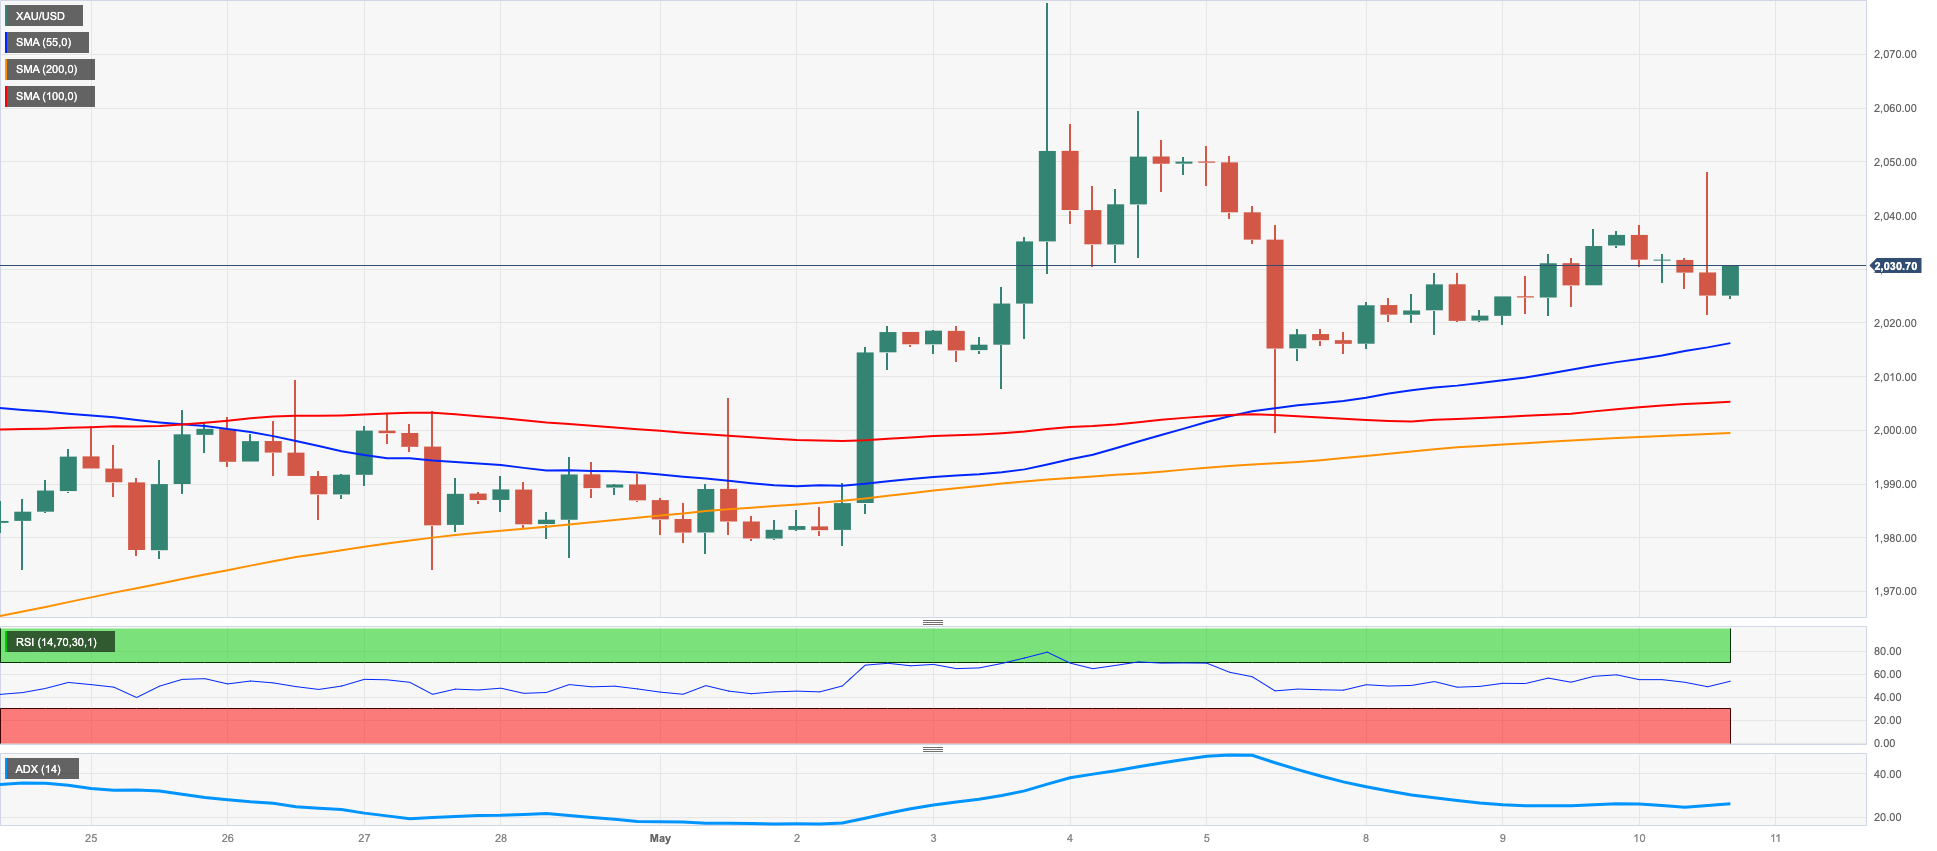
Prices of the ounce troy of gold left behind two daily advances and retreated to the $2020 region on Wednesday.
Sellers returned to the yellow metal after US inflation surprised to the downside in April, removing strength from the weekly recovery despite both the dollar and US yields slipped back to the red territory.
In case the expense of gold continues to rise, it will defy impediment at a couple of levels. The central deterrent will be at the 2023 high of $2067 (May 4), followed eagerly by the 2022 zenith of $2070 (March 8) and before the record-breaking top of $2075 (August 7, 2020). Contrarily, the weekly low of $1969 (April 19) is expected to hold the initial downside test prior to the April low of $1949 (April 3), which appears to be supported by the proximity of the interim 55-day SMA at $1952 and comes before the temporary 100-day SMAs at $1915. In case of extra losses, the yellow metal could pull out to the March low of $1809 (March 8) and eventually to the 2023 low of $1804 (February 28).
Resistance levels: $2048 $2067 $2070 (4H chart)
Support levels: $1999 $1969 $1949 (4H chart)
CRUDE WTI
Prices of the American reference for the sweet light crude oil halted a 4-day positive streak on Wednesday.
In fact, the commodity met a fresh bout of weakness soon after the EIA’s weekly report showed that US crude oil inventories unexpectedly increased by 2.951M barrels in the week to May 5.
Additional data from the agency saw supplies at Cushing rise by 0.397M barrels, Weekly Distillate Stocks drop by 4.170M barrels and gasoline stockpiles decline more than estimated by 3.168M barrels.
Following the publication of the report, demand concerns appear to have resurfaced, which were further magnified by recent disappointing results from the trade balance in China.
Later in the week, traders are likely to pay close attention to the OPEC monthly report (May 11), which is sure to focus on the cartel's views on possible additional oil production cuts.
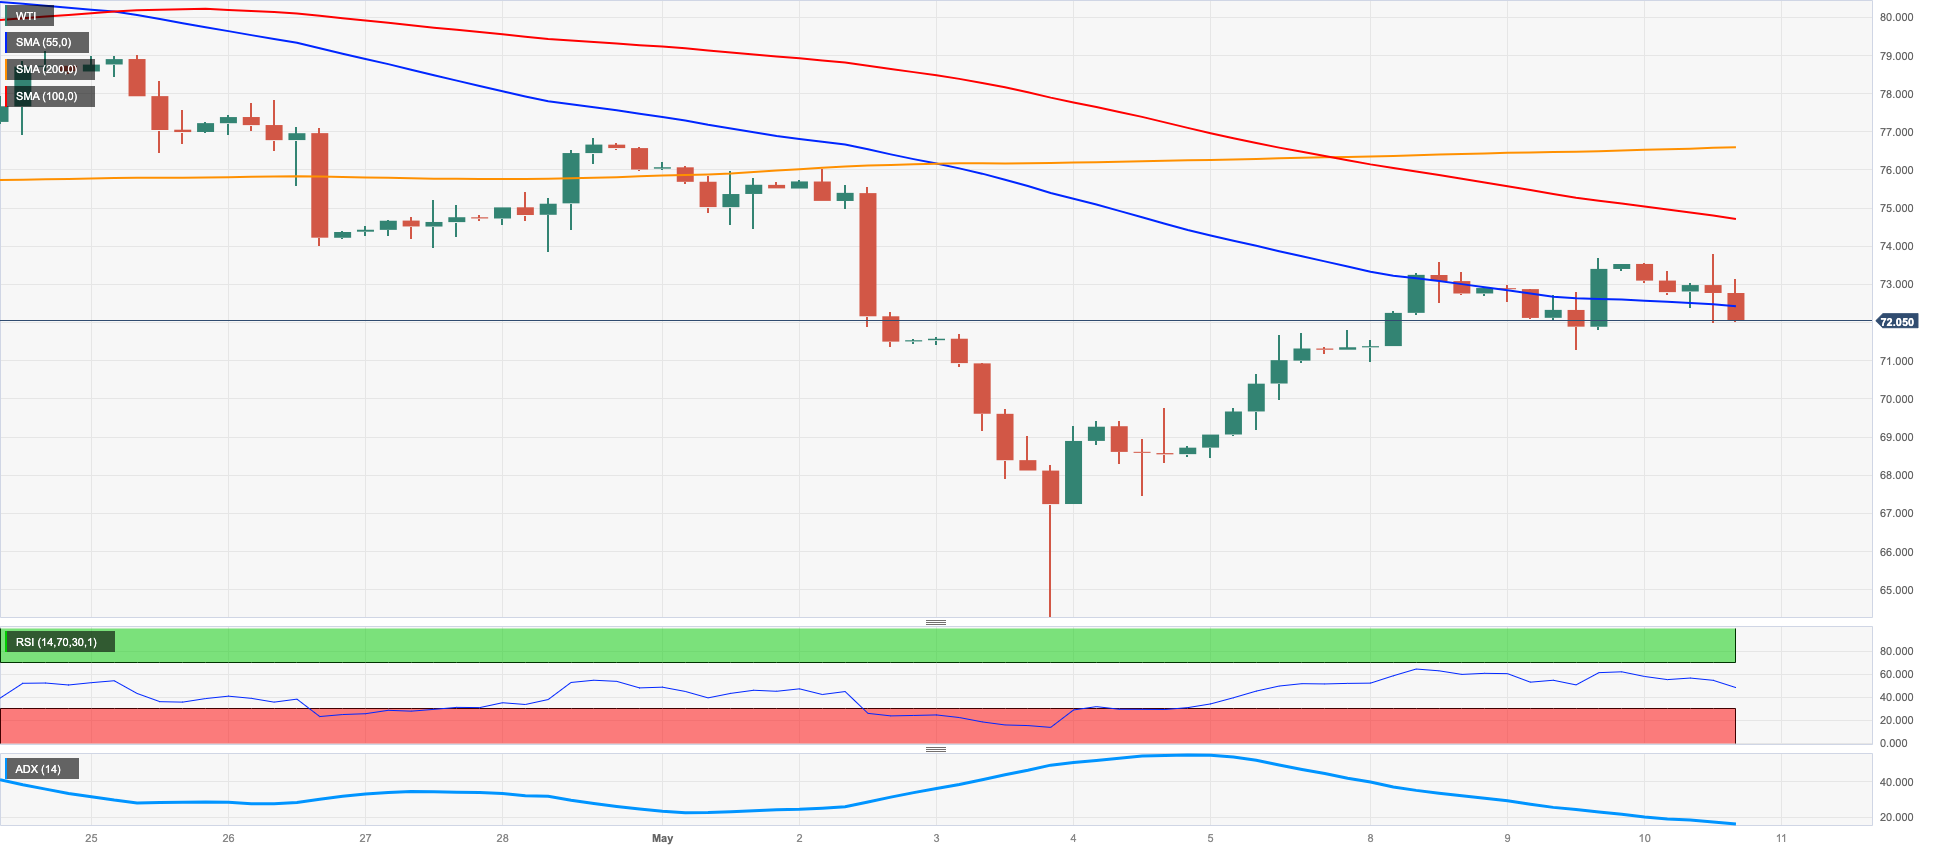
Despite some recent advances, the price of crude oil has been steadily declining. WTI, in instance, has struck a new low for 2023, falling to $63.73 per barrel on May 4. If the December 2021 low of $62.46 (December 2) is cleared, oil prices may fall deeper to the crucial $60 level. Oil prices, on the other hand, may find resistance from sporadic higher swings, with opposition around the weekly high of $79.14 (April 24), near to the important $80 mark. If oil breaks over this resistance, the 200-day SMA of $80.91 may come into play. Prices might rise beyond this level to the 2023 top of $83.49 (April 12), before reaching the November 2022 high of $93.73. (November 7).
Resistance levels: $73.83 $76.88 $79.14 (4H chart)
Support levels: $71.31 $63.61 $62.42 (4H chart)
GER40
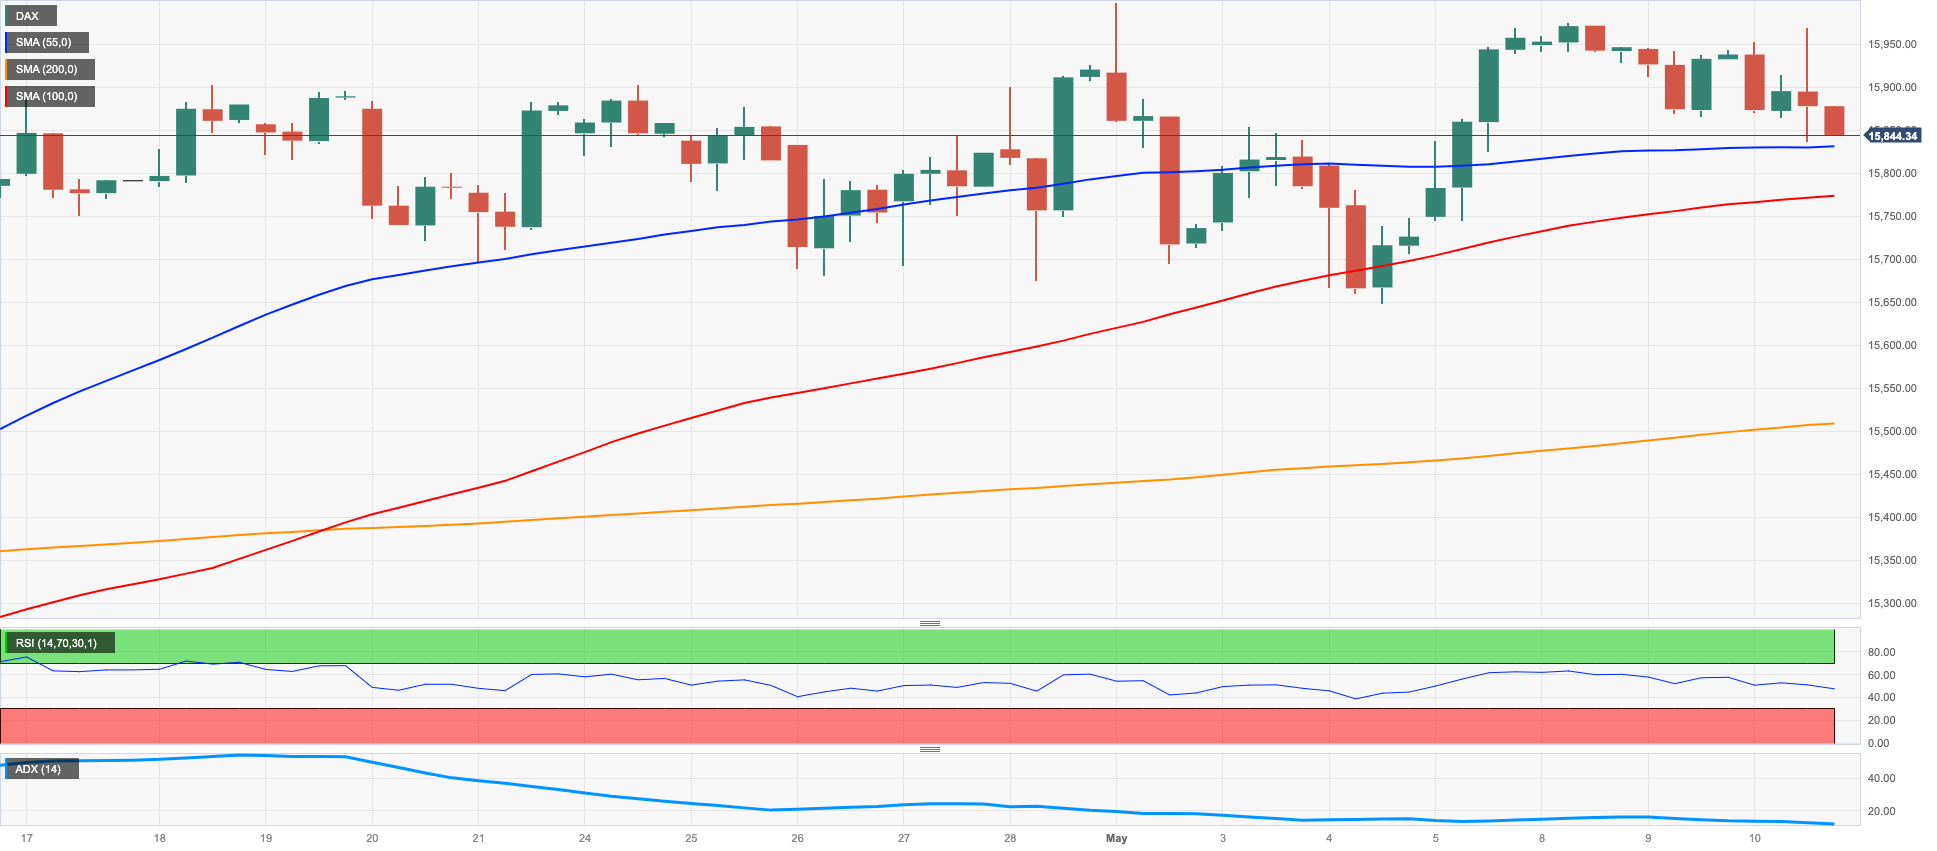
German stocks tracked by the DAX40 dropped to weekly lows near the 15800 region on Wednesday. In the meantime, the index seems to have met quite a tough resistance around the 16000 mark for the time being.
The bearish sentiment prevailed in the old continent on Wednesday amidst still elevated inflation – as per Germany’s final CPI figures – while weaker-than-expected prints from the Italian industrial production also agitated the spectre of an economic slowdown.
The latter was also reinforced by further ECB-speak pointing to extra rate hikes through the summer.
In fact, the index maintained the multi-week consolidative theme in the upper end of the range well in place amidst steady prudence ahead of the publication of US CPI on May 10.
From the German debt market, the 10-year Bund yields reversed two straight sessions with gains and retreated to the sub-2.30% area.
If the DAX40 surpasses the 2023 peak at 16011 (May 2), it could challenge the 2020 top at 16285 (January 5). The May low of 15662 (May 4) could act as a short-term contention area before the 55-day SMA of 15517 and the April low of 15482 (April 5). If the index continues to decline, the 100-day SMA of 15192 could become the next potential support zone. Further downward movement could bring minor support levels such as 14809 (March 24), 14458 (March 20), and the significant 200-day SMA of 14284 into play. The daily RSI grinded lower and revisited the 57 area.
Best Performers: Vonovia, Continental AG, Fresenius SE
Worst Performers: Siemens Healthineers, Munich Re Group, Allianz
Resistance levels: 16011 16090 16285 (4H chart)
Support levels: 15662 15482 14809 (4H chart)
NASDAQ
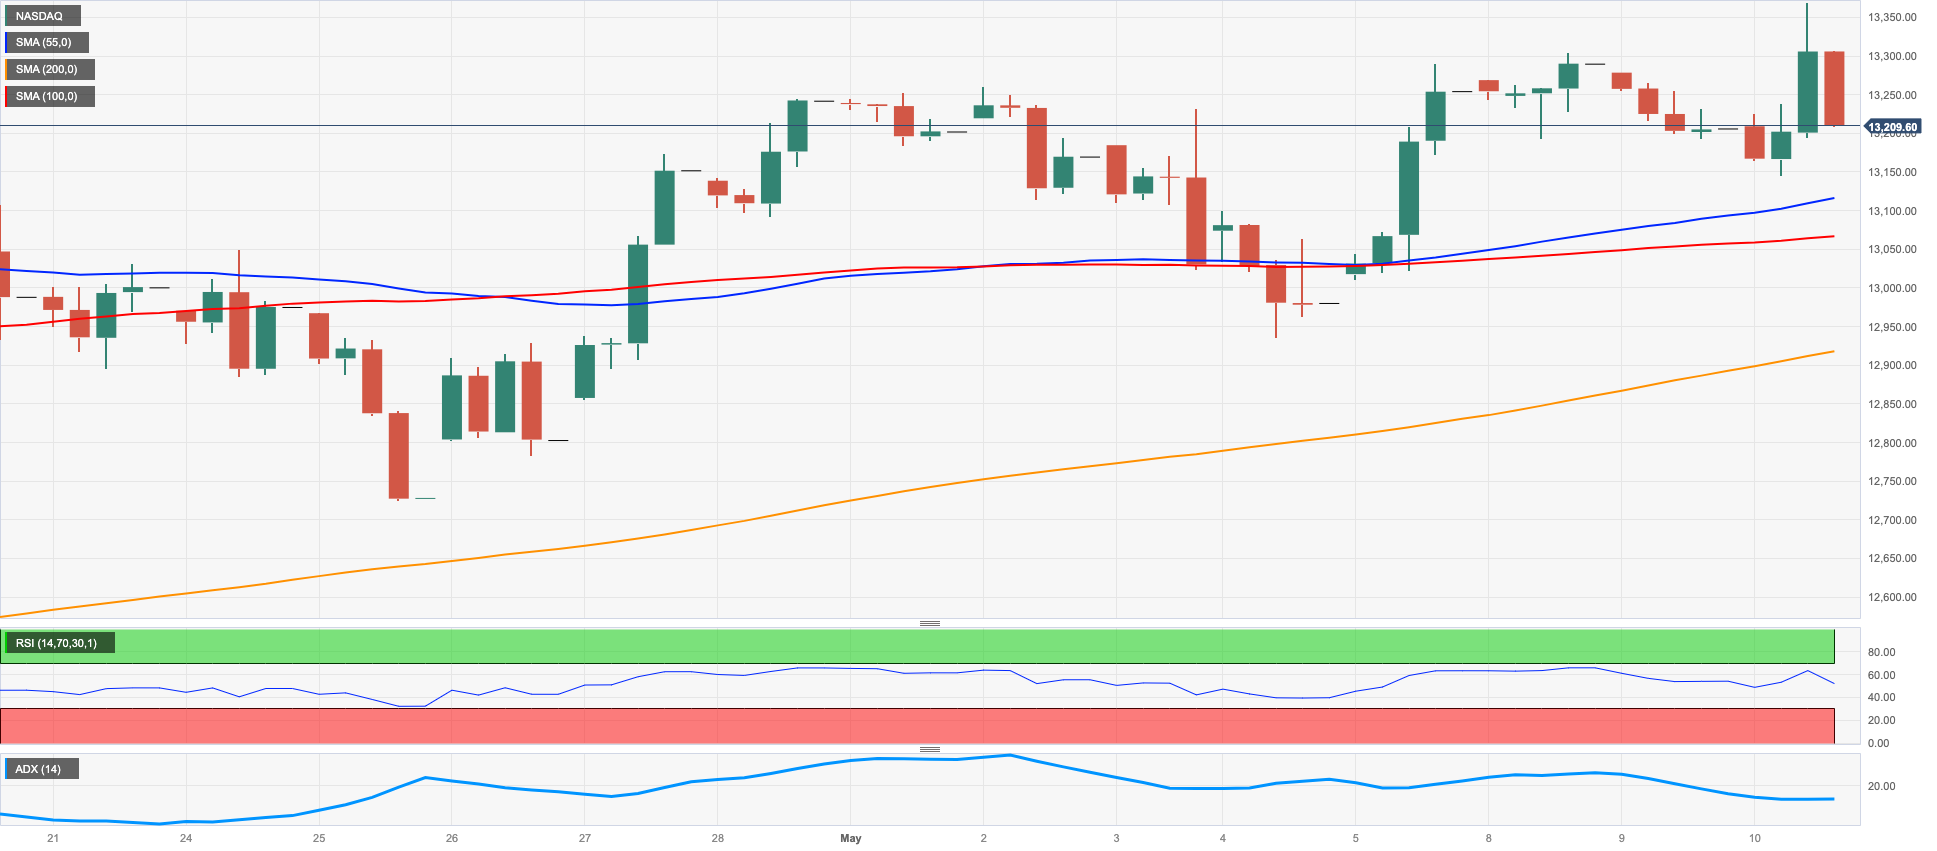
The US tech sector traded in a very positive fashion and encouraged the reference Nasdaq 100 to reach a new YTD high at 13369 on Wednesday.
Indeed, moderating US inflation in combination with the selling pressure in the dollar and the corrective knee-jerk in US yields across the curve all lent support to the index.
Furthermore, the likelihood that the Fed enters an impasse in its normalization process as soon as at the June gathering also boosted the mood among investors.
Further support also came from firm performance from megacaps Alphabet, Apple and Microsoft.
The Nasdaq 100 clocked a new 2023 top at 13369 on May 10 and a solid exhibition in this district might prompt a re-trial of the August 2022 pinnacle of 13720 (August 16) and the critical obstruction level of 14000. Assuming the vertical energy proceeds, the following objective could be the March 2022 high of 15265 (March 29). Having said that, on the off chance that there is a descending pattern, the so far May low at 12938 (May 4) ought to hold the underlying test supported by the April low of 12724 (April 25), which appears propped up by the temporary 55-day SMA at 12710 and comes ahead of the week by week low at 12517 (March 28). In the event that these levels are penetrated, it could set off a re-trial of the key 200-day SMA at 12093, followed by the March low at 11695 (March 13) and the weekly lows at 11550 (January 25) and 11251 (January 19). Further shortcoming might challenge the 2023 low at 10696 (January 6). The day-to-day RSI picked up pace and approached the 60 region.
Top Gainers: Zscaler, Datadog, Illumina
Top Losers: Airbnb, Warner Bros Discovery Inc, PayPal Holdings Inc
Resistance levels: 13369 13720 14277 (4H chart)
Support levels: 12938 12724 12517 (4H chart)
DOW JONES
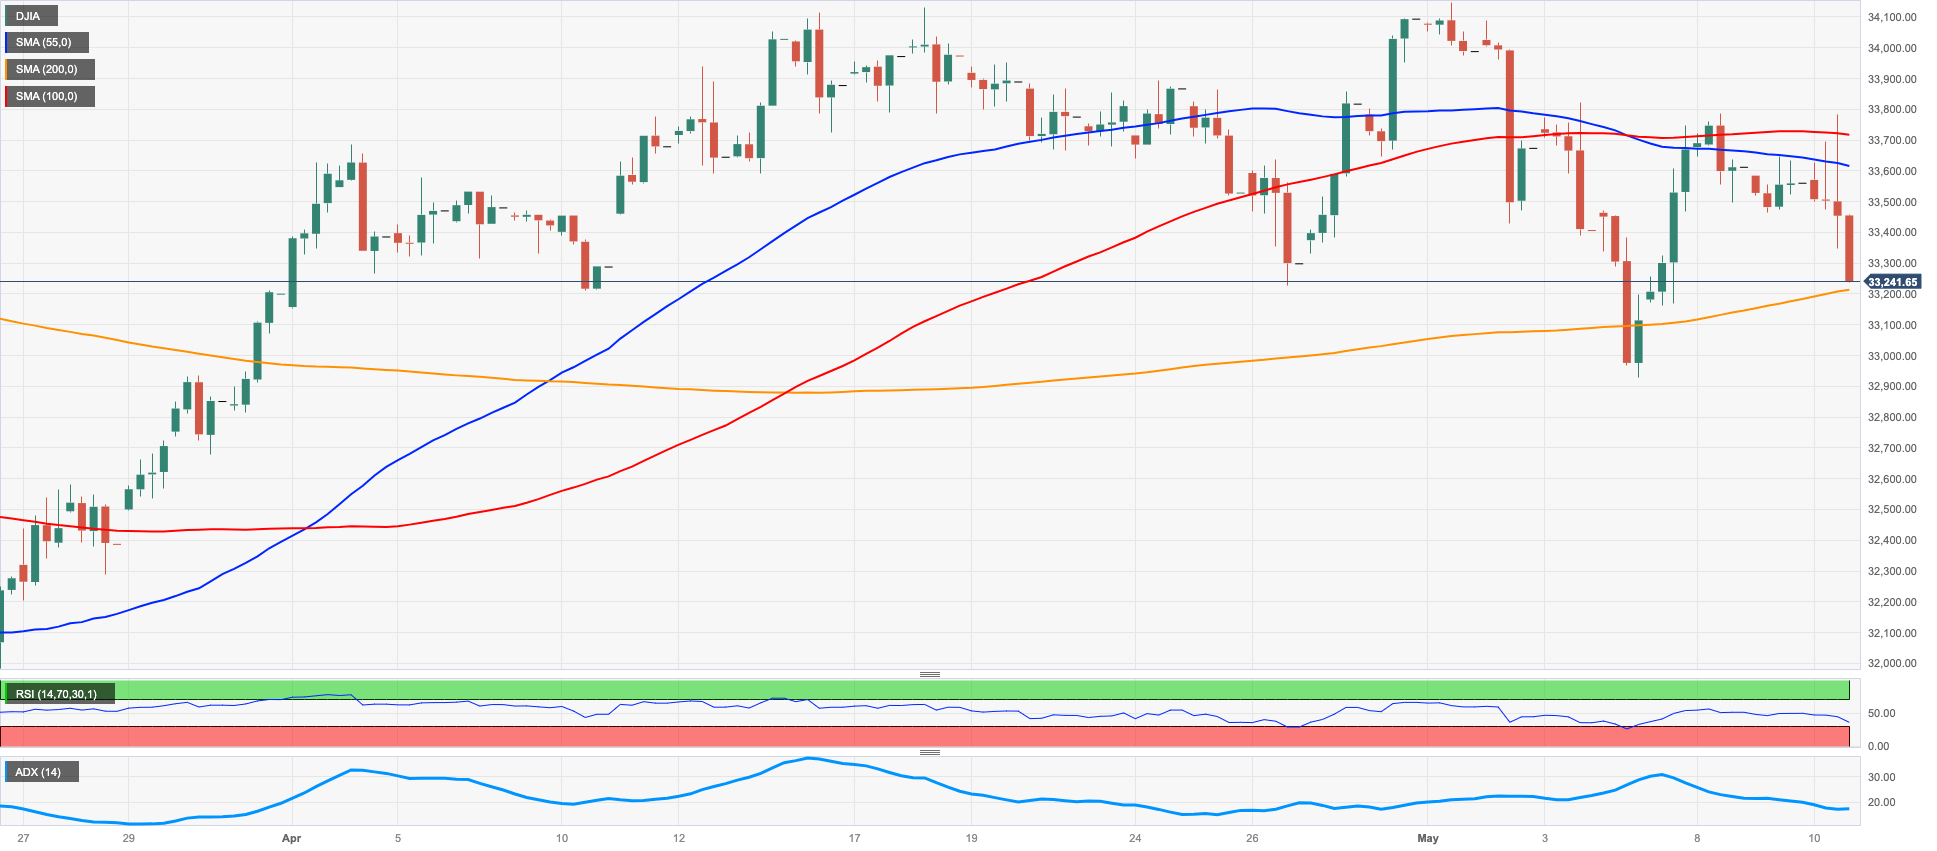
US equities tracked by the Dow Jones extended the bearish move for the third session in a row on Wednesday.
The downtick in the benchmark index came despite softer-than-expected US inflation figures supported speculation that the Fed might pause its hiking cycle in June, while some speculation over rate cuts as soon as this summer has already started to pick up pace.
Instead, investors appeared concerned about the health of the US banking sector, while the omnipresent debt ceiling issue also added to the sour mood on Wednesday
Overall, the Dow Jones dropped 0.93% to 33250, the S&P500 retreated 0.41% to 4117 and the tech-heavy Nasdaq Composite advanced 0.07% to 12188.
Further decline in the Dow may find support at the low reached in May at 32937 (May 4) followed by the key 200-day SMA at 32740. Moving further downward, the 2023 low at 31429 (March 15) may provide additional support before reaching the low of 2022 at 28660 (October 13). However, the index is expected to face resistance in case bulls regain the upper hand. Its primary hurdle will be the May peak at 34257 (May 1), seconded by the highest point of 2023 at 34,342 (January 13) and the December 2022 high of 34712 (December 13). Surpassing the latter could potentially propel the Dow towards the top recorded in April 2022 at 35492 (April 21). The day-to-day RSI retreated to the vicinity of 47.
Top Performers: Salesforce Inc, Microsoft, Apple
Worst Performers: American Express, Nike, Chevron
Resistance levels: 33772 34257 34334 (4H chart)
Support levels: 33320 32937 31805 (4H chart)
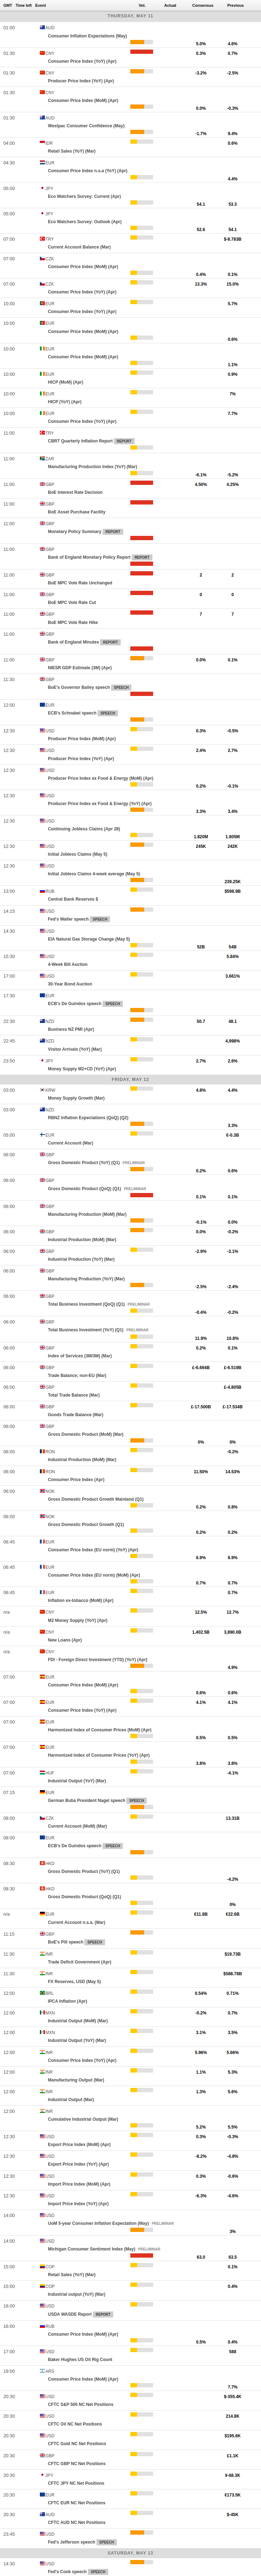
MACROECONOMIC EVENTS
All Information & Updates provided by:

All information relating to the financial markets available on this page has been prepared and issued by FXStreet (Forexstreet SL, Spain, Reg: B62498233) on the basis of publicly available information and all information believed to be reliable and does not conflict with Kuwaiti local laws, and all necessary care has been taken to before the company to ensure that the facts mentioned are correct from the source.
NCM Investment nor any of its directors or employees shall in any way be held responsible for the contents of this news, and the information contained on this page is intended only to provide clients with publicly available information and should not be construed as investment advice, report or analysis and/or constitute an offer or invitation to buy or sell financial instruments of any kind.
RISK WARNING: Forex and CFDs are highly risky leveraged products, as losses can exceed deposits. Please ensure you understand all the risks and take independent advice if necessary. NCM will segregate the clients based on the criteria of the regulator and its bylaws. NCM does not provide any advisory service; the material published does not constitute advice or a recommendation for a transaction in any financial instrument. NCM accepts no responsibility for any use of the content presented and any consequences of that use. Anyone acting on the information provided does so at their own risk.