
- Contact Us:
-

-

-

-


Daily Market Updates
12 May 2023
USDJPY
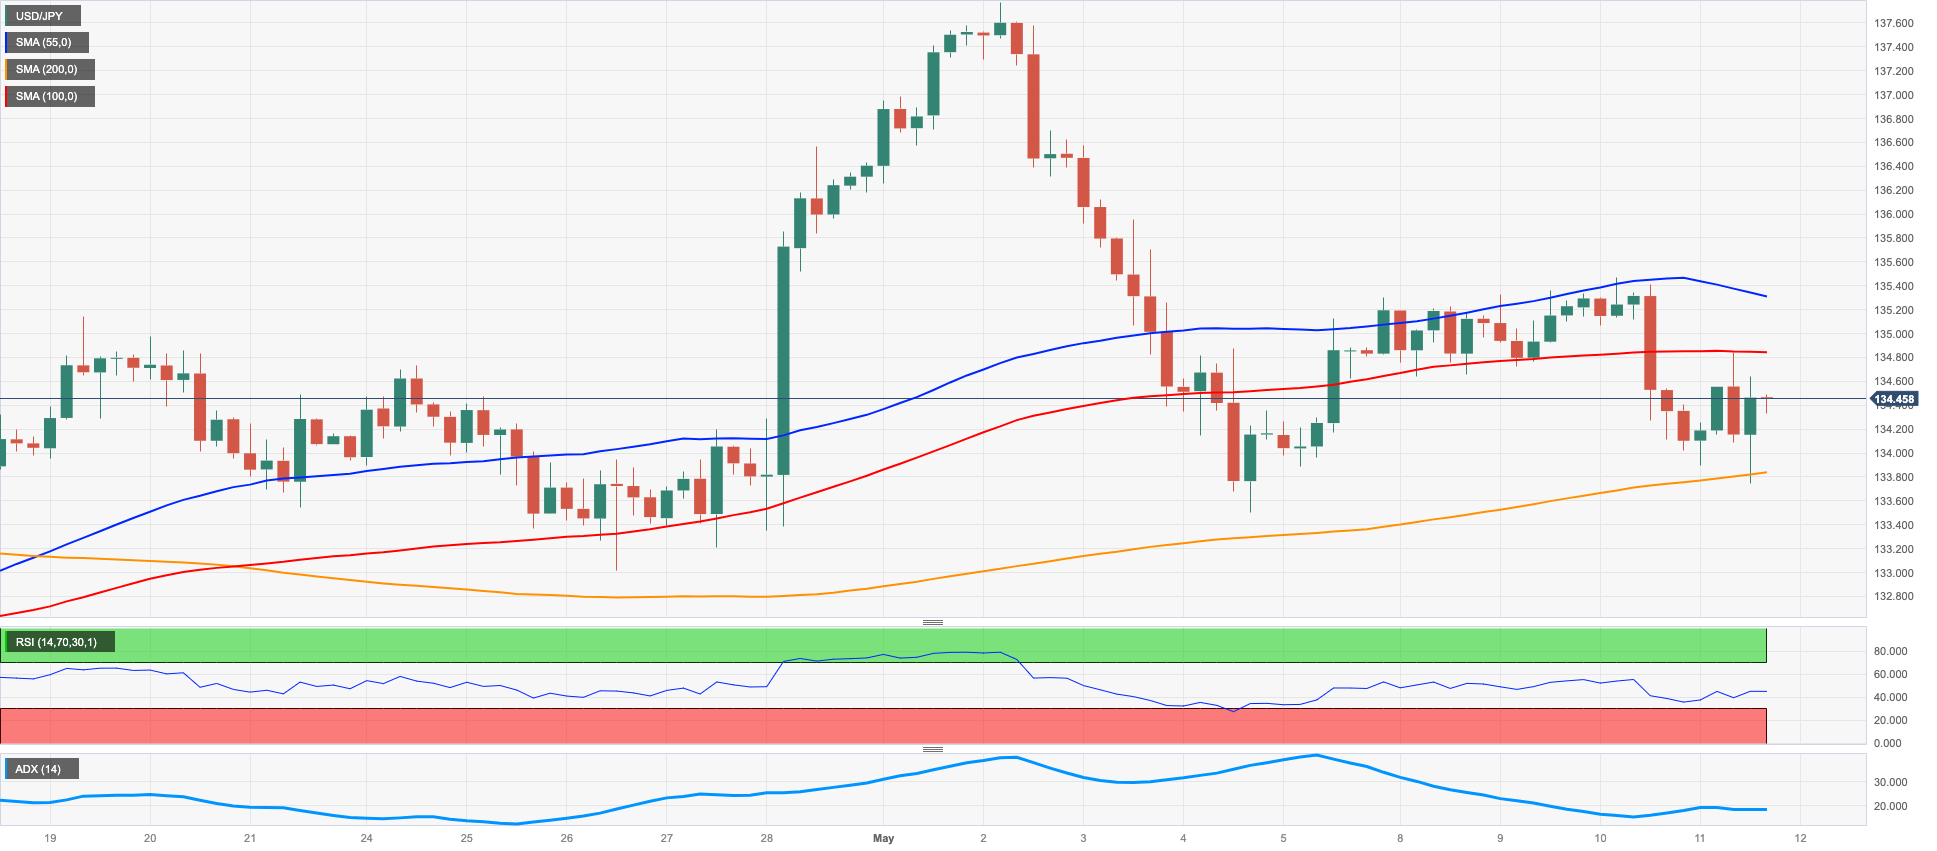
USD/JPY kept the erratic activity on Thursday, this time regaining the smile and approaching the key 135.00 hurdle following Wednesday’s strong drop.
The sharp rebound in the greenback, in the meantime, sponsored the daily improvement in the pair, helped by the moderated resumption of the risk aversion, while US and Japanese yields grinded lower.
From the BoJ Summary of Opinions of the latest monetary policy meeting, one member believed that the risks of making adjustments too soon were greater than those of making adjustments too late. Another thought that the 2% inflation target was becoming visible, and that it was important to act quickly in order to monitor prices. Another member saw no need to modify Yield Curve Control (YCC) given the recent improvement, while another anticipated high pay raises in the coming year.
Further releases in the domestic docket saw Bank Lending expanding 3.2% in the year to April and Foreign Bond Investment shrinking to ¥635.2B in the week to May 6. Additionally, the Eco Watchers Survey Current ticked higher to 54.6 in April and the Eco Watchers Survey Outlook improved to 55.7 in the same period.
The recovery in USD/JPY faces an initial resistance level at the weekly high of 135.47 (May 10) seconded by the key 200-day SMA at 137.01 and prior to the May high of 137.77 (May 2) and the 2023 peak of 137.91 (March 8). In the event that further gains are accomplished, there is potential for a retest of the week-by-week highest points of 139.89 (November 30, 2022) and 142.25 (November 21, 2022). On the other hand, spot is anticipated to test the weekly low of 133.01 (April 26) if the losses continue. This support level appears reinforced by the interim 100-day SMA at 132.86. On April 13, a minor support level of 132.01 follows. The pair may reach the April low of 130.62 (April 5), the March low of 129.63 (March 24), and the February low of 128.08 (February 8) if the decline continues. The lowest point of 2023, which would be 127.21 (January 16), would be the next downside target. The day-to-day RSI showed some signs of life and approached the 51 region.
Resistance levels: 134.84 135.45 137.77 (4H chart)
Support levels: 133.74 133.49 133.01 (4H chart)
GBPUSD
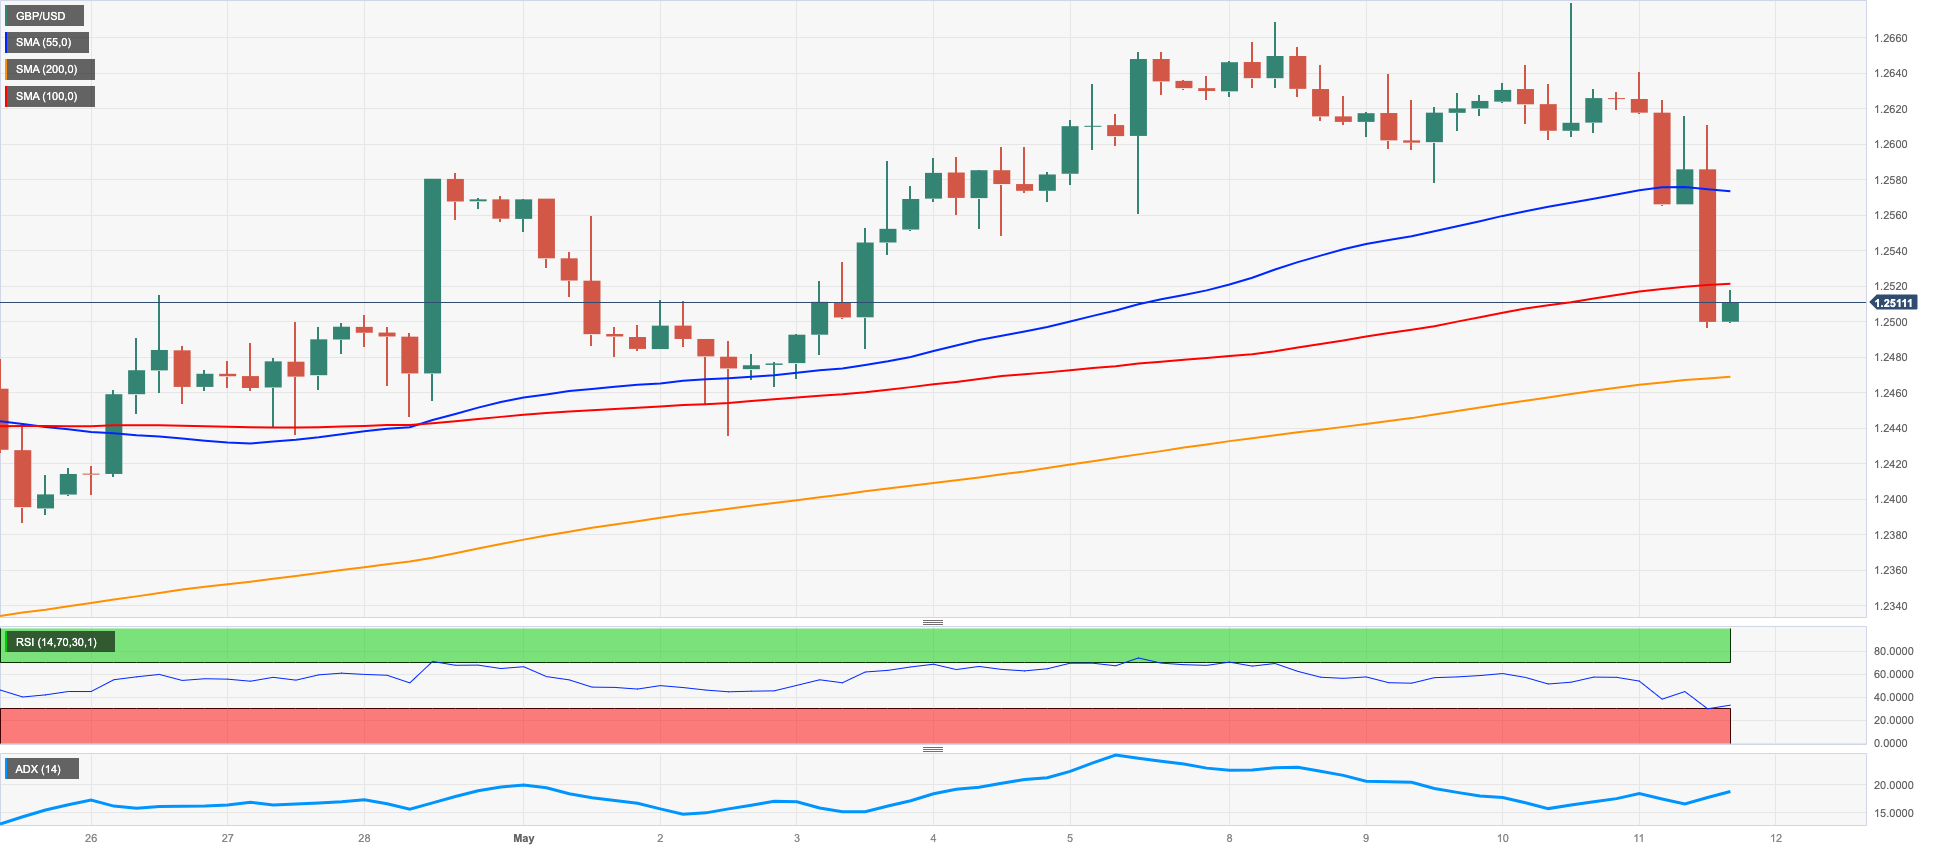
There was no respite for the downside bias in the risk complex on Thursday.
Against that, GBP/USD plummeted to the boundaries of 1.2500 the figure, or multi-session lows, in response to the relentless move higher in the greenback, which was in turn underpinned by the persistent risk aversion in the global markets.
The British pound, in the meantime, failed to gather any upside traction despite the BoE raised the policy rate by 25 bps as widely anticipated and signaled that further hikes remain in store. Usual dove MPC members Tenreyro and Dhingra voted to keep rates on hold.
Indeed, the BoE currently saw inflation withdrawing at a slower speed than that proposed in February, while it left the direction on interest rates unchanged at the time when it expressed worries over food inflation and core good costs. Additionally, the BoE pointed out that there is a significant upside bias in inflation risks, and that maintaining elevated inflation would necessitate additional tightening. Furthermore, the central bank does not anticipate a return to recession.
Later in the session, Governor A. Bailey noted that the outlook for growth and employment has improved despite inflation remaining too elevated. He emphasized the resilience of the UK economy and reiterated that consumer prices are seen falling sharply from April, while pressures in the labour market have mitigated.
In the UK money market, the 10-year Gilt yields dropped to weekly lows near 3.65%, in line with the rest of their G10 peers.
In case the downside in GBP/USD gathers fresh impulse, it should meet immediate support at the May low of 1.2435 (May 2) followed by the weekly low of 1.2344 (April 10). If these levels are breached, it may trigger a test of the temporary 55-day SMA at 1.2315, ahead of the April low at 1.2274 (April 3). Further downward movement could potentially bring the pair to the significant 200-day SMA at 1.1956 prior to the 2023 low of 1.1802 (March 8). On the upside, Cable is currently targeting its next level at the 2023 high of 1.2668 (May 8), but buyers are also focused on the 200-week SMA of 1.2865 and the psychological level of 1.3000. The daily RSI dropped to the area below the 53 level.
Resistance levels: 1.2679 1.2772 1.3089 (4H chart)
Support levels: 1.2496 1.2463 1.2435 (4H chart)
AUDUSD
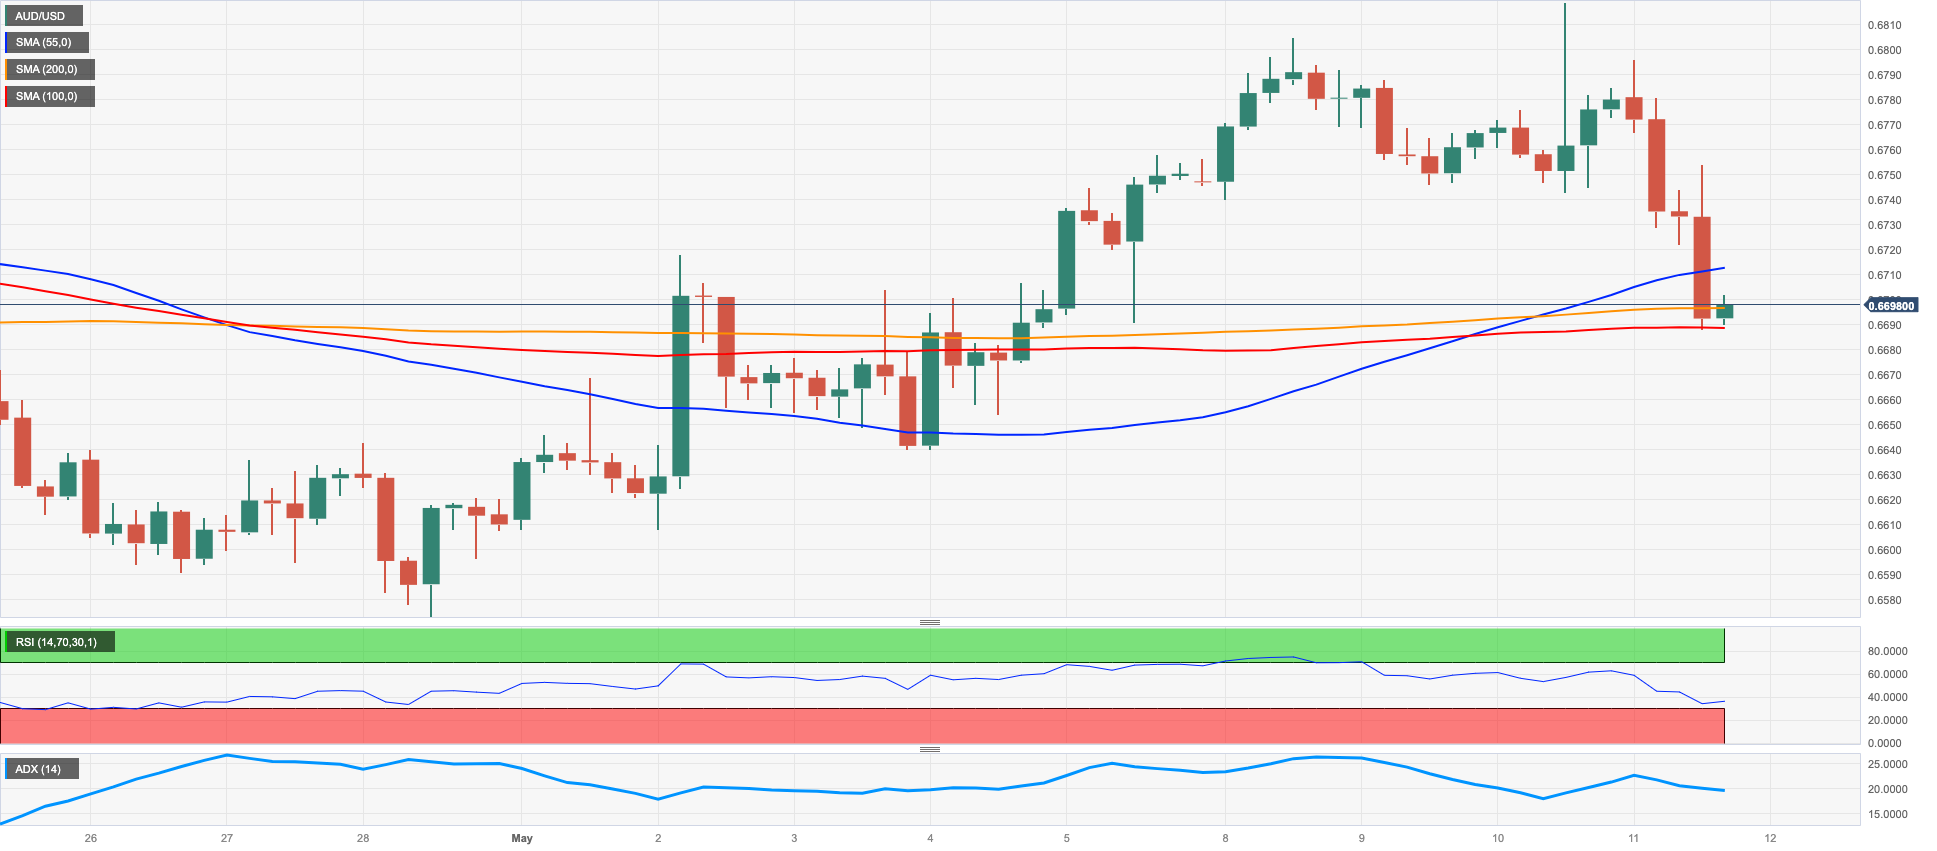
In line with the rest of the risk-linked universe, AUD/USD collapsed more than a cent and sank below the 0.6700 mark on Thursday, recording at the same time new multi-day lows in an area also coincident with the interim 55-day SMA.
The intense bounce in the greenback and the prevailing atmosphere of rising risk aversion played against any bullish attempt in the Aussie dollar, which derived extra weakness from the negative performance of the commodity space, where copper prices melted to new YTD lows and the iron ore surprisingly ended the session with marginal gains.
In Oz, Consumer Inflation Expectations rose to 5.0% in May (from 4.6%).
The weekly low of 0.6689 (May 11) emerges as the immediate contention area for AUD/USD. Further weakening could lead to a decline towards the April low of 0.6573 (28 April), before the 2023 low at 0.6563 (10 March) and ahead of the weekly low of 0.6386 (10 November 2022) and the November 2022 low at 0.6272. (3 November). In contrast, the next up-barrier to watch is the May high of 0.6818 (May 10). Once above this level, the critical round level of 0.7000 could be a realistic target, followed by the weekly high of 0.7029 (14 February) and the 2023 peak of 0.7157 (2 February). The daily RSI retreated to the sub-50 zone.
Resistance levels: 0.6818 0.6920 0.7029 (4H chart)
Support levels: 0.6688 0.6640 0.6620 (4H chart)
GOLD
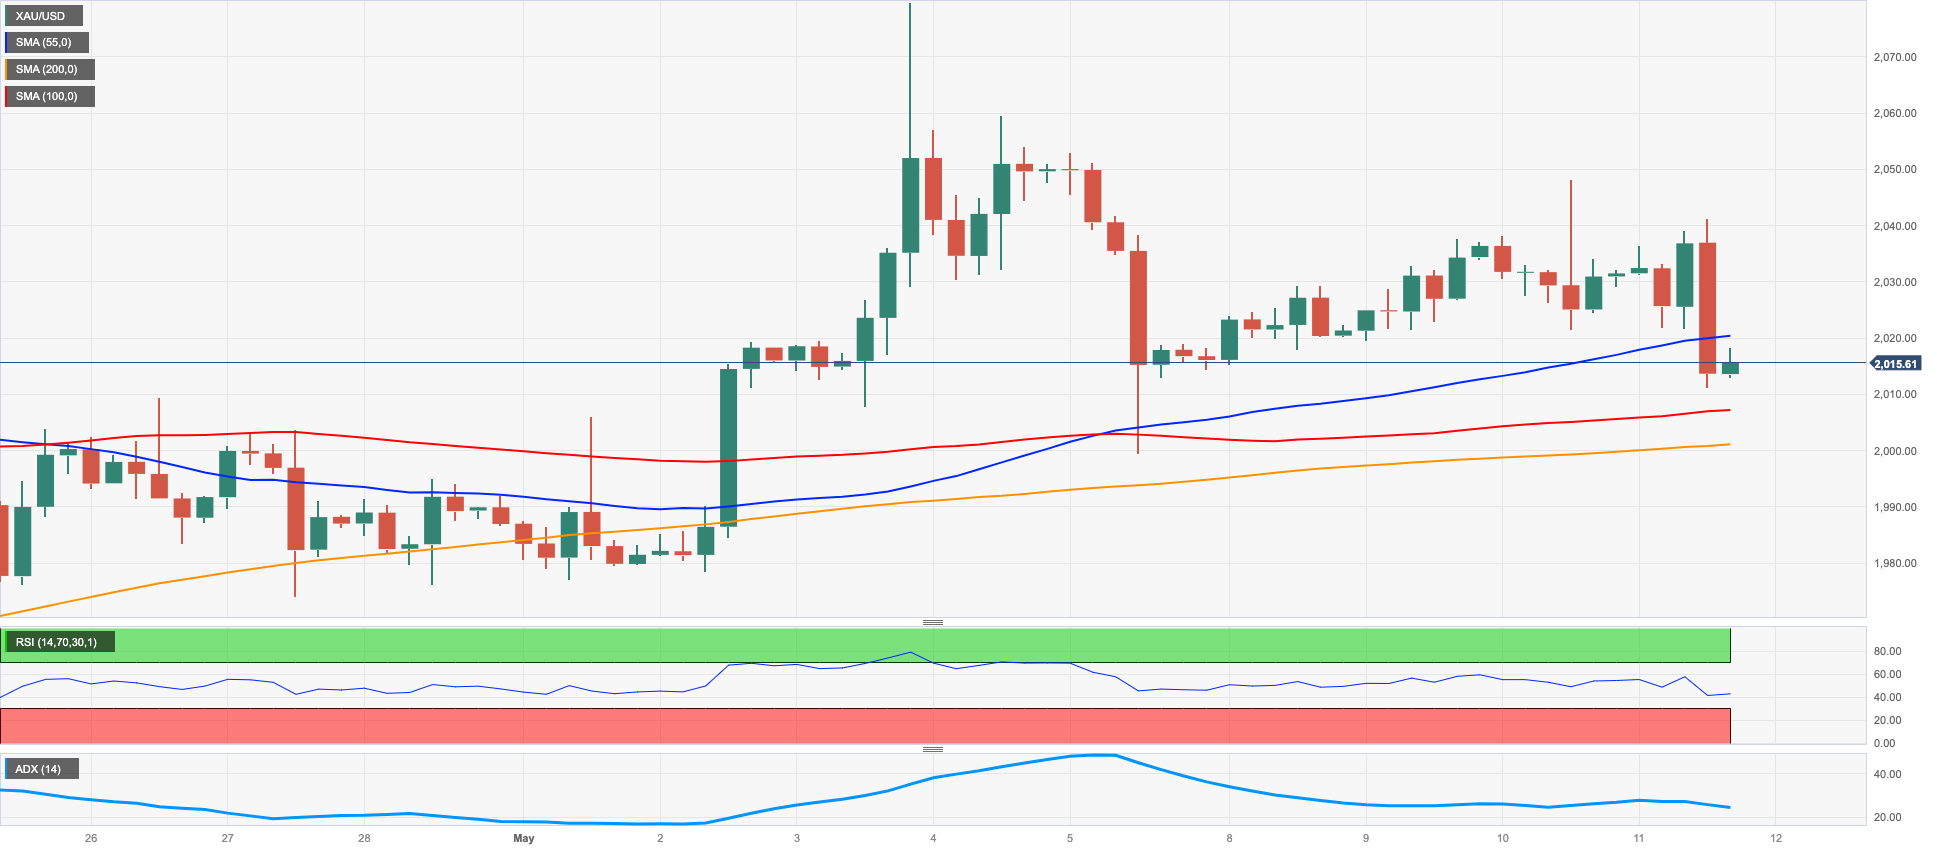
The sharp advance in the greenback was almost exclusively behind the second consecutive daily pullback in prices of the yellow metal, which seem to have met some decent contention near $2010 on Thursday.
In fact, bullion failed to garner some upside bias despite the resurgence of the risk aversion in the global markets, which was particularly exacerbated on the back of banking jitters and ongoing debt ceiling discussions.
In the meantime, the $2000 mark per ounce troy is expected to hold the initial downside test in case the selling pressure intensifies, although speculation of a potential Fed’s impasse at the June 14 meeting are seen limiting any bearish moves around bullion so far.
If the price of gold breaks above the current consolidative theme, it will face resistance at multiple levels. The primary obstacle will be at the highest point reached in 2023, which was $2067 on May 4 ahead of the 2022 peak of $2070 (March 8), and the all-time top of $2075 (August 7, 2020). On the flip side, there is a minor support at $1999 (May 5) prior to the weekly low of $1969 (April 19). The latter is followed by the April low of $1949 (April 3), which is reinforced by the nearby 55-day SMA ($1955), and comes before the provisional 100-day SMA at $1917. If further losses occur, bullion could drop to the March low of $1809 on March 8, and potentially even reach the lowest point of 2023, which was $1804 (February 28).
Resistance levels: $2048 $2067 $2070 (4H chart)
Support levels: $2011 $2000 $1969 (4H chart)
CRUDE WTI
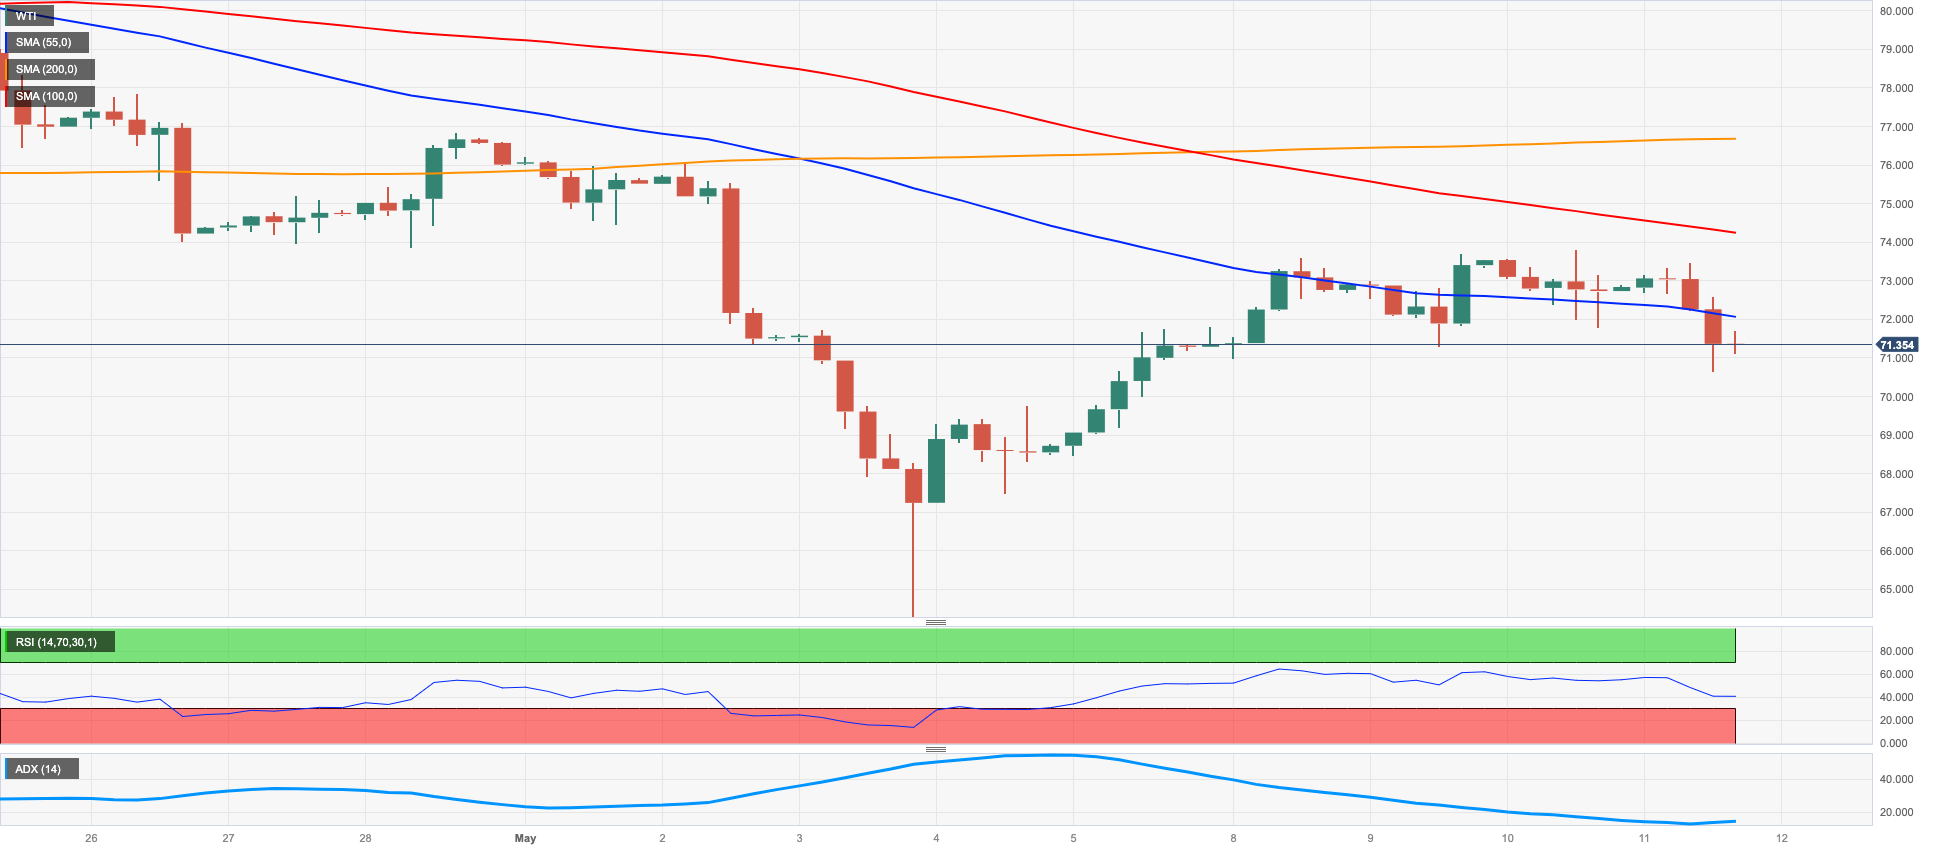
Crude oil prices declined for the second straight session and briefly pierced the $71.00 mark per barrel of the WTI on Thursday.
Recession concerns kept doing the rounds among traders, at the same time bolstered by concerns surrounding the US debt ceiling issue and swelling clouds around the outlook for Chinese growth.
Also keeping prices under pressure emerged the strong recovery in the greenback, which propelled the USD Index (DXY) to fresh multi-session tops north of the key 102.00 barrier.
No news from OPEC's monthly report after the cartel left unchanged its global oil demand projection for this year, expecting it to gyrate around 2.32 mbpd. The next OPEC+ meeting is due on June 4.
Later on Friday, driller Baker Hughes will release its weekly oil rig count for the week ended on May 12.
The price of crude oil has been steadily falling for some time, despite some recent advancements. For instance, WTI has fallen to a new 2023 low of $63.73 per barrel on May 4. If the December 2021 low of $62.46 (December 2) is cleared, oil costs might fall further to the essential $60 level. On the contrary, sporadic higher swings should meet the initial hurdle at the weekly high of $79.14 (April 24), which precedes the key $80.00 mark and the critical 200-day SMA at $80.91. Further north emerges the 2023 top of $83.49 (April 12), before the November 2022 peak of $93.73 (November 7).
Resistance levels: $73.83 $76.88 $79.14 (4H chart)
Support levels: $70.68 $63.61 $62.42 (4H chart)
GER40
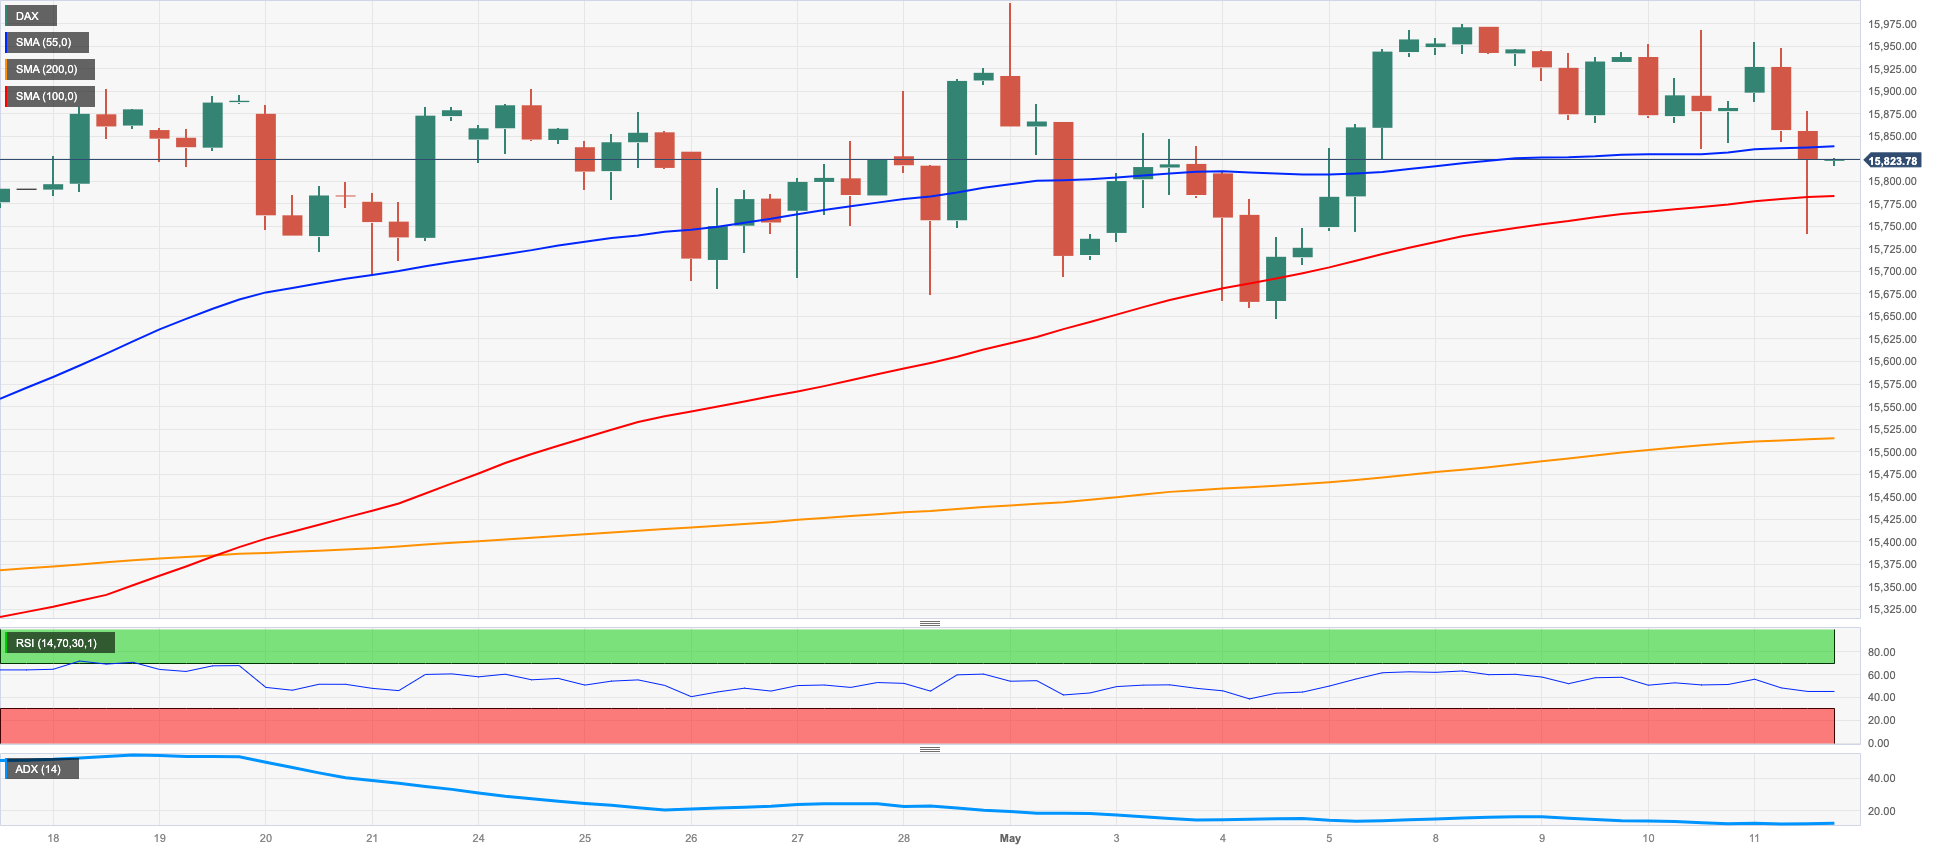
European equities traded on a mixed note on Thursday, with the German reference DAX40 adding to Wednesday’s decline and slipping back to multi-day lows near the 15700 zone.
Chinese growth concerns, unabated unease surrounding the banking sector and the likelihood of further tightening by major central banks kept the sentiment depressed and sponsored another poor session in the index on Thursday.
Echoing the prevailing risk-off mood, the German 10-year yields dropped further and breached the 2.30% level.
The DAX40 could challenge the 2020 peak of 16285 (January 5) if it surpasses the YTD high of 16011 (May 2). On the contrary, and before the 55-day SMA of 15524 and the April low of 15482 (April 5), the May low of 15662 (May 4) could serve as a short-term contention area. The 100-day SMA of 15231 emerges as the next potential support zone in the event that the index declines further. Minor support levels like 14809 (March 24) and 14458 (March 20) and seconded by the significant 200-day SMA of 14296 may come into play in the event of further downward movement. The daily RSI lost the grip and revisited the 54 neighbourhood.
Best Performers: Merck, Adidas, Porsche
Worst Performers: Bayer, Volkswagen VZO, Siemens Energy AG
Resistance levels: 16011 16090 16285 (4H chart)
Support levels: 15754 15662 15482 (4H chart)
NASDAQ
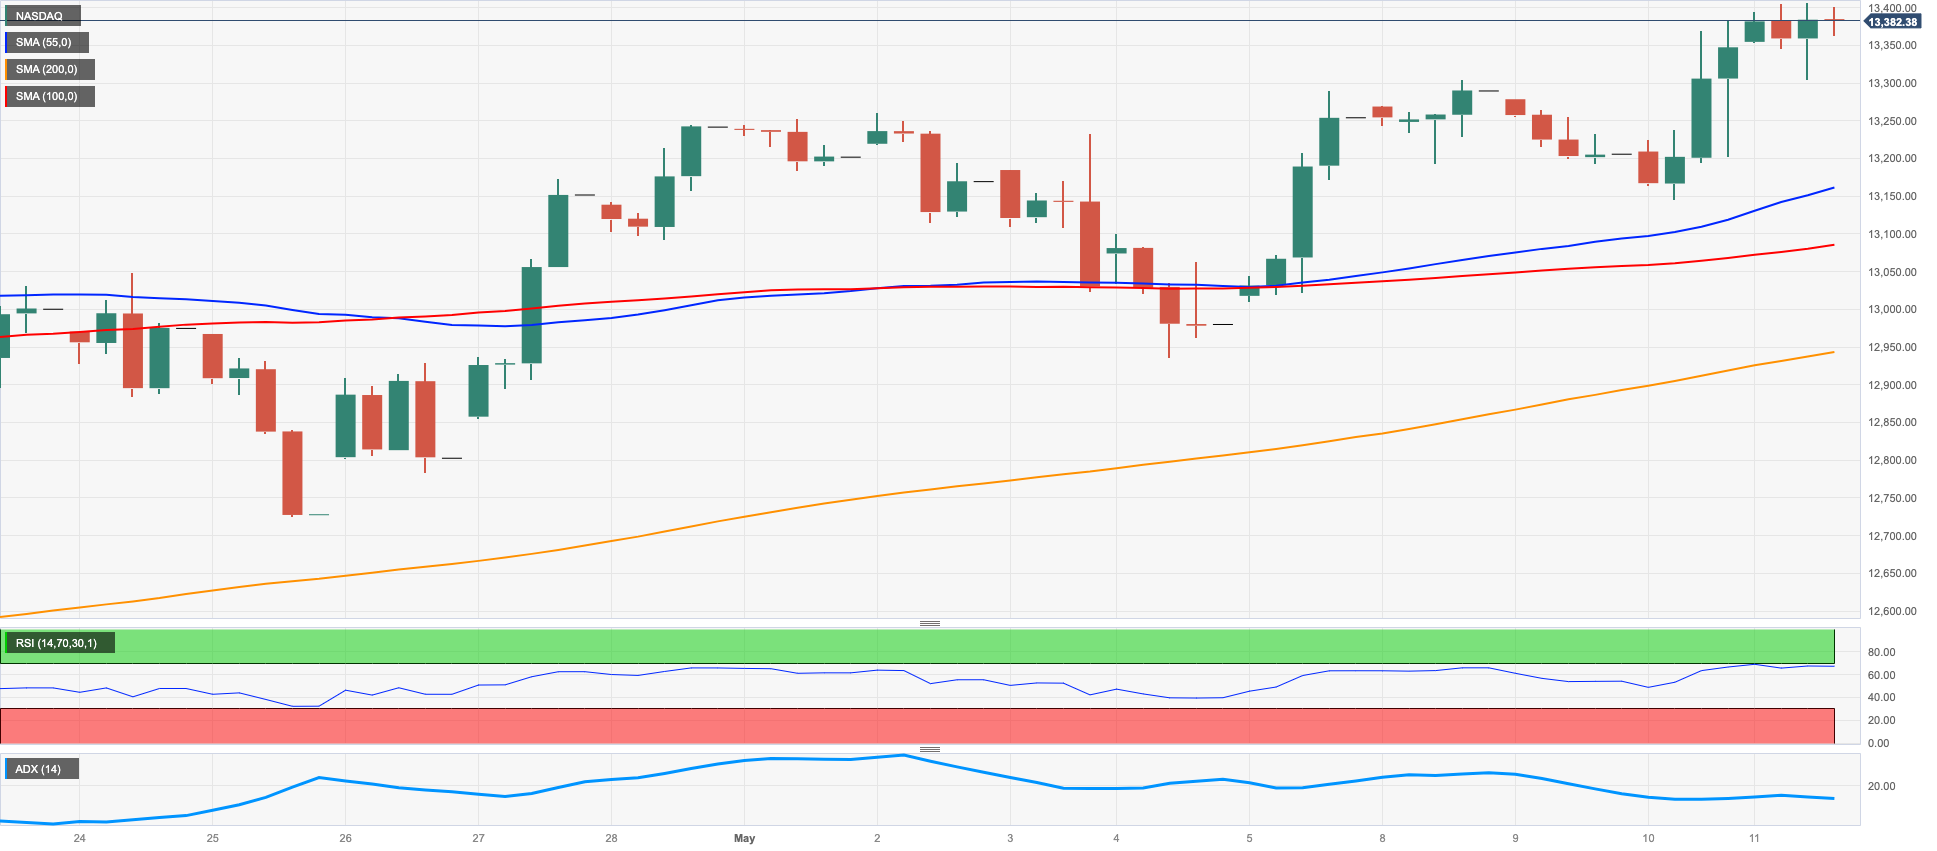
Tech equities gauged by the Nasdaq 100 reached a new 2023 peak around 13400 on Thursday.
Optimism in the tech sector remained on the rise on Thursday after cooling US Producer Prices and higher-than-expected weekly Jobless Claims reinforced the view of a pause at the Fed’s tightening plan, most likely at the June meeting.
Declining US yields, in the meantime, also bolstered the bullish session in the index.
On May 11, the Nasdaq 100 clocked a new high for 2023 of 13402. If the upward momentum continues, the next target could be the March 2022 top of 15265 (March 29). However, if there is a downward trend, the May low of 12938 (May 4) should be supported by the April low of 12724 (April 25), which is bolstered by the interim 55-day SMA at 12736. If these levels are broken, the 200-day SMA at 12099, the March low of 11695 (March 13), the weekly lows of 11550 and 11251 could be tested. Further weakness may challenge the 2023 low of 10696 (January 6). The day-to-day RSI trespassed to the 62 level.
Top Gainers: PDD Holdings DRC, JD.com Inc Adr, Alphabet A
Top Losers: Intel, Warner Bros Discovery Inc, Moderna
Resistance levels: 13402 13720 14277 (4H chart)
Support levels: 12938 12724 12517 (4H chart)
DOW JONES
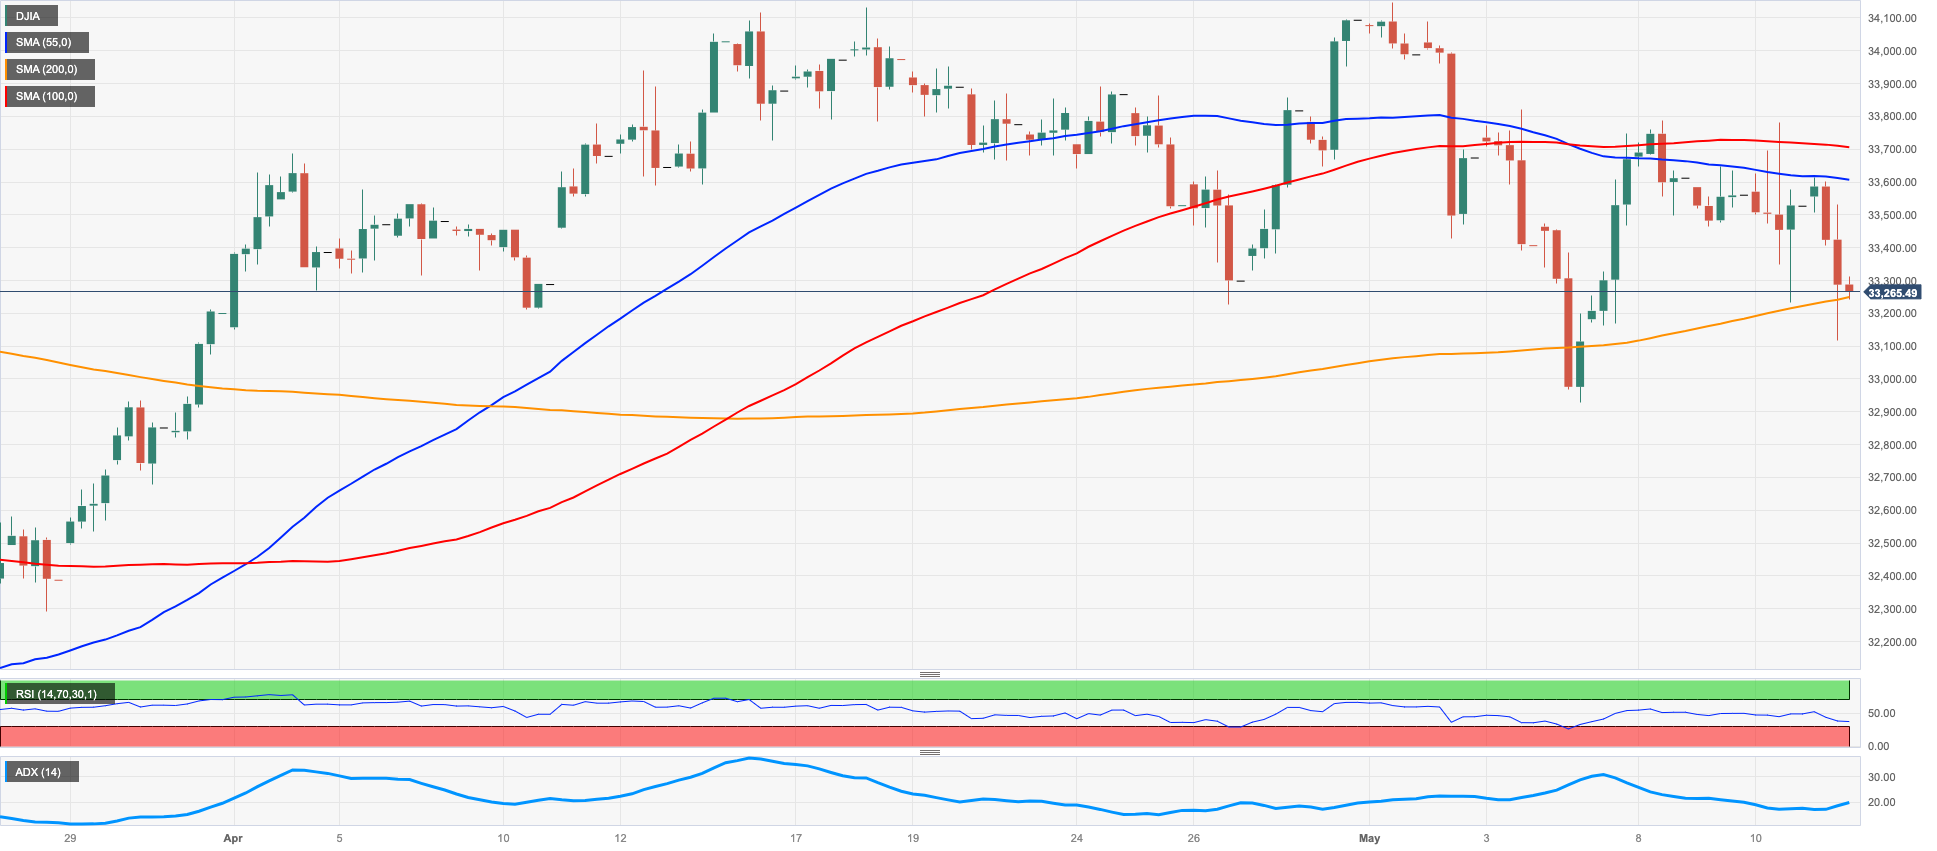
Stocks gauged by the Dow Jones extended the bearish performance for the fourth straight session on Thursday.
The negative sentiment among traders was intensified by several factors, including disappointing performance from streaming giant Walt Disney, concerns about the debt ceiling and unease in the banking sector. These issues compounded the already-existing risk aversion among traders, which was further exacerbated by a solid buying interest in the greenback.
All in all, the Dow Jones retreated 0.83% to 33254, the S&P500 dropped 0.32% to 4123 and the tech-benchmark Nasdaq Composite rose 0.08% to 12316.
A further decline in the Dow could find support at the May low at 32937 (May 4), followed by the important 200-day SMA at 32748. If there is further downside, the 2023 low at 31429 (March 15) could provide additional support before reaching the 2022 low at 28660 (October 13). However, the index is expected to face resistance if the bulls regain the initiative. The key hurdle will be the May high at 34257 (May 1), followed by the 2023 top at 34,342 (January 13) and the December 2022 peak at 34712 (December 13). A surpass of the latter point could encourage the index towards the April 2022 high at 35492 (April 21). The daily RSI grinded lower to the sub-46 region.
Top Performers: Boeing, Walmart, Coca-Cola
Worst Performers: Walt Disney, Intel, Dow
Resistance levels: 33772 34257 34334 (4H chart)
Support levels: 33127 32937 31805 (4H chart)
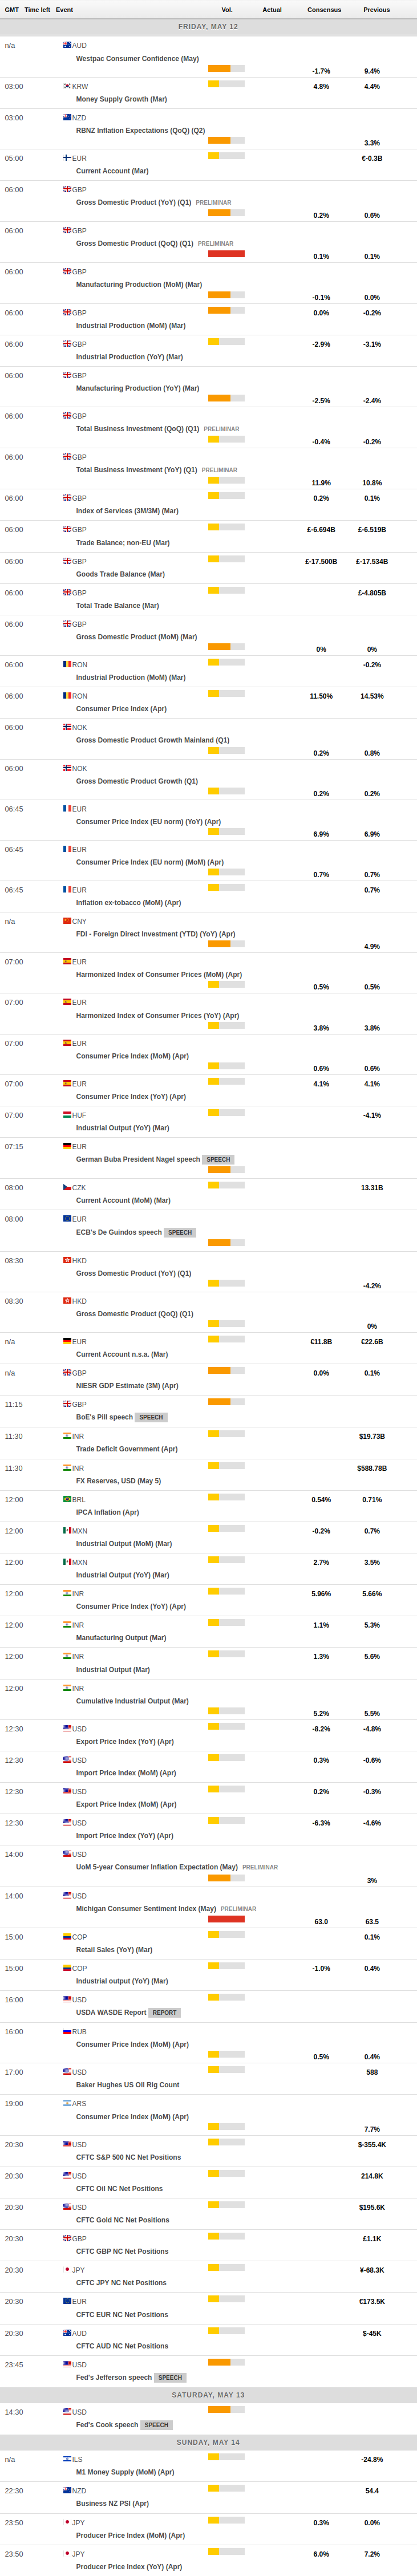
MACROECONOMIC EVENTS
All Information & Updates provided by:

All information relating to the financial markets available on this page has been prepared and issued by FXStreet (Forexstreet SL, Spain, Reg: B62498233) on the basis of publicly available information and all information believed to be reliable and does not conflict with Kuwaiti local laws, and all necessary care has been taken to before the company to ensure that the facts mentioned are correct from the source.
NCM Investment nor any of its directors or employees shall in any way be held responsible for the contents of this news, and the information contained on this page is intended only to provide clients with publicly available information and should not be construed as investment advice, report or analysis and/or constitute an offer or invitation to buy or sell financial instruments of any kind.
RISK WARNING: Forex and CFDs are highly risky leveraged products, as losses can exceed deposits. Please ensure you understand all the risks and take independent advice if necessary. NCM will segregate the clients based on the criteria of the regulator and its bylaws. NCM does not provide any advisory service; the material published does not constitute advice or a recommendation for a transaction in any financial instrument. NCM accepts no responsibility for any use of the content presented and any consequences of that use. Anyone acting on the information provided does so at their own risk.