
- Contact Us:
-

-

-

-


Daily Market Updates
15 May 2023
USDJPY
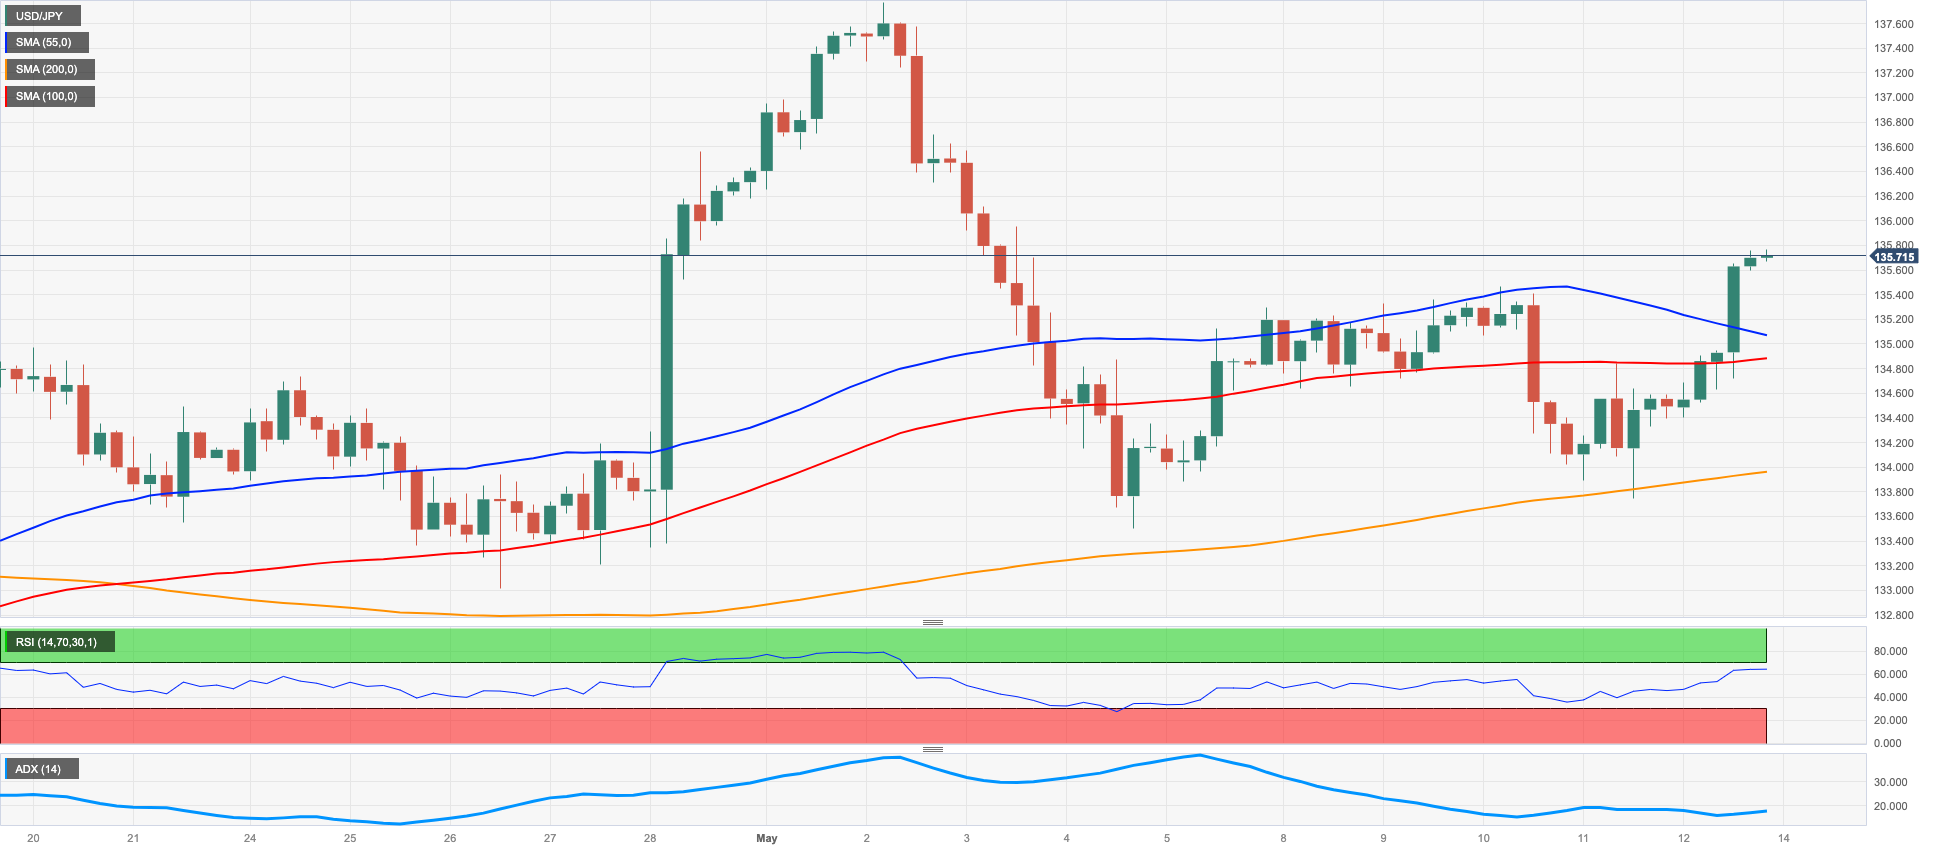
USD/JPY kept the optimism well and sound in the second half of the week and ended Friday’s session well north of 135.00 the figure, or new multi-day highs.
The positive weekly performance was enough to leave behind previous losses and resume the uptrend with the immediate target at the YTD peak at 137.91 (March 8).
Extra upside in the pair came on the back of the acute rebound in the greenback, which largely surpassed the 102.00 barrier when measured by the USD Index (DXY), while the marked rebound in US yields across the curve also collaborated with the upside bias.
The Japanese docket was empty on Friday.
Before the May high of 137.77 (May 2) and the 2023 peak of 137.91 (March 8), the USD/JPY recovery faces an initial resistance level at the weekly high of 135.74 (May 12). This level is followed by the crucial 200-day SMA at 137.01. There is a possibility that the weekly highs of 139.89 on November 30, 2022, and 142.25 on November 21, 2022, could be retested if further gains are made. However, if the losses continue, spot is expected to test the weekly low of 133.01 on April 26. The interim 100-day SMA at 132.89 appears to provide further support for this support area. A minor contention level of 132.01 (April 13) appears prior to the April 5 low of 130.62, the March 24 low of 129.63, and the February 8 low of 128.08. The next downside target would be the lowest point in 2023, which would be 127.21 (January 16). The everyday RSI leapt above the 57 mark.
Resistance levels: 135.75 137.77 137.91 (4H chart)
Support levels: 133.74 133.49 133.01 (4H chart)
GBPUSD
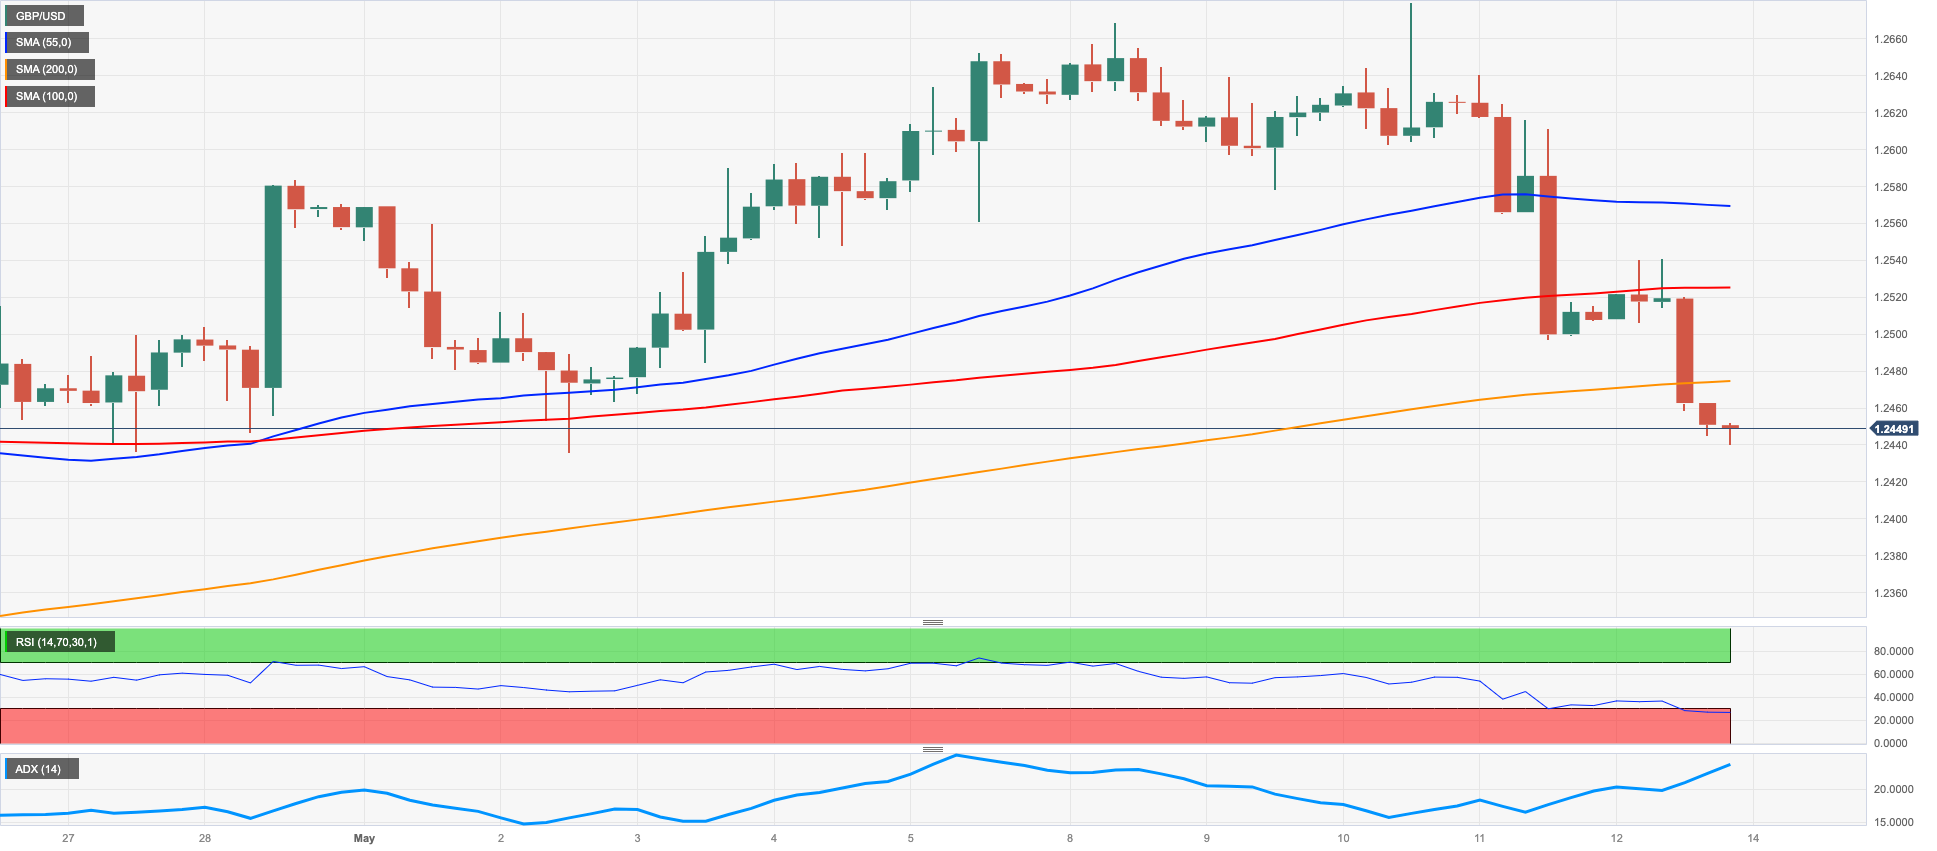
The intense march north in the greenback put the risk-associated universe under heightened pressure and forced GBP/USD to add to Thursday’s decline and revisit the mid-1.2400s, near monthly lows.
That said, Cable extended the rejection from 2023 tops around 1.2680 (May 10), an area coincident with a key resistance line off the top recorded on June 1 2021 at 1.4250.
Looking at the weekly chart, the pair halted an impressive 8-week positive streak after advanced nearly 9 cents since Mach lows in the 1.1800 neighbourhood.
From the BoE, Chief Economist H. Pill reiterated inflation remains undesirably high, although he expected a pronounced decline of consumer prices at the time when suggested that there is more work to do to bring inflation down.
Busy session in the UK docket: the GDP 3-Month Avg expanded 0.1% in March, the GDP expanded 0.3% YoY and flash GDP Growth Rate is seen increasing 0.2% YoY and 0.1% QoQ in Q1. In addition, the GDP contracted 0.3% MoM in March, the Goods Trade Balance deficit eased a tad to £16.356B, Construction Output expanded 4.1% in the year to March, Industrial Production contracted 2.0% YoY and Manufacturing Production 1.3% YoY, both prints for the month of March. Finally, the NIESR Monthly GDP Tracker rose 0.1% in April.
Should the downside in GBP/USD gain momentum, it is expected to face immediate support at the May low of 1.2435 (May 2) followed by the weekly low of 1.2344 (April 10). If these levels are breached, it could lead to a test of the temporary 55-day SMA at 1.2315, followed by the April low at 1.2274 (April 3). A further decline may potentially bring the pair to the significant 200-day SMA at 1.1958, prior to the 2023 low of 1.1802 (March 8). On the upside, the next level for Cable is currently targeted at the 2023 high of 1.2668 (May 8), with buyers also focused on the 200-week SMA of 1.2865 ahead of the psychological level of 1.3000. The daily RSI fell to the vicinity of the 48 yardstick.
Resistance levels: 1.2540 1.2567 1.2679 (4H chart)
Support levels: 1.2444 1.2386 1.2367 (4H chart)
AUDUSD
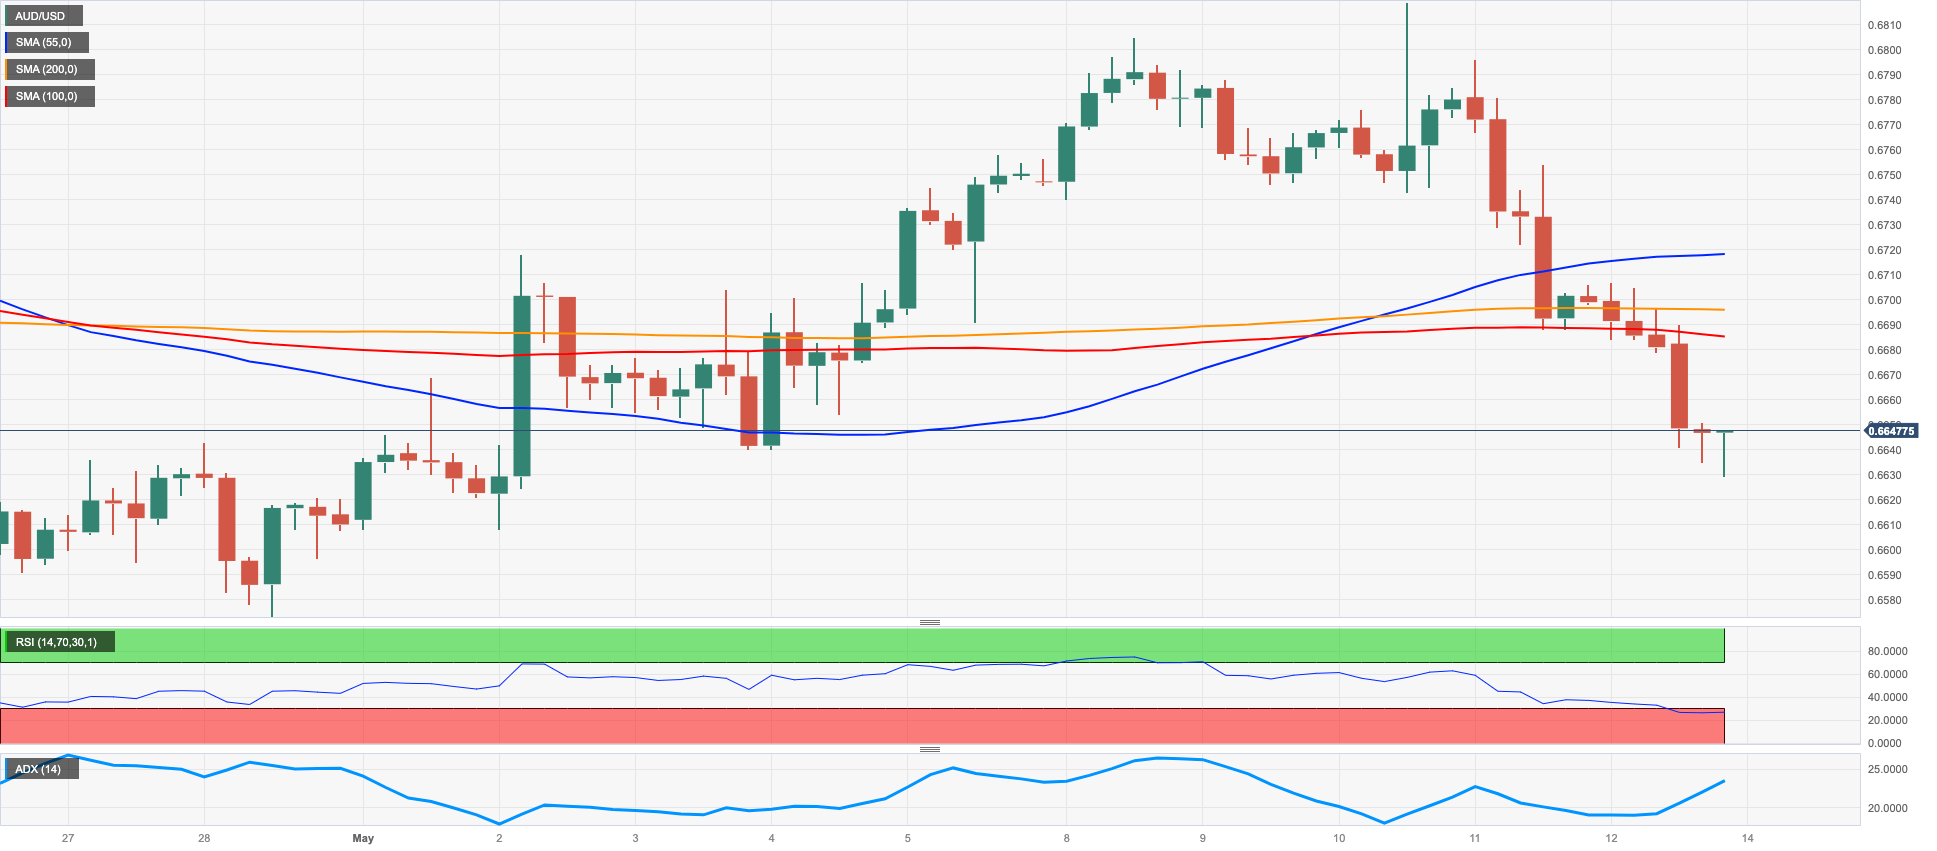
AUD/USD accelerated the downside and decisively broke below the 0.6700 level to record multi-session lows in the 0.6640/35 band at the end of the week.
Like the other risk-linked assets, the Aussie dollar succumbed to the sharp rise in the greenback, prompting sellers to pull the pair further south from the May highs above 0.6800 (10 May).
The mixed note in the commodity complex saw a modest recovery in copper prices and iron ore, although this bounce did not lend support to the high-beta currency on Friday.
Down Under, no data releases were scheduled at the end of the week.
The weekly low of 0.6636 (May 12) is proving to be the immediate contention area for AUD/USD. Further weakening could lead to a decline towards the April low of 0.6573 (April 28), ahead of the 2023 low at 0.6563 (March 10) and ahead of the weekly low of 0.6386 (November 10 2022) and the November 2022 low at 0.6272. (November 3). On the flip side, the next upside barrier to watch out for is the May high of 0.6818 (May 10). Above this level, the critical round mark of 0.7000 could be a realistic target, followed by the weekly high at 0.7029 (February 14) and the 2023 high at 0.7157 (February 2).The daily RSI sank below 44.
Resistance levels: 0.6696 0.6818 0.6920 (4H chart)
Support levels: 0.6636 0.6620 0.6573 (4H chart)
GOLD
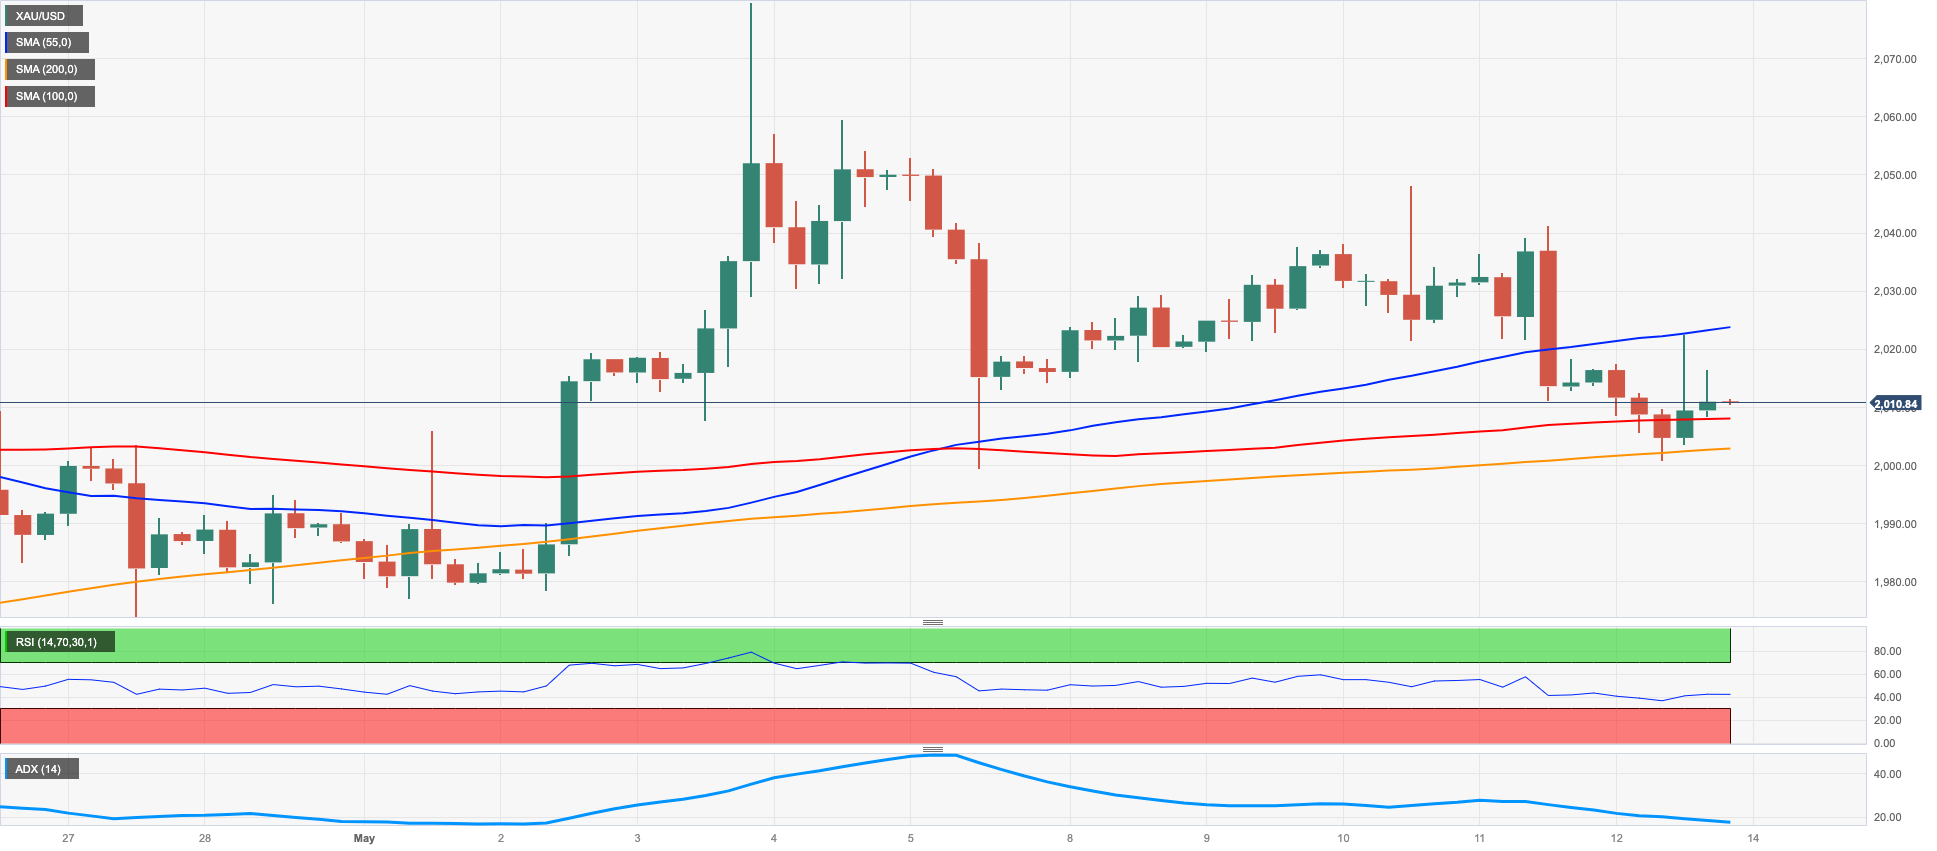
Prices of the yellow metal dropped for the third session in a row on Friday, although they managed well to stay above the critical $2000 mark per ounce troy.
On a weekly basis, bullion charted small losses and reversed two advances in a row. The gradual weekly uptrend in place since March, however, appears so far unaltered.
The unabated recovery in the greenback aided by the strong rebound in US yields across the curve was too much for the precious metal, which kept the bearish tone unchanged in the last sessions.
In the meantime, gold should continue to track expectations of further tightening or a potential impasse in the Fed’s normalization process, particularly after inflation was found to be somewhat stickier than anticipated.
The $2000 region emerges as a psychological barrier for gold bears for the time being. The loss of this zone unveils a minor support level at $1999 (May 5), before reaching the weekly low of $1969 (April 19). Further down, we have the April low of $1949 (April 3), which gains reinforcement from the nearby 55-day SMA. This is then succeeded by the provisional 100-day SMA at $1919. If the downward momentum persists, the metal could potentially drop to the March low of $1809 (March 8), and there's even a chance of reaching the lowest point of 2023 at $1804 (February 28). On the upside, the primary obstacle will be encountered at the highest point reached in 2023 at $2067 (May 4). This will be followed by the 2022 peak of $2070 (March 8), and the all-time top of $2075 (August 7, 2020).
Resistance levels: $2022 $2048 $2067 (4H chart)
Support levels: $2000 $1969 $1949 (4H chart)
CRUDE WTI
Omnipresent recession concerns bolstered by rising uncertainty surrounding the debt ceiling issue and lingering speculation that the Fed’s stance might remain tighter-for-longer all hurt the sentiment around the commodity and the rest of the risk complex on Friday.
In addition, the intense march north in the US dollar and recent poor results from the Chinese docket, which poured cold water over the perception of a strong recovery in China, collaborated further with the downward bias in prices of the crude oil.
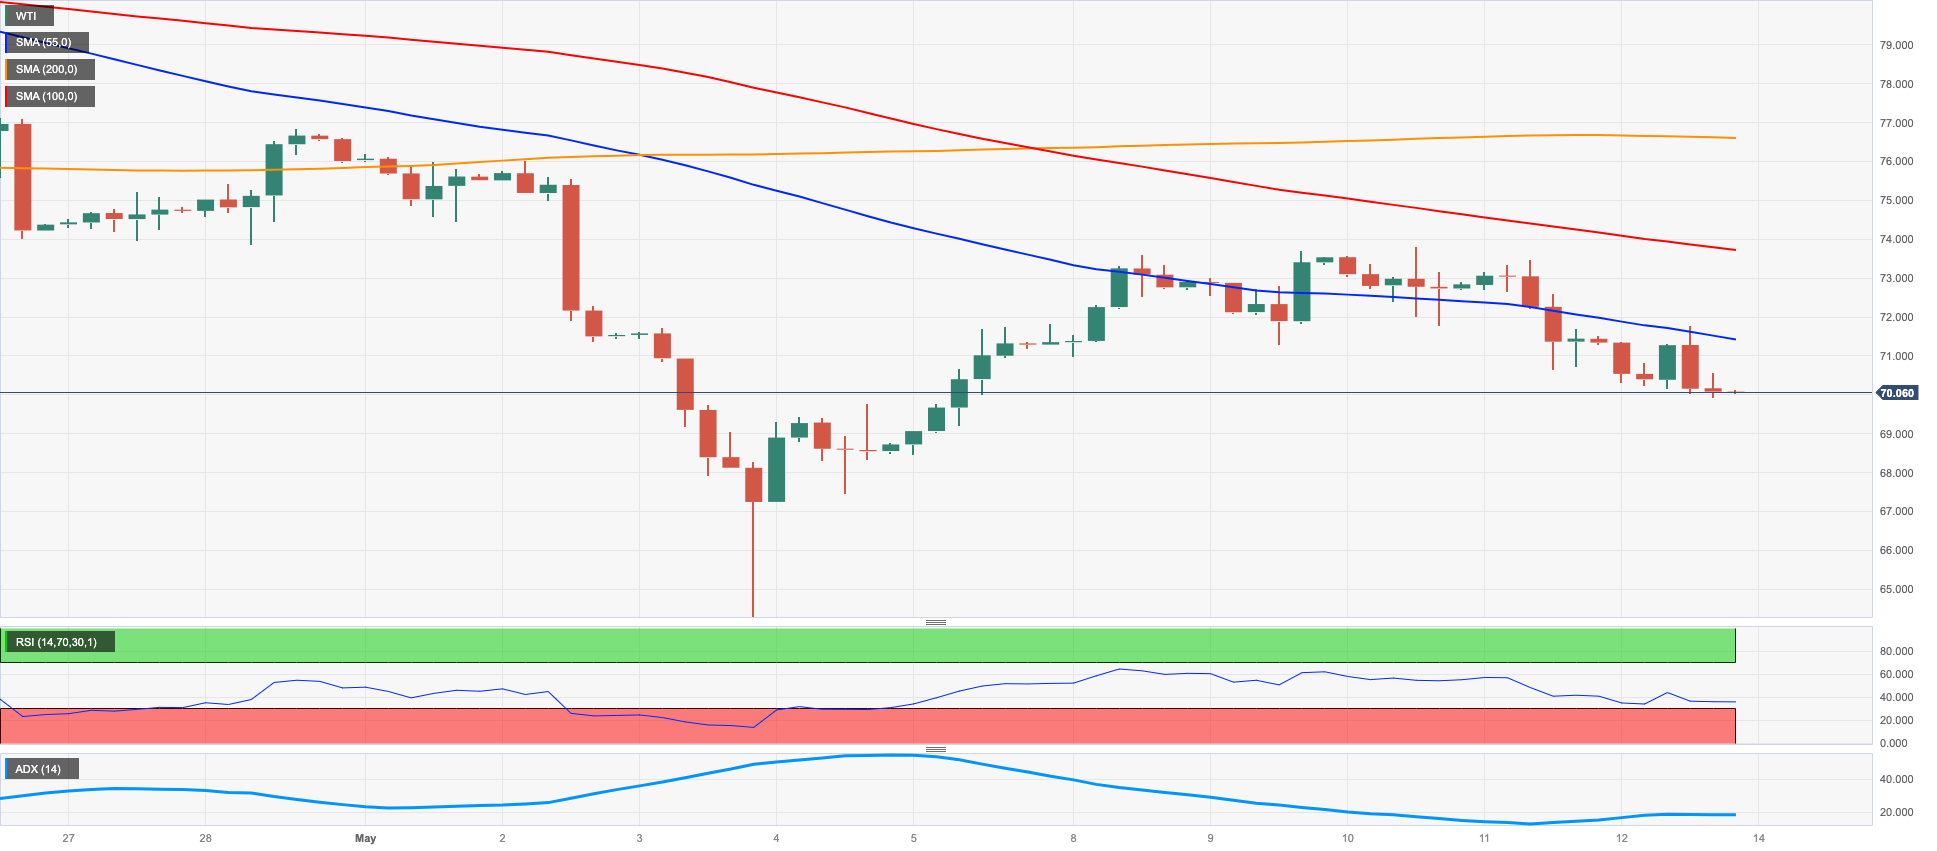
Against that, prices of the WTI retreated for the third session in a row and closed the week around the key $70.00 mark per barrel, extending the negative streak for the fourth straight week.
In the calendar, driller Baker Hughes reported a drop of 2 oil rigs in the week ended on May 12, bringing the US total active oil rigs to 586.
Despite some recent progress, crude oil prices have fallen steadily in recent sessions. WTI, for example, hit a new 2023 low of $63.73 per barrel on 4 May. Oil prices could fall further to the crucial $60 level if the December 2021 low of $62.46 (2 December) is breached. Inconsistent upside, contrary to the norm, is likely to face a first obstacle at the weekly high of $79.14 (April 24), ahead of the key $80.00 level and the fundamental 200-day line SMA at $80.79. The 2023 high of $83.49 (April 12) follows ahead of the November 2022 high of $93.73 (November 7).
Resistance levels: $73.83 $76.88 $79.14 (4H chart)
Support levels: $69.99 $63.61 $62.42 (4H chart)
GER40
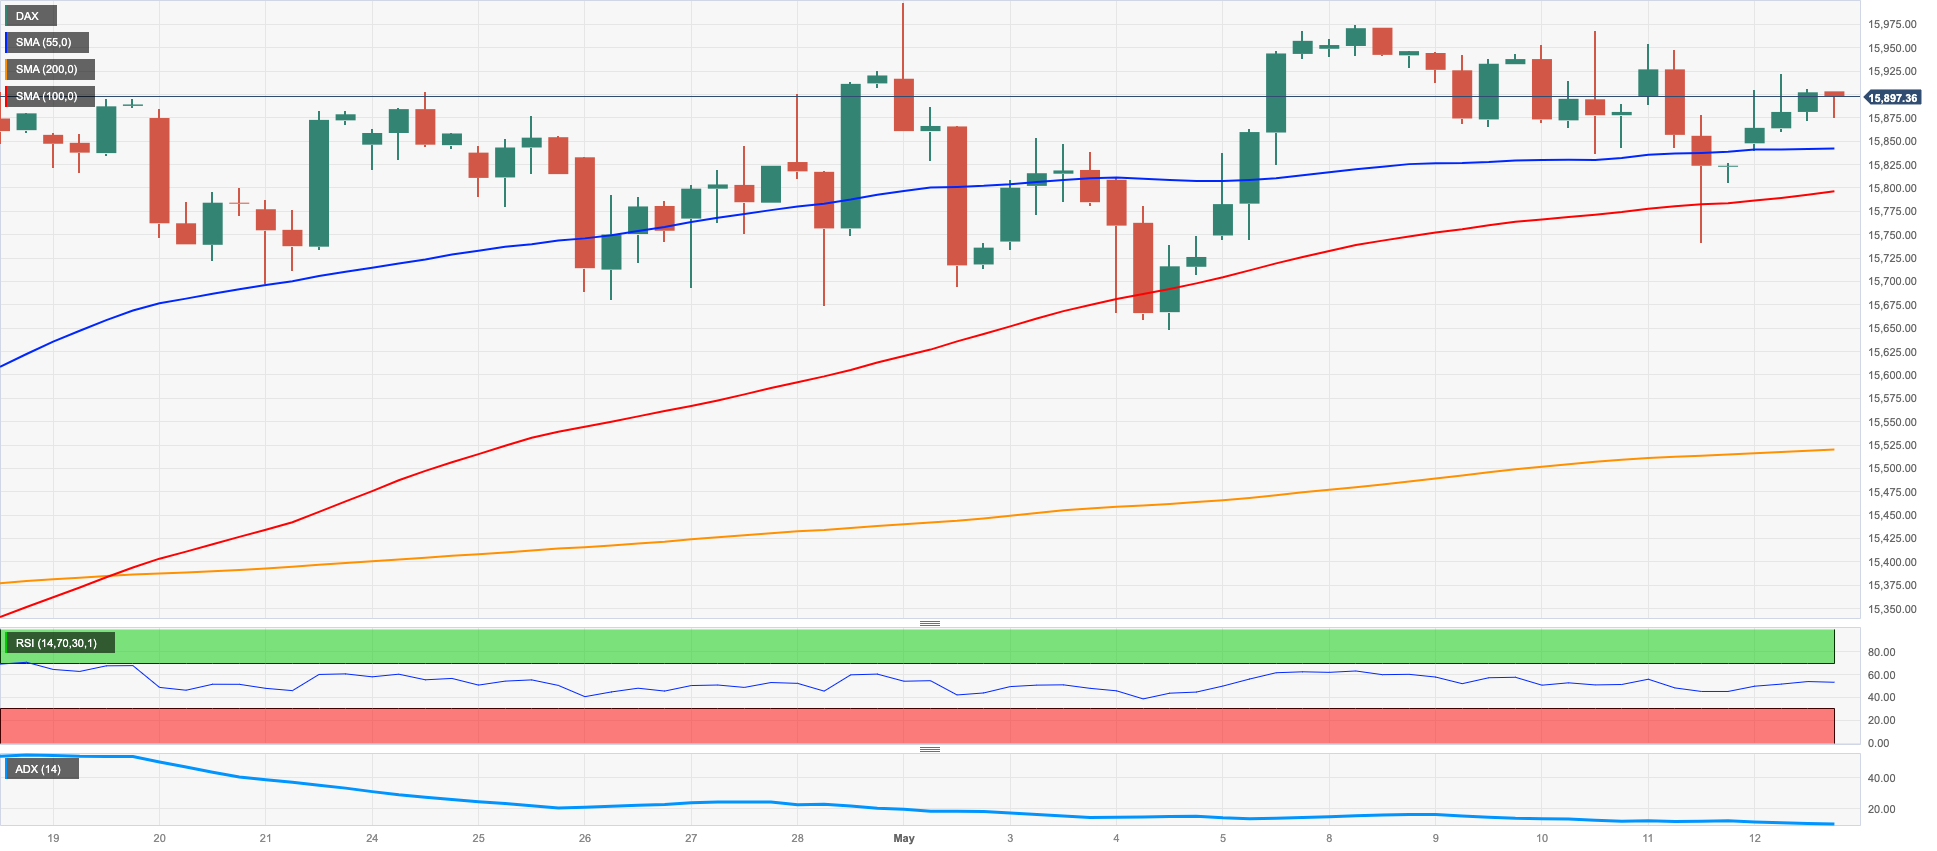
Germany’s stock benchmark DAX40 ended the week marginally on the positive side, in line with most of its European peers, revisiting the 15900 zone after two consecutive daily retracements.
The daily uptick came in tandem with auspicious results from corporate earnings reports, while mixed GDP prints in the UK economy somewhat collaborated with the upbeat mood among market participants.
Data wise in Germany, the Current Account surplus widened to €32.4B in March, while final inflation figures in Spain and France confirmed that consumer prices in the Euroland remain sticky and might need further work by the ECB in the upcoming months (as has been widely suggested by most of the bank’s Board members).
In the meantime, growth prospects in China following the post-pandemic reopening, the likelihood of a US recession and the debt ceiling debate are expected to dictate the price action in the global markets in the next periods.
If the DAX40 surpasses the YTD high of 16011 (May 2), it could challenge the 2020 top at 16285 (January 5). On the other hand, the May low of 15662 (May 4) could serve as a short-term contention area ahead of the 55-day SMA of 15533 and the April low of 15482 (April 5). In the event that the index continues to decline, the next potential support zone emerges at the 100-day SMA of 15250. A deeper retracement could see minor support levels such as 14809 (March 24) and 14458 (March 20) as well as the significant 200-day SMA of 14308 come into play. The daily RSI bounced past the 57 hurdle.
Best Performers: Siemens Energy AG, Rheinmetall AG, Continental AG
Worst Performers: BMW ST, Heidelbergcement, Vonovia
Resistance levels: 16011 16090 16285 (4H chart)
Support levels: 15754 15662 15482 (4H chart)
NASDAQ
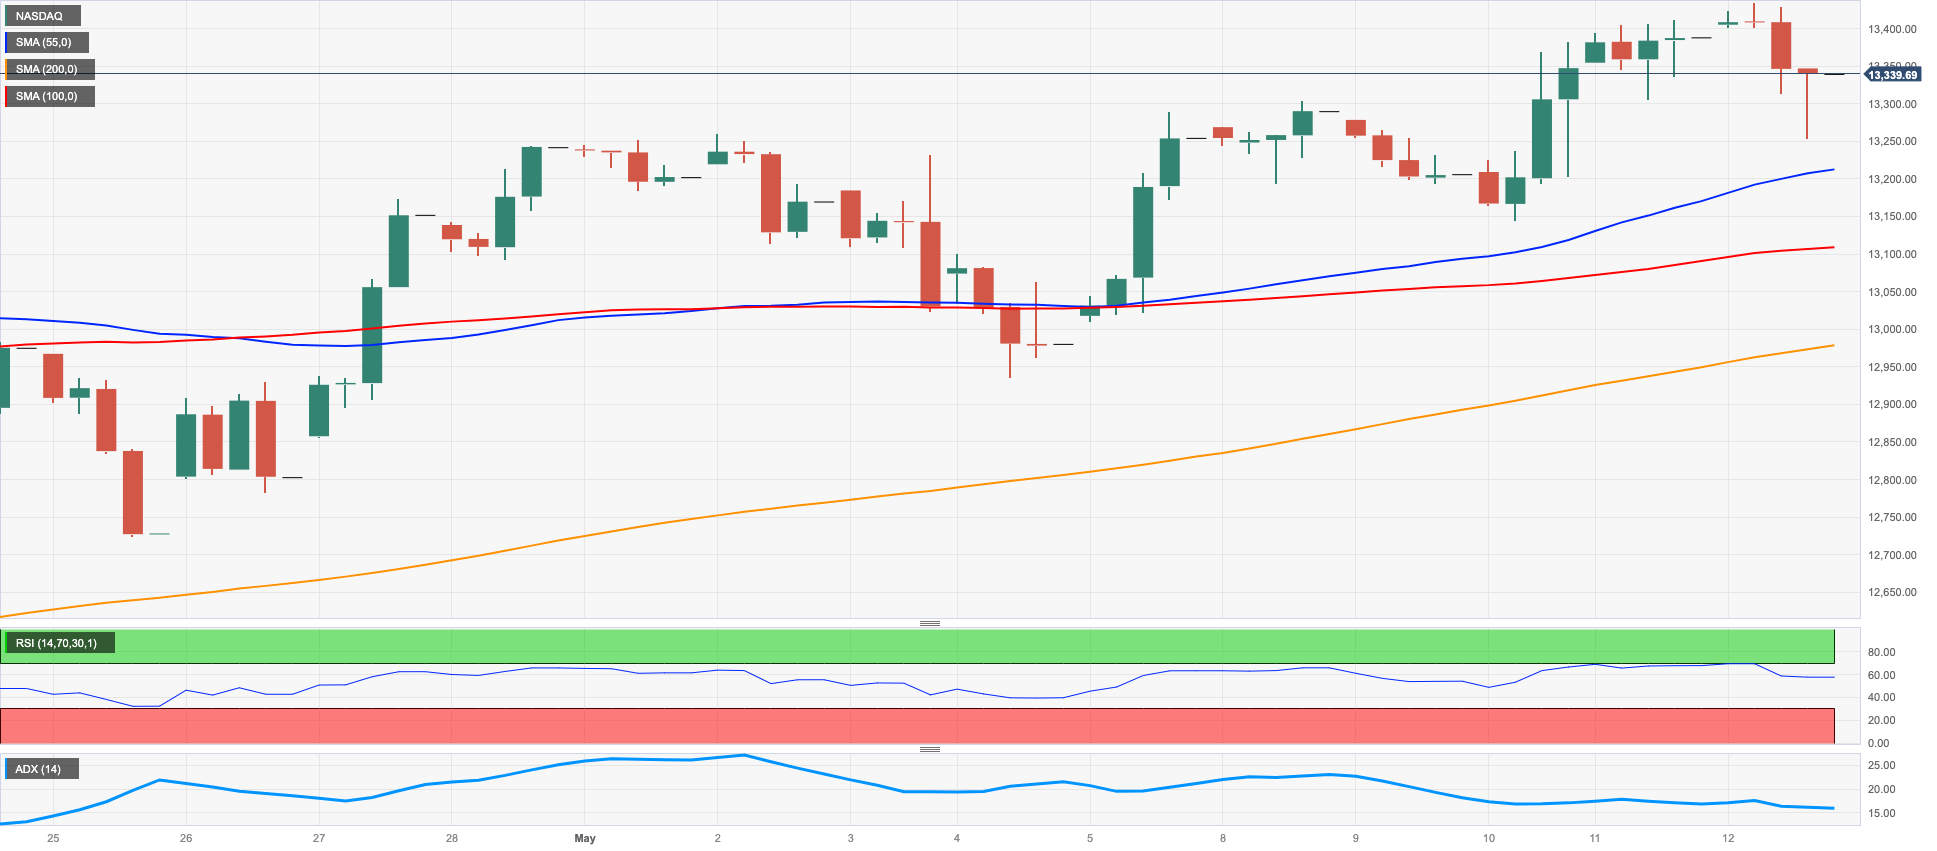
In line with the rest of its US peers, the tech reference index Nasdaq 100 ended the week in negative territory, leaving behind two daily advances in a row.
The corrective move in the index came soon after hitting new highs for the current year past the 13400 mark, although it did not prevent the tech equities from closing the third consecutive week with gains.
Higher US yields, pessimism around the debt ceiling discussions and the lingering spectre of a potential economic slowdown all weighed on the index and favoured the resurgence of some selling pressure.
On May 12, the Nasdaq 100 set a new 2023 high of 13427. If the rising trend continues, the March 2022 top of 15265 might be the next target (March 29). If the trend is negative, the May low of 12938 (May 4) should be supported by the April low of 12724 (April 25), which is reinforced at the same time by the proximity of the interim 55-day SMA (12757). If these levels are breached, the 200-day SMA at 12103, the March low of 11695 (March 13), as well as the weekly lows of 11550 and 11251 might be challenged. Further decline might put the 2023 low of 10696 in jeopardy (January 6). The daily RSI corrected lower and approached the 60 threshold.
Top Gainers: Enphase, Workday, Dollar Tree
Top Losers: Rivian Automotive, JD.com Inc Adr, Airbnb
Resistance levels: 13427 13720 14277 (4H chart)
Support levels: 12938 12724 12517 (4H chart)
DOW JONES
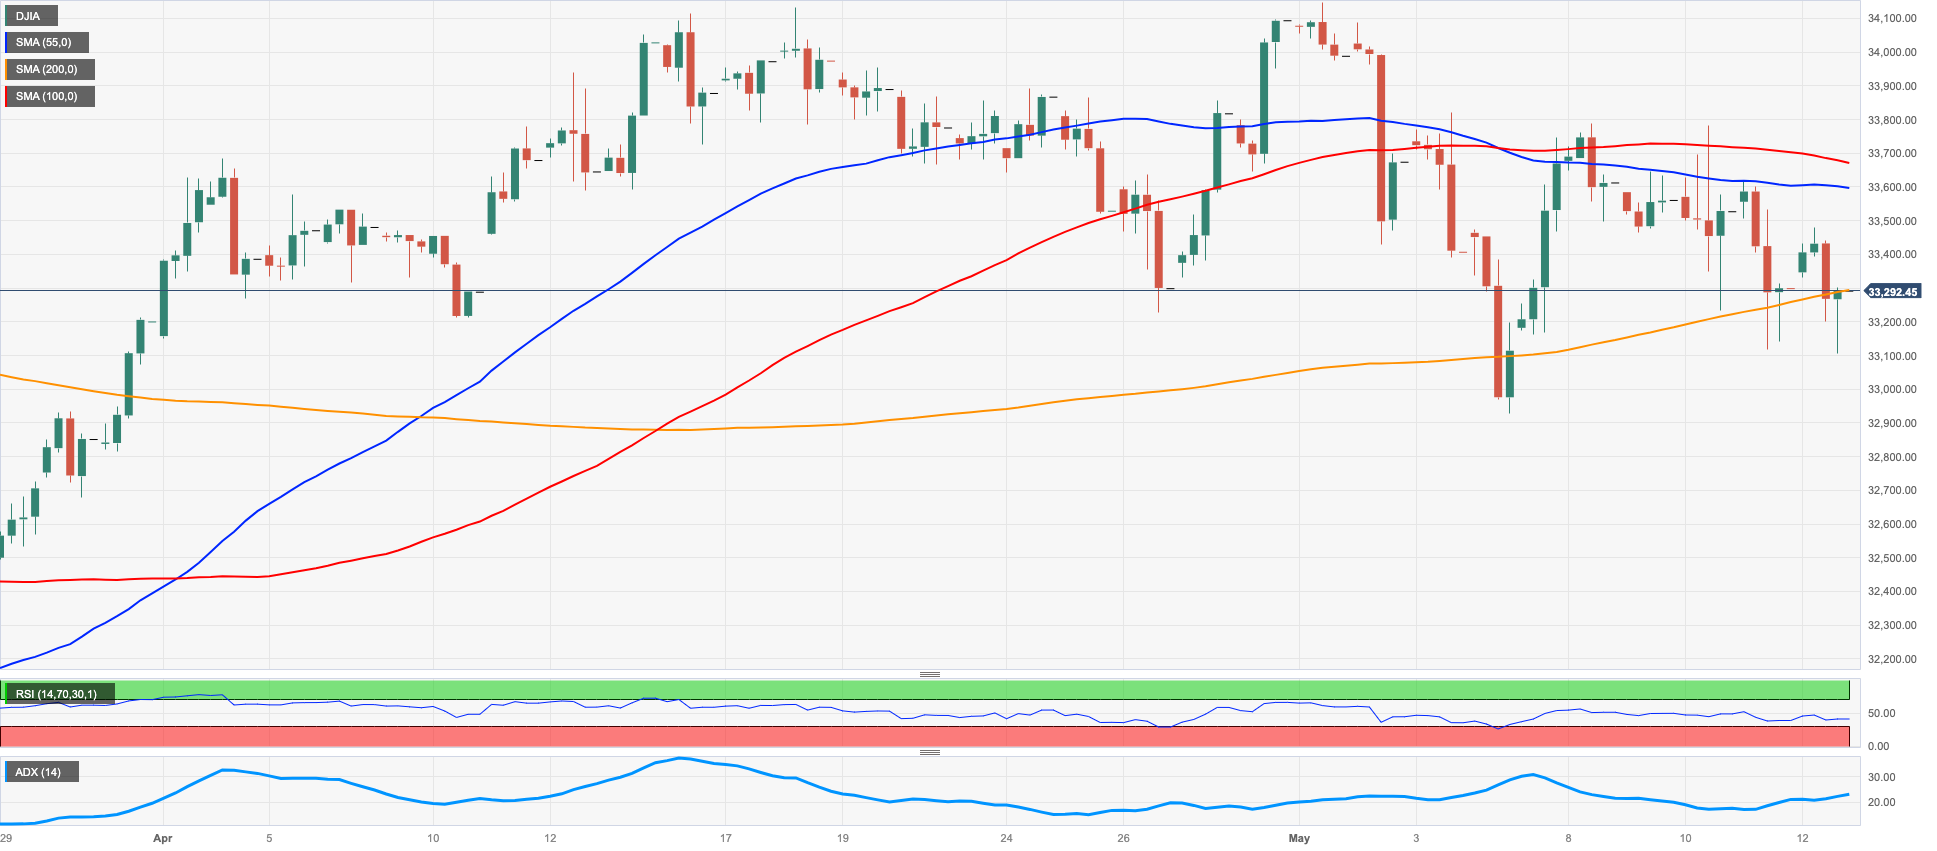
Equities measured by the US benchmark Dow Jones closed every day with losses in the last week, ending Friday’s session around the 33100 region, where the temporary 55-day SMA also converges.
Increasing jitters around the still unsolved debt ceiling in combination with the investors’ perception that the Federal Reserve might remain in the restrictive territory for longer than estimated and the multi-month drop in consumers’ sentiment (as per the Michigan gauge) all weighed on stocks along with the stronger dollar and higher yields.
Overall, the Dow Jones dropped 0.03% to 33300, the S&P500 retreated 0.16% to 4124 and the tech-heavy Nasdaq Composite deflated 0.35% to 12284.
If the Dow continues to decline, it may find support at the May low of 32937 (May 4), followed by the important 200-day SMA at 32754. In the event of further downside, the 2023 low at 31429 (March 15) could provide additional support before reaching the 2022 low at 28660 (October 13). Contrarily, the index is expected to encounter initial resistance at the May top at 34257 (May 1), before the 2023 high at 34,342 (January 13) and the December 2022 peak at 34712 (December 13). If the index surpasses the latter point, it could generate momentum towards the April 2022 high at 35492 (April 21). The daily RSI receded to the 46 zone.
Top Performers: IMB, Procter&Gamble, Home Depot
Worst Performers: Nike, JPMorgan, Salesforce Inc
Resistance levels: 33772 34257 34334 (4H chart)
Support levels: 33110 32937 31805 (4H chart)
MACROECONOMIC EVENTS

All Information & Updates provided by:

All information relating to the financial markets available on this page has been prepared and issued by FXStreet (Forexstreet SL, Spain, Reg: B62498233) on the basis of publicly available information and all information believed to be reliable and does not conflict with Kuwaiti local laws, and all necessary care has been taken to before the company to ensure that the facts mentioned are correct from the source.
NCM Investment nor any of its directors or employees shall in any way be held responsible for the contents of this news, and the information contained on this page is intended only to provide clients with publicly available information and should not be construed as investment advice, report or analysis and/or constitute an offer or invitation to buy or sell financial instruments of any kind.
RISK WARNING: Forex and CFDs are highly risky leveraged products, as losses can exceed deposits. Please ensure you understand all the risks and take independent advice if necessary. NCM will segregate the clients based on the criteria of the regulator and its bylaws. NCM does not provide any advisory service; the material published does not constitute advice or a recommendation for a transaction in any financial instrument. NCM accepts no responsibility for any use of the content presented and any consequences of that use. Anyone acting on the information provided does so at their own risk.