
- Contact Us:
-

-

-

-


Daily Market Updates
16 May 2023
USDJPY
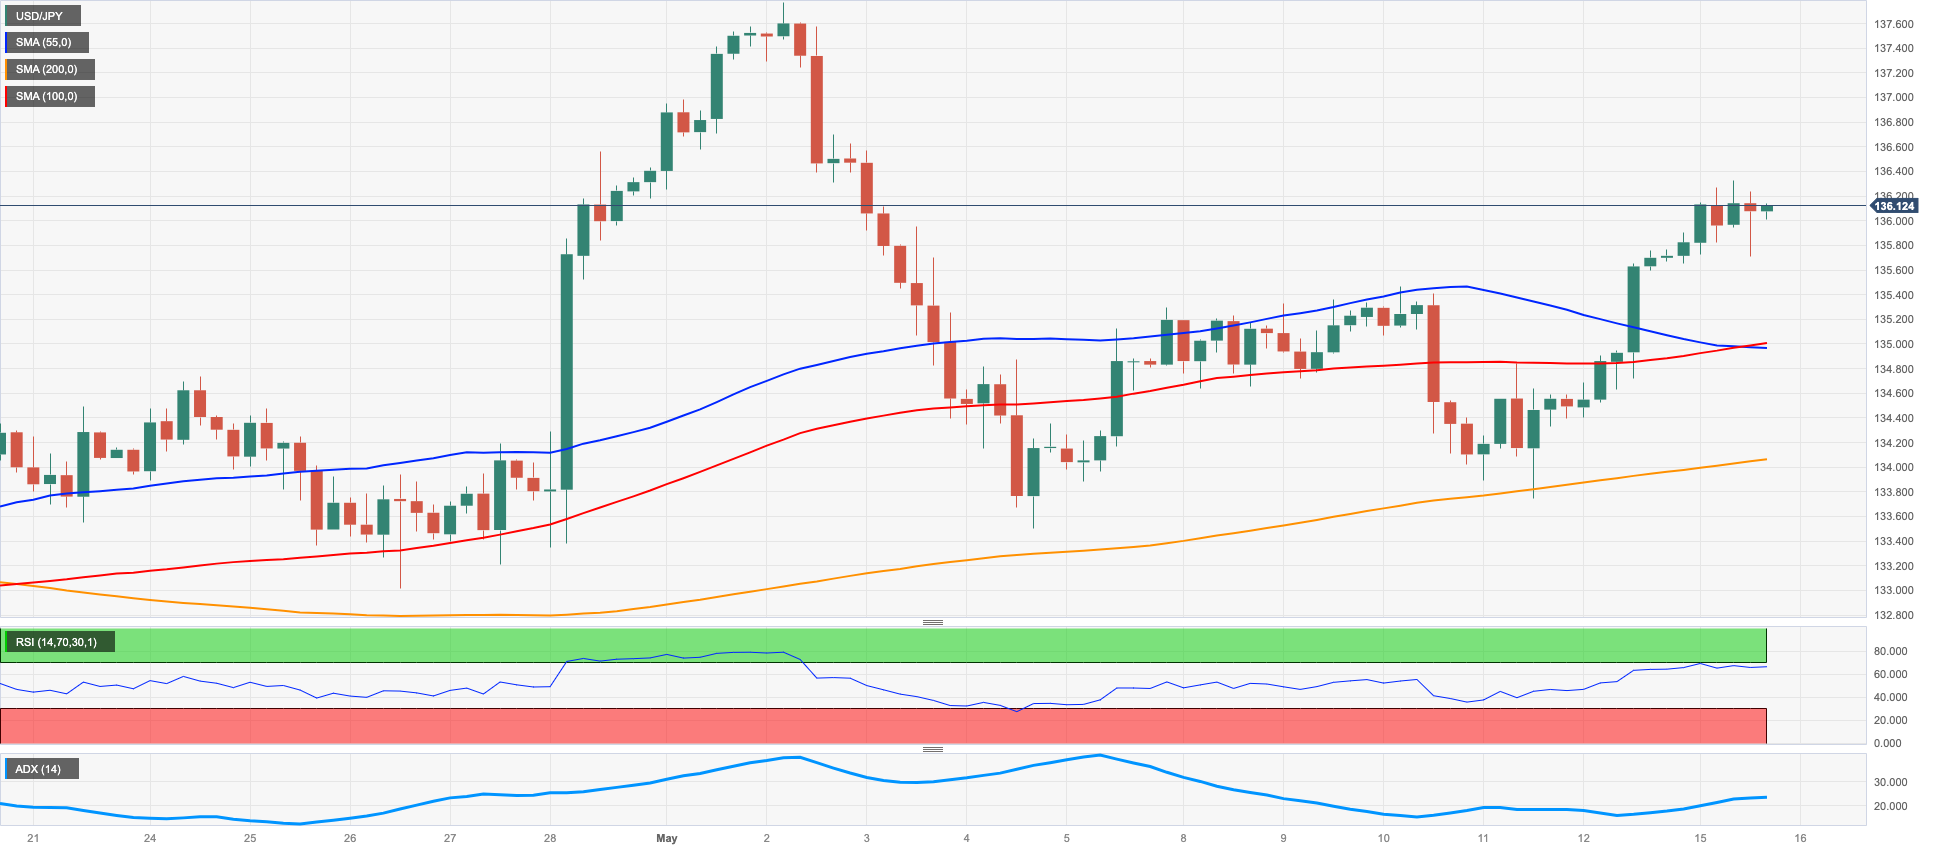
The resumption of the appetite for the risk-linked galaxy put the Japanese yen under further pressure and sponsored the third consecutive daily uptick in USD/JPY, this time advancing north of the 136.00 hurdle at the beginning of the week.
The pair, in the meantime, derived extra upside pressure from another positive session in US yields, particularly in the belly and the long end of the curve vs. a marginal move in the short end.
In Japan, further consolidation saw the JGB 10-year yields navigate around the 0.40% region.
In Japan, Producer Prices rose at a monthly 0.2% in April and 5.8% from a year earlier. In addition, Machine Tools Orders contracted at an annualized 12.7% in April.
The USD/JPY recovery faces an initial resistance level at the key 200-day SMA at 137.02 prior to the May high of 137.77 (May 2) and the 2023 peak of 137.91 (March 8). If further gains are made, it is possible that the weekly highs of 139.89 (November 30, 2022) and 142.25 (November 21, 2022) could be retested. Just the opposite, spot is anticipated to test the weekly low of 133.01 on April 26 if bears regain the upper hand. The break 100-day SMA at 132.92 seems to offer further help for this contention zone. Prior to the April 5 low of 130.62, the March 24 low of 129.63, and the February 8 low of 128.08, a minor contention level of 132.01 appears. The lowest point in 2023, which would be 127.21 (January 16), would be the next downside target. The daily RSI rose to the vicinity of 59.
Resistance levels: 136.32 137.77 137.91 (4H chart)
Support levels: 133.99 133.74 133.49 (4H chart)
GBPUSD
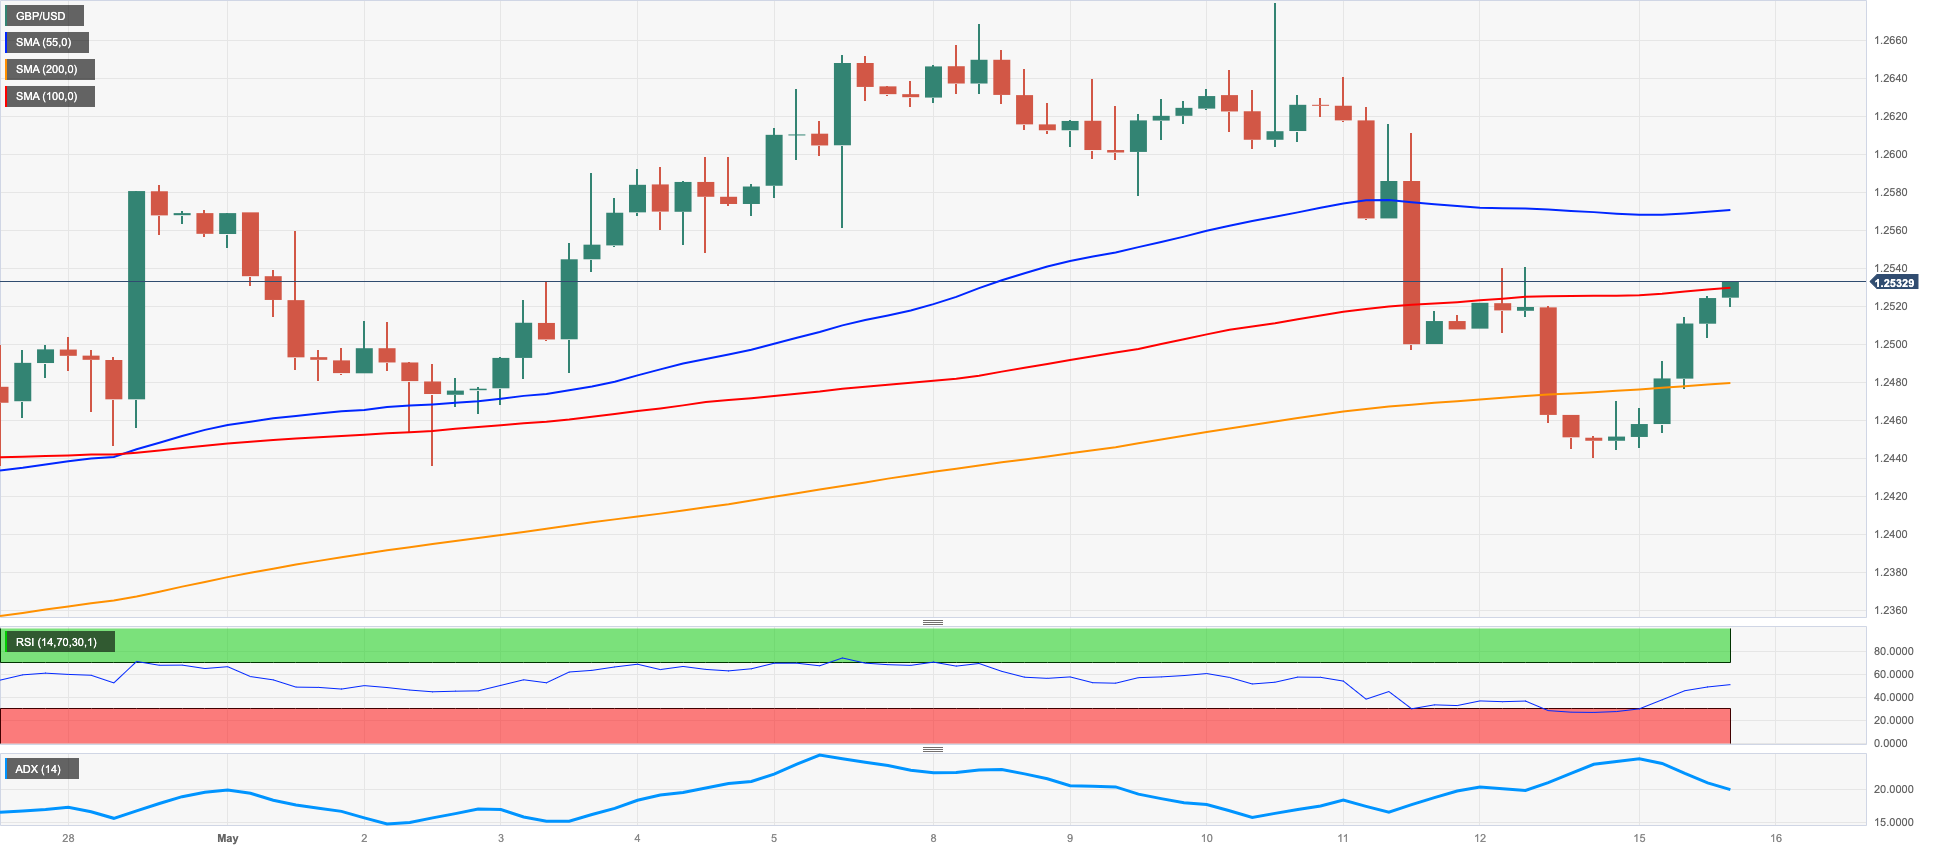
In line with the broad-based recovery in the risk-associated universe, GBP/USD left behind two sessions in a row with losses and reclaimed the area beyond the 1.2500 barrier at the beginning of the week.
Indeed, the combination of some profit taking in the greenback with a better tone among the risky assets propped up the marked advance in Cable on Monday after meeting quite decent support near 1.2440.
In the UK money market, the 10-year Gilt yields advanced marginally past the 3.80% level, in line with their G10 peers.
There were no data releases across the Channel on Monday.
On the upside, GBP/USD is currently targeted at the 2023 high of 1.2668 (May 8), with buyers also focused on the 200-week SMA of 1.2865 ahead of the psychological level of 1.3000. If Cable experiences further downside momentum, it is likely to encounter immediate support at the May low of 1.2435 (May 2), and subsequently at the weekly low of 1.2344 (April 10). In the event that these levels are breached, a test of the temporary 55-day SMA at 1.233 is expected, followed by the April low at 1.2274 (April 3). If the pair continues to decline, it may potentially reach the significant 200-day SMA at 1.1960, before falling to the 2023 low of 1.1802 (March 8). The daily RSI rebounded beyond the 53 yardstick.
Resistance levels: 1.2540 1.2568 1.2679 (4H chart)
Support levels: 1.2442 1.2386 1.2367 (4H chart)
AUDUSD
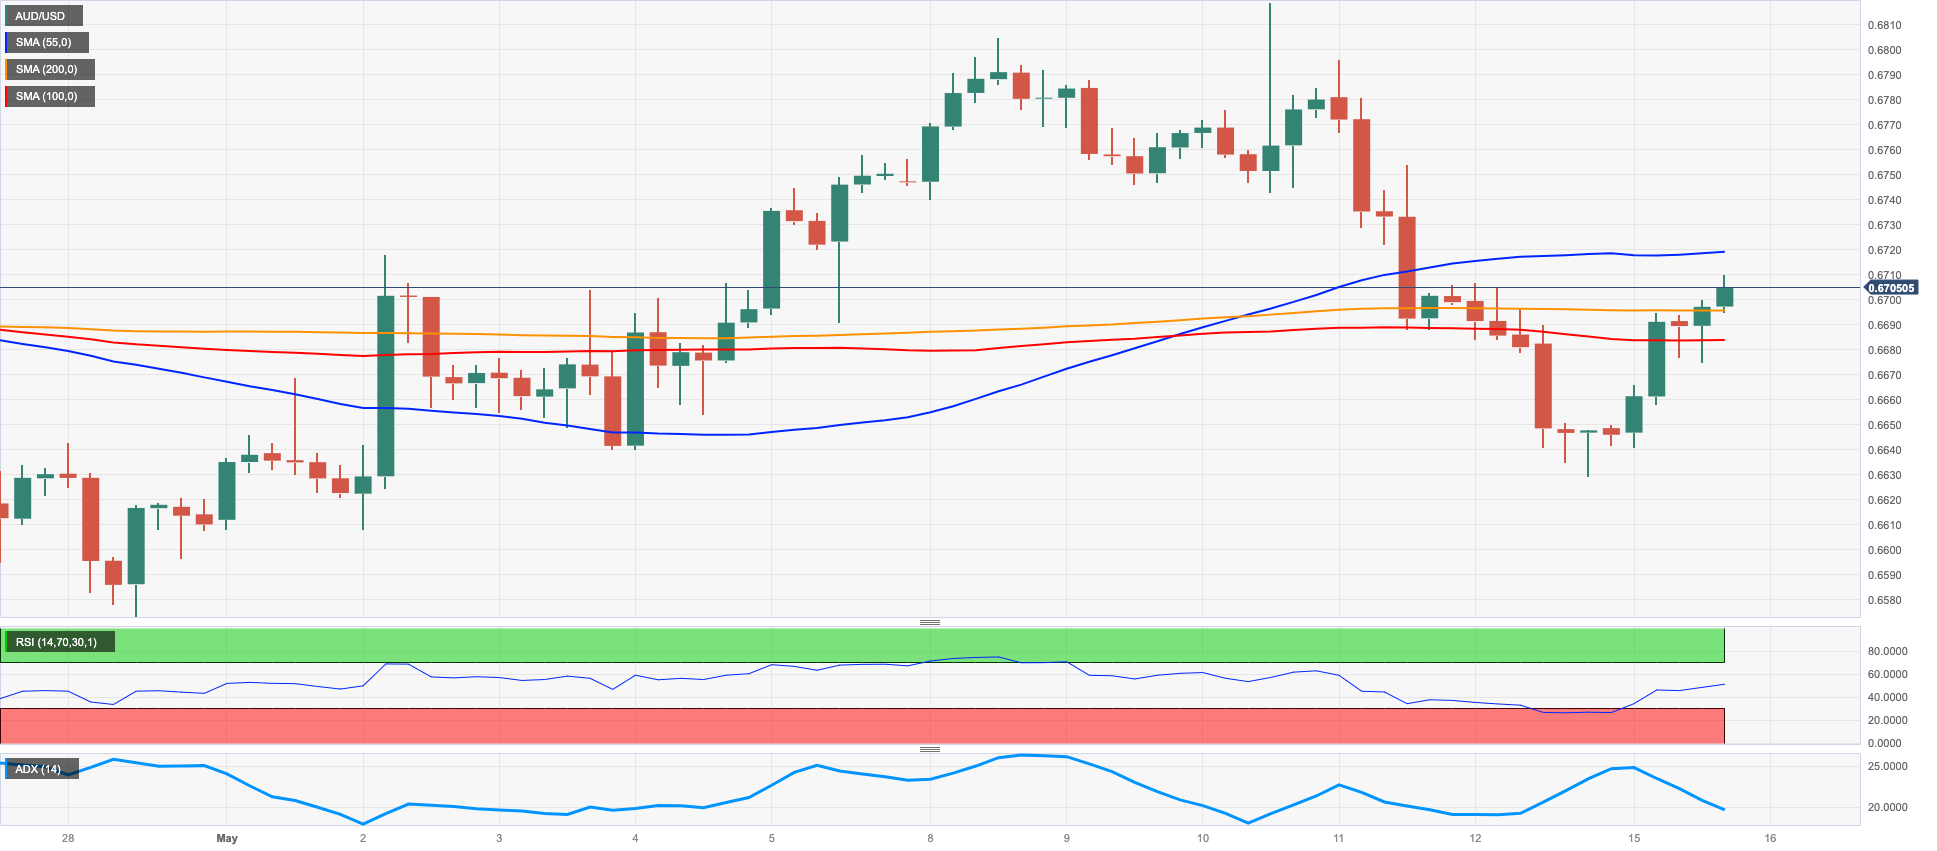
The marked daily decline in the dollar motivated AUD/USD to bounce off the area of multi-day lows near 0.6640 and revisit the area just above 0.6700 the figure at the beginning of the week.
Some extra support for the Aussie dollar came after the PBoC left unchanged its 1-Year MLF at 2.75%, as expected, while daily gains in copper prices and the iron ore also accentuated the bullish session in the pair on Monday.
Data wise Down Under, final prints saw Building Permits contract 0.1% MoM in March and 17.3% vs. the same month of 2022. Additionally, Private House Approvals contracted 2.8% in March vs. the previous month.
The weekly low of 0.6636 (12 May) is proving to be the AUD/USD's immediate conflict region. Further weakness may lead to a drop towards the April low of 0.6573 (28 April), ahead of the 2023 low of 0.6563 (10 March), as well as the weekly lows of 0.6386 (10 November 2022) and 0.6272. (3 November). The next upward hurdle, on the other hand, is the May high of 0.6818. (May 10). Once this level is breached, the crucial round level of 0.7000, followed by the weekly high of 0.7029 (February 14) and the 2023 high of 0.7157, might be a plausible goal (February 2). The RSI on the daily chart leapt to the proximity of 51.
Resistance levels: 0.6696 0.6718 0.6818 (4H chart)
Support levels: 0.6636 0.6620 0.6573 (4H chart)
GOLD
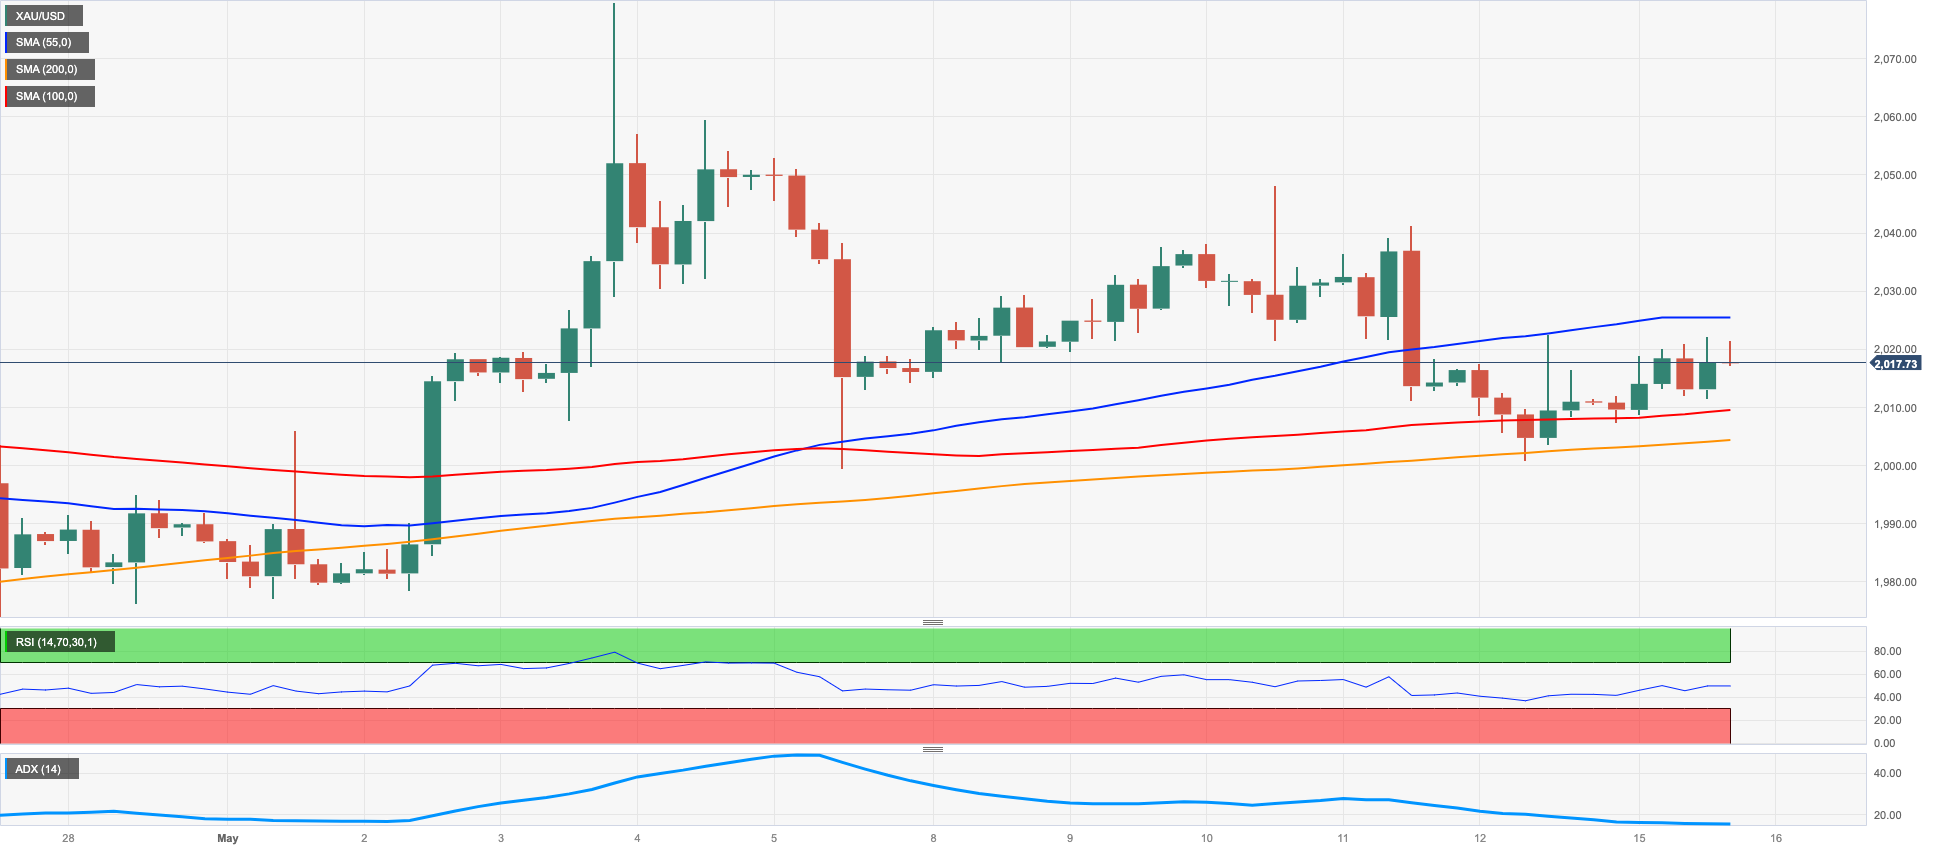
Gold prices reversed three daily pullbacks in a row and regained the smile somewhat at the beginning of the week.
Indeed, the precious metal managed to advance modestly on Monday in response to the resurgence of the selling bias in the greenback, while further gains in US yields across the curve curtailed potential gains in the metal.
So far, bullion should continue to track speculation around a potential impasse at the Fed’s tightening cycle as soon as at the June 14 gathering, while extra interest rate hikes by the ECB could put a more serious advance to the test.
The $2000 region appears to be a psychological threshold for gold bears at the moment. If the bearish pressure persists, the metal could possibly decline to the 2021 low of $1804 (February 28). Before this, it would have to break through the minor support level of $1999 (May 5), the weekly low of $1969 (April 19), the April low of $1949 (April 3), and the 100-day SMA at $1921. On the upside, the primary obstacle will be the highest point of 2023 at $2067 (May 4), followed by the March 2022 top of $2070 (March 8) and the record peak of $2075 (August 7, 2020).
Resistance levels: $2022 $2048 $2067 (4H chart)
Support levels: $2000 $1969 $1949 (4H chart)
CRUDE WTI
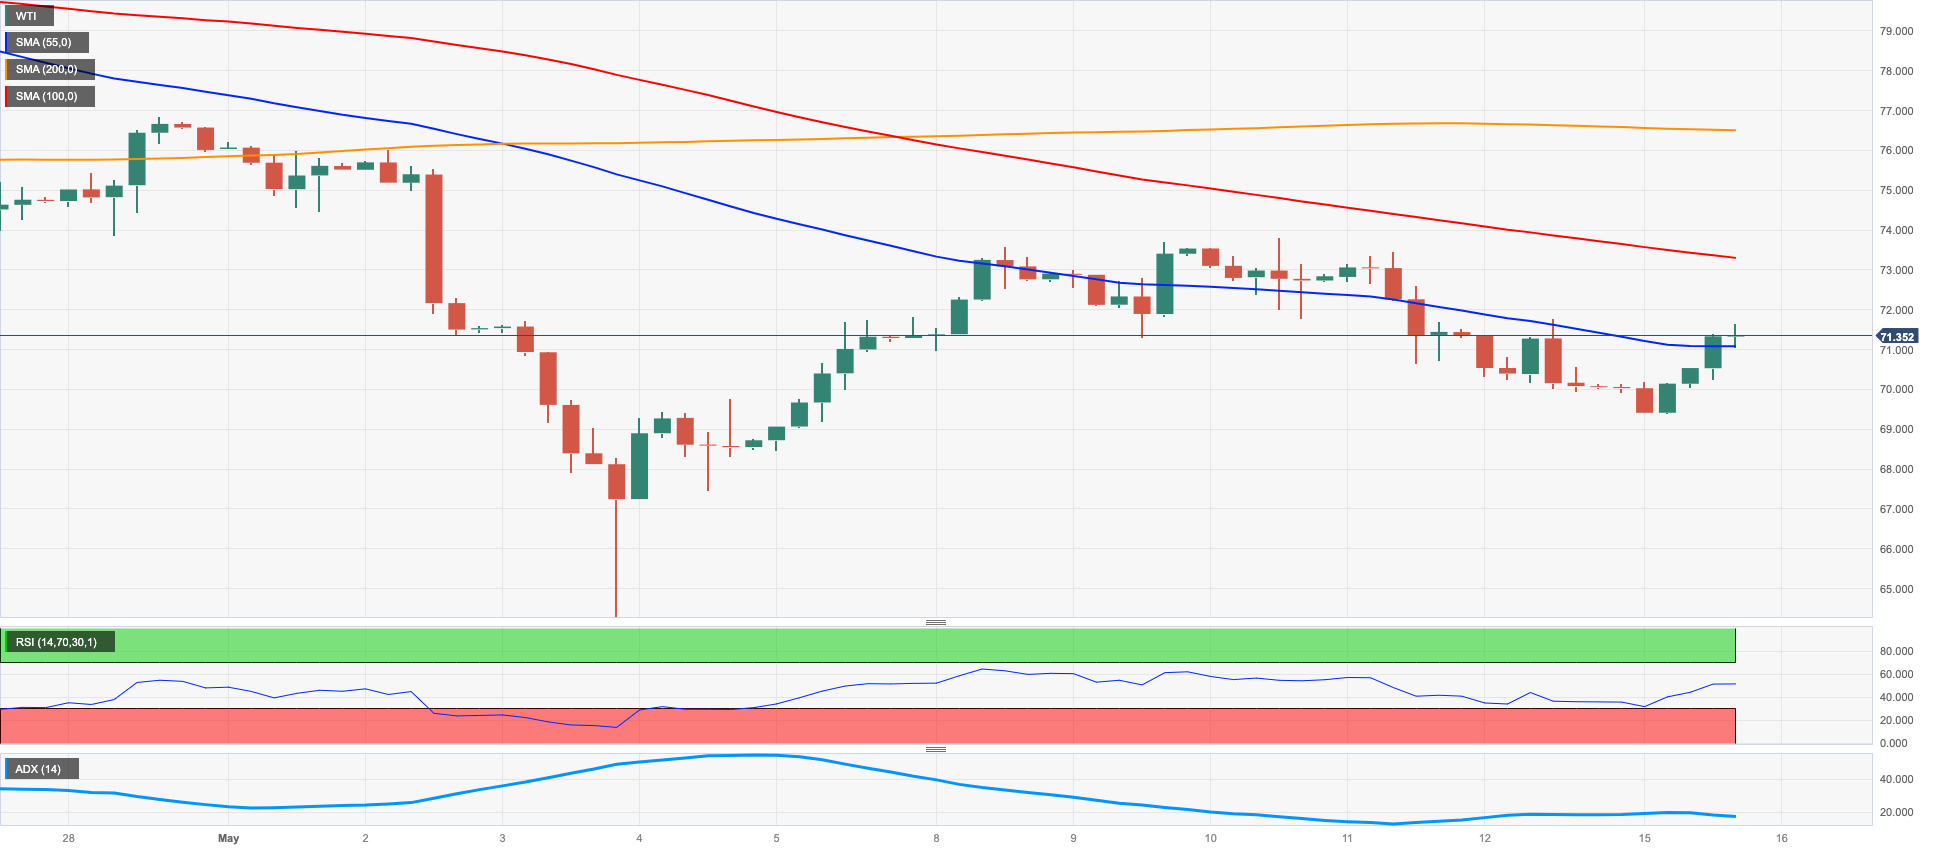
Prices of the WTI began the week in a positive style and surpassed the key $71.00 mark per barrel, bouncing off earlier lows near $69.50.
After three continuous everyday pullbacks, prices of the barrel of the commodity accumulate some steam and float around the $71.00 area on the rear of traders’ interests over the ongoing tight stock conditions of the market, while progressing output cuts by the OPEC+ likewise add to the energetic state of mind in crude oil.
Supporting the daily improvement additionally arises US intends to begin topping off the SPR and the recharged selling predisposition in the greenback.
Later in the week, the API and the EIA will give an account of week after week US crude oil inventories on Tuesday and Wednesday, separately.
Despite some recent advancements, crude oil prices have been steadily falling in the last sessions. For instance, on May 4, WTI reached a new 2023 low of $63.73 per barrel. Oil prices could fall further to the crucial $60 level if the December 2021 low of $62.46 (December 2), is cleared. Going against the norm, inconsistent higher swings ought to meet the starting obstacle at the week-by-week high of $79.14 (April 24), which goes before the key $80.00 mark and the basic 200-day SMA at $80.67. The peak of $83.49 in 2023 (April 12) comes next prior to the November 2022 high of $93.73 (November 7).
Resistance levels: $71.72 $73.83 $76.88 (4H chart)
Support levels: $69.38 $63.61 $62.42 (4H chart)
GER40
European equities kicked in the week in a positive fashion with the exception of the Spanish reference IBEX 35 (-0.35%).
Indeed, stocks alternated gains with losses amidst updated projections from the European Commission on inflation and growth, hinting at the idea that further tightening by the ECB remains well on the table for the time being.
Also adding to the cautious tone emerged the uncertainty surrounding the US debt ceiling discussions, despite market participants expects an eventual agreement in the 11th hour (as usual).
In the German debt market, the 10-year Bund yields added to Friday’s advance and flirted with the 2.32% area.
Data wise in Germany, Wholesale Prices contracted 0.4% MoM in April and 0.5% over the last twelve months.
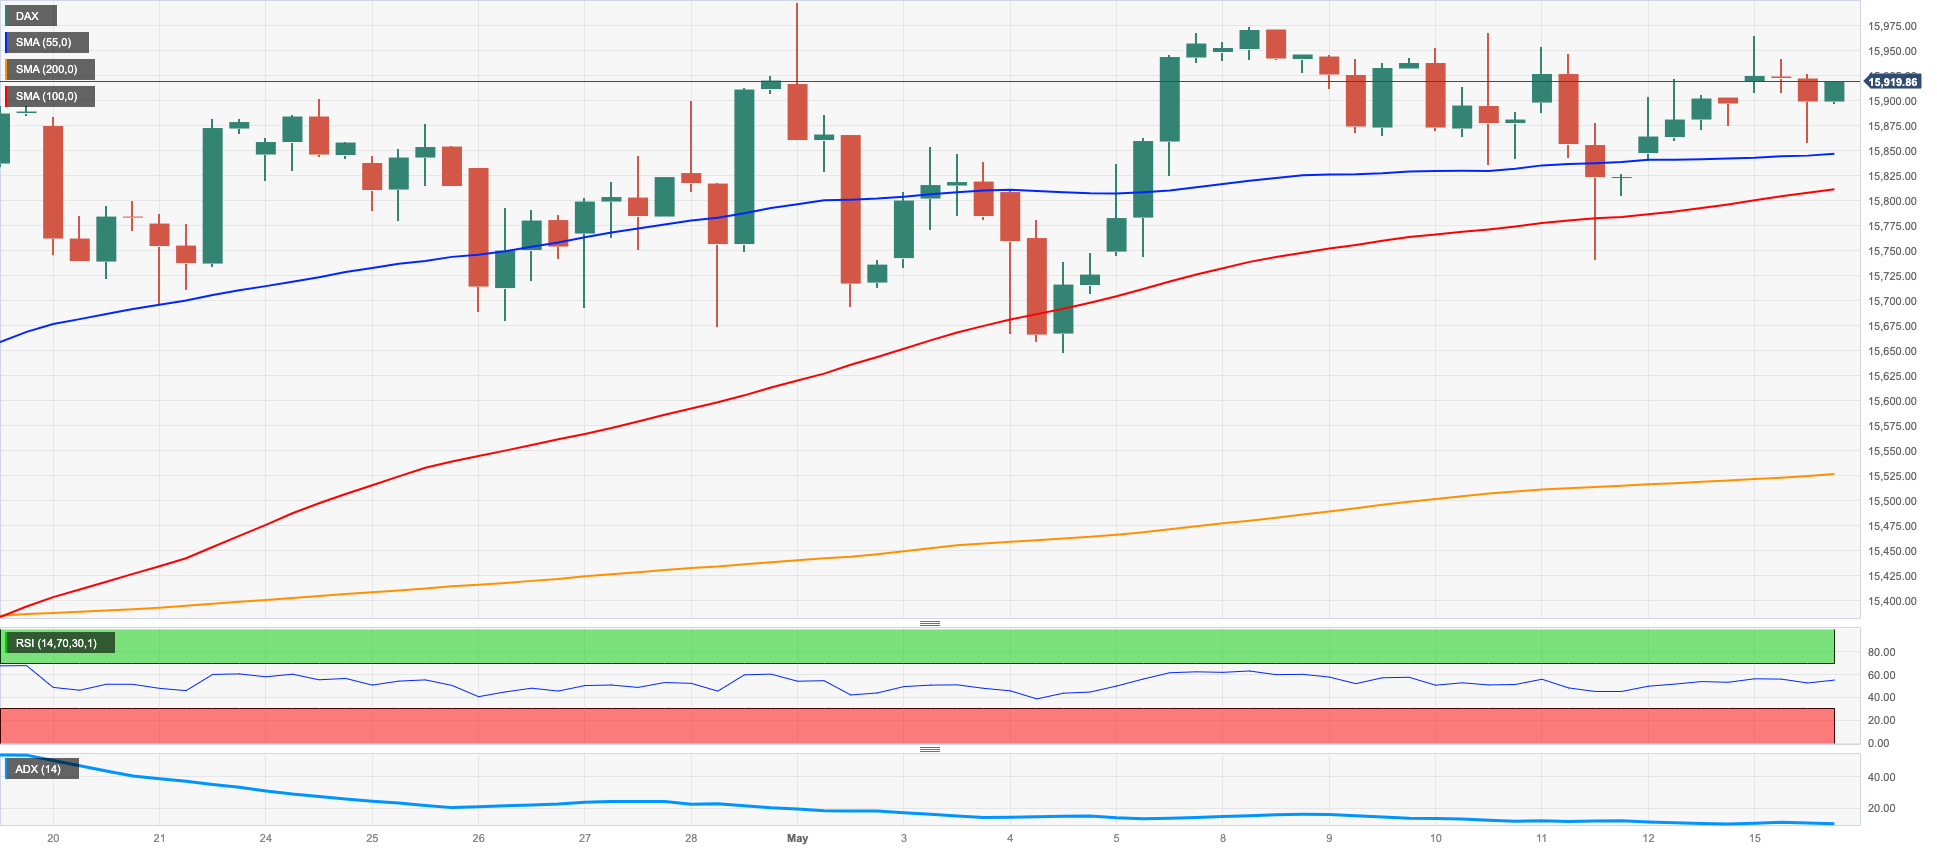
The DAX40 extended further the ongoing consolidative phase on Monday. In the event that the DAX40 outperforms the YTD high of 16011 (May 2), it could challenge the 2020 top at 16285 (January 5). Then again, the May low of 15662 (May 4) could act as a momentary dispute region in front of the 55-day SMA of 15543 and the April low of 15482 (April 5). If the list keeps on declining, the following potential help zone arises at the 100-day SMA of 15271. A more profound retracement could see minor help levels, for example, 14809 (March 24) and 14458 (March 20) as well as the critical 200-day SMA of 14320 become an integral factor. The everyday RSI looked stable around 57.
Best Performers: Siemens Energy AG, Henkel VZO, Siemens Healthineers
Worst Performers: Zalando SE, Deutsche Boerse, Sartorius AG VZO
Resistance levels: 16011 16090 16285 (4H chart)
Support levels: 15754 15662 15482 (4H chart)
NASDAQ
Tech equities gauged by the Nasdaq 100 reversed Friday’s losses and started the week in a promising note.
Indeed, speculation of a pause of the Fed’s hiking cycle at the June meeting added to the upbeat tone among traders on Monday, while the renewed selling bias in the greenback also collaborated with the upside.
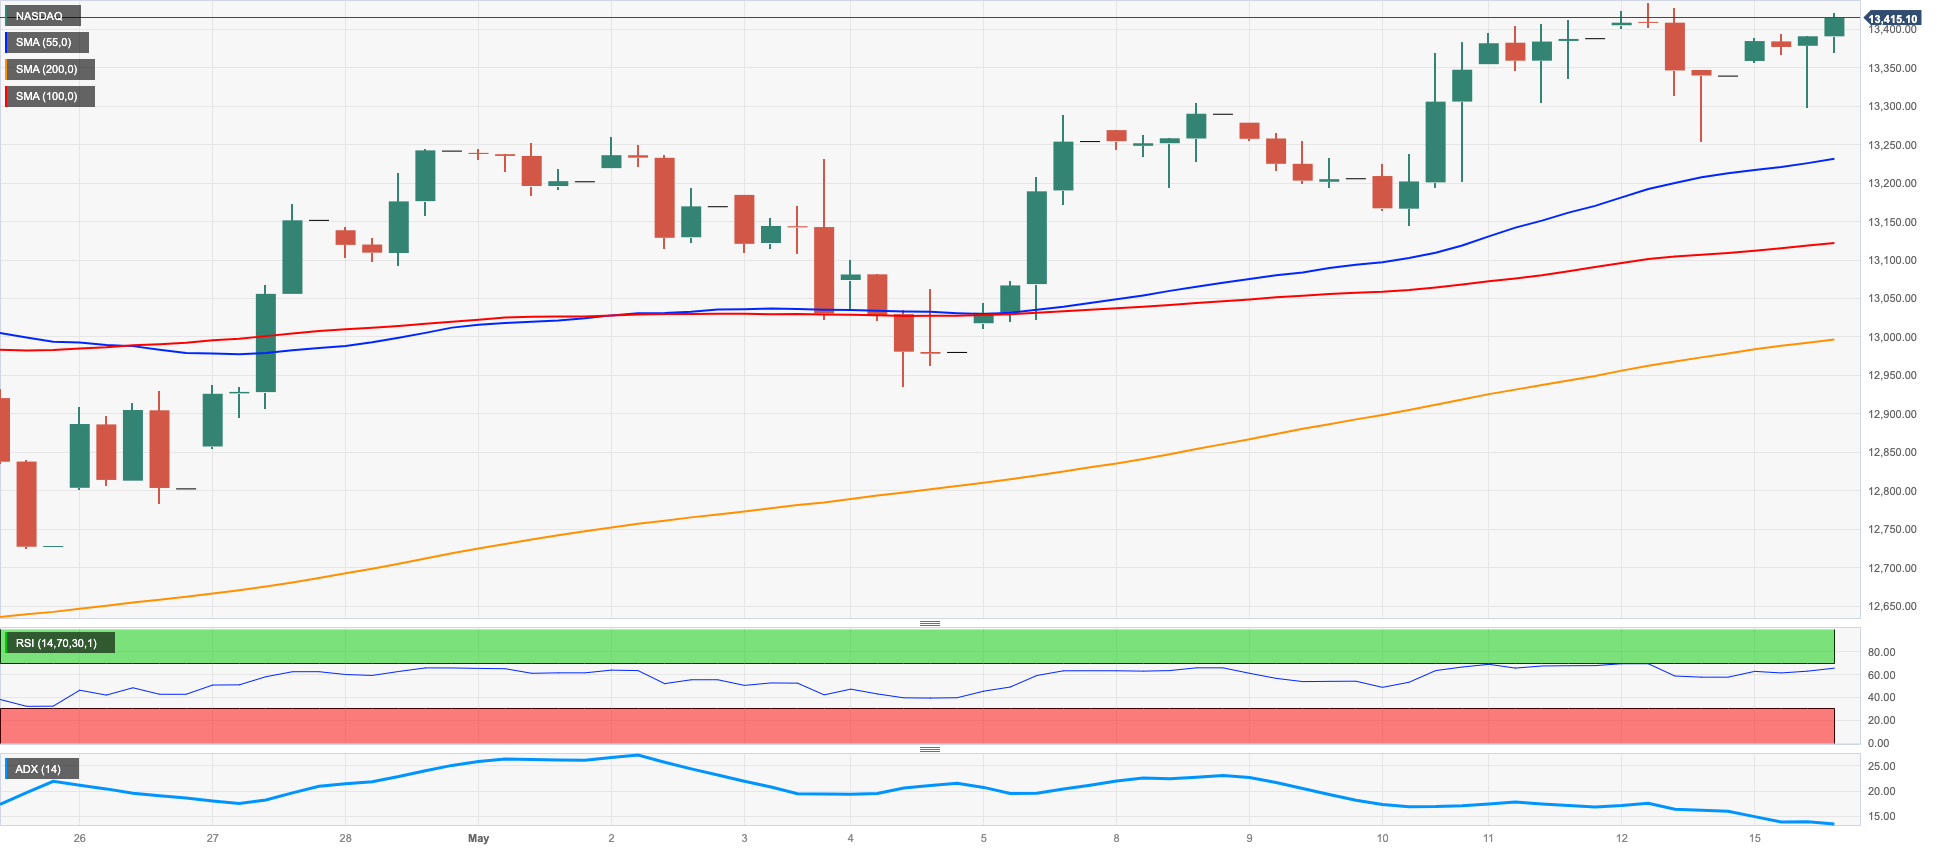
On May 12, the Nasdaq 100 reached its highest point of 2023, hitting 13427. If the upward trend continues, the next target could be the March 2022 peak of 15265, which occurred on March 29. On the flip side, if the trend turns bearish, there is support at the May low of 12938 (May 4), backed by the provisional 55-day SMA at 12782 and ahead of the April low of 12724 (April 25). If these levels are breached, there might be a challenge to the 200-day SMA at 12106, the March low of 11695 (dated March 13), as well as the weekly lows of 11550 and 11251. Further decline could potentially endanger the lowest point reached in 2023, 10696, recorded on January 6. The daily RSI rose past the 61 barrier.
Top Gainers: JD.com Inc Adr, Atlassian Corp Plc, Micron
Top Losers: Palo Alto Networks, Illumina, Exelon
Resistance levels: 13427 13720 14277 (4H chart)
Support levels: 13094 12938 12724 (4H chart)
DOW JONES
Stocks tracked by the three major US benchmark indices started the week on a positive foot, leaving behind part of last week´s strong bearish performance.
Indeed, the Dow Jones managed to edge modestly up amidst growing unease among investors over the debt ceiling, as policy makers still struggle to find common ground on the issue.
In addition, another poor print from regional manufacturing gauges lent support to the idea of a Fed´s pause in June, while the hawkish narrative from rate setters appears somewhat mitigated so far.
All in all, the Dow Jones gained 0.24% to 33382, the S&P500 advanced 0.38% to 4140 and the tech-reference Nasdaq Composite rose 0.74% to 12375.
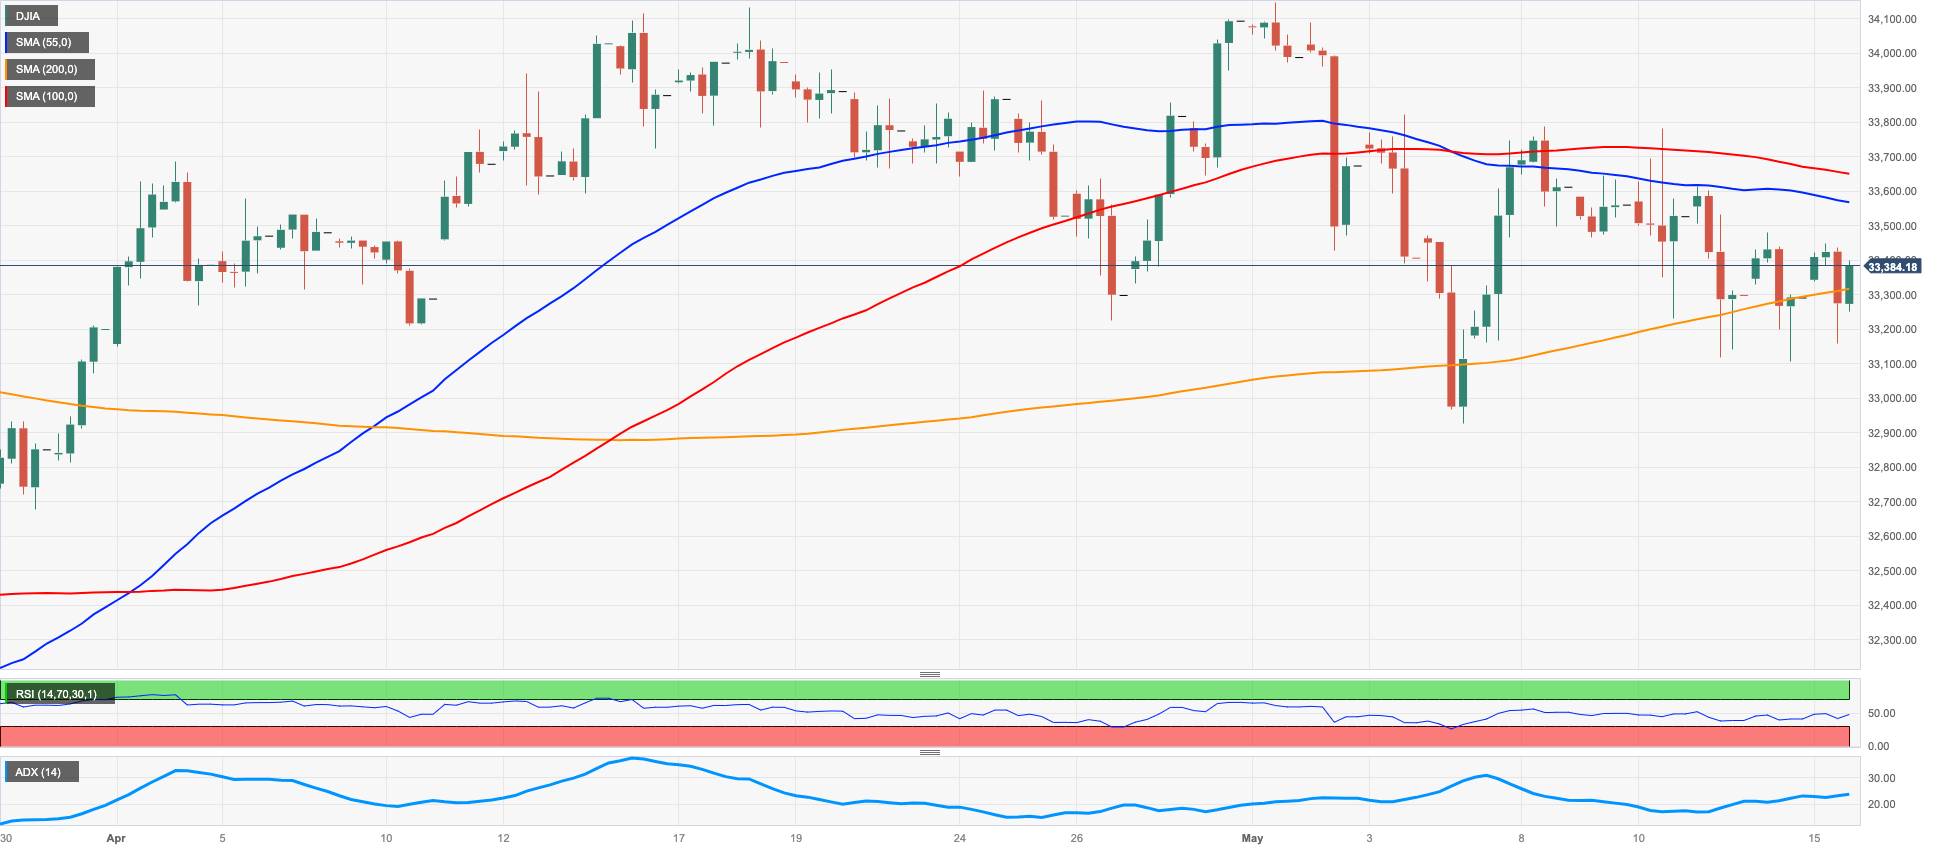
If the Dow continues to fall, it may find support at the May low of 32937 (May 4), ahead of the key 200-day SMA of 32758. Should the index keep dropping, the 2023 low of 31429 (March 15) could offer additional support prior to the 2022 low of 28660 (October 13). Having said that, the index is likely to meet initial resistance at the May peak of 34257 (May 1), followed by the 2023 high of 34,342 (January 13) and the December 2022 top of 34712 (December 13). If the index surpasses this point, it could generate momentum towards the April 2022 high of 35492 (April 21). The daily RSI advanced marginally to the 47 region.
Top Performers: Inter, Caterpillar, Salesforce Inc
Worst Performers: Verizon, Merck&Co, UnitedHealth
Resistance levels: 33772 34257 34334 (4H chart)
Support levels: 33110 32937 31805 (4H chart)
MACROECONOMIC EVENTS

All Information & Updates provided by:

All information relating to the financial markets available on this page has been prepared and issued by FXStreet (Forexstreet SL, Spain, Reg: B62498233) on the basis of publicly available information and all information believed to be reliable and does not conflict with Kuwaiti local laws, and all necessary care has been taken to before the company to ensure that the facts mentioned are correct from the source.
NCM Investment nor any of its directors or employees shall in any way be held responsible for the contents of this news, and the information contained on this page is intended only to provide clients with publicly available information and should not be construed as investment advice, report or analysis and/or constitute an offer or invitation to buy or sell financial instruments of any kind.
RISK WARNING: Forex and CFDs are highly risky leveraged products, as losses can exceed deposits. Please ensure you understand all the risks and take independent advice if necessary. NCM will segregate the clients based on the criteria of the regulator and its bylaws. NCM does not provide any advisory service; the material published does not constitute advice or a recommendation for a transaction in any financial instrument. NCM accepts no responsibility for any use of the content presented and any consequences of that use. Anyone acting on the information provided does so at their own risk.