
- Contact Us:
-

-

-

-


Daily Market Updates
17 May 2023
USDJPY
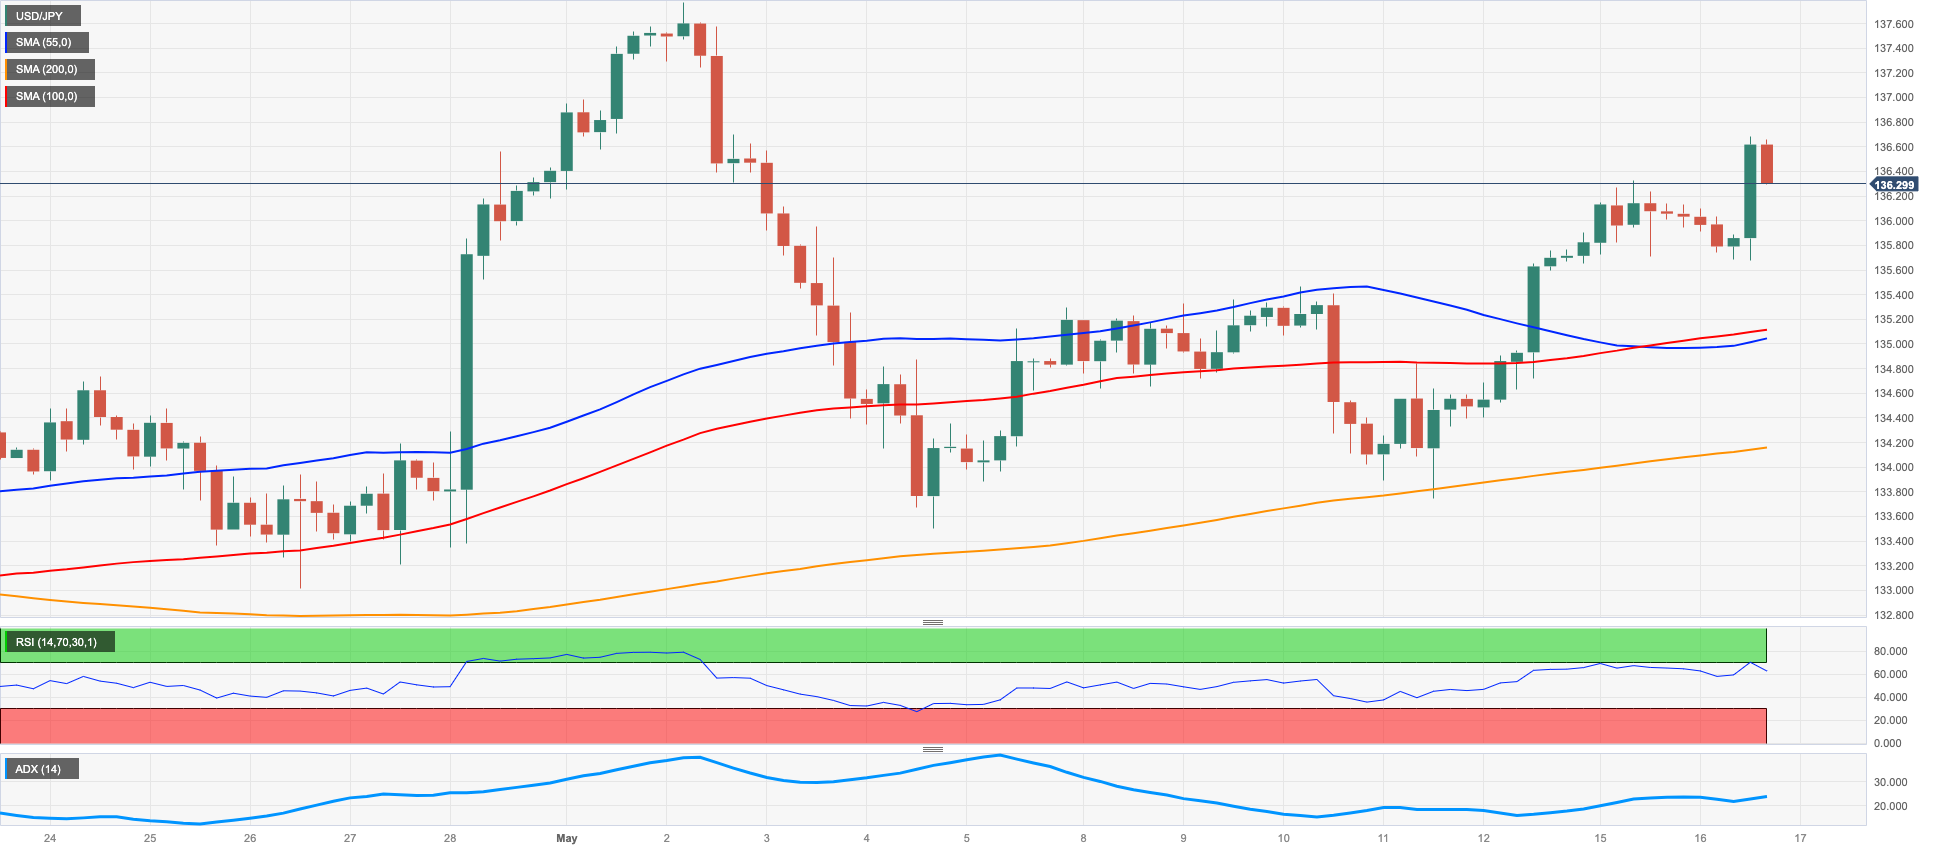
USD/JPY printed humble gains beyond 136.00 the figure, although this seems to have been enough to keep the upside bias in spot well in place for the fourth consecutive session on turnaround Tuesday.
Renewed upside impulse around the greenback and the continuation of the recovery in US yields across the curve underpinned another positive session in the pair, while the JGB 10-year yields remained stuck within the multi-week consolidative theme around the 0.40% region.
There were no data releases in the “Land of the Rising Sun” on Tuesday.
The USD/JPY recuperation faces an underlying obstruction level at the key 200-day SMA at 137.02 before the May high of 137.77 (May 2) and the 2023 pinnacle of 137.91 (March 8). Assuming further gains are made, it is conceivable that the week after week highs of 139.89 (November 30, 2022) and 142.25 (November 21, 2022) could be retested. The exact inverse, spot is expected to test the week by week low of 133.01 on April 26 in the event that bears recover the advantage. The break 100-day SMA at 132.95 appears to offer further assistance for this dispute zone. Before the April 5 low of 130.62, the March 24 low of 129.63, and the February 8 low of 128.08, a minor conflict level of 132.01 shows up. The absolute bottom in 2023, which would be 127.21 (January 16), would be the following drawback target. The everyday RSI rose to the proximity of 60.
Resistance levels: 136.32 137.77 137.91 (4H chart)
Support levels: 134.09 133.74 133.49 (4H chart)
GBPUSD
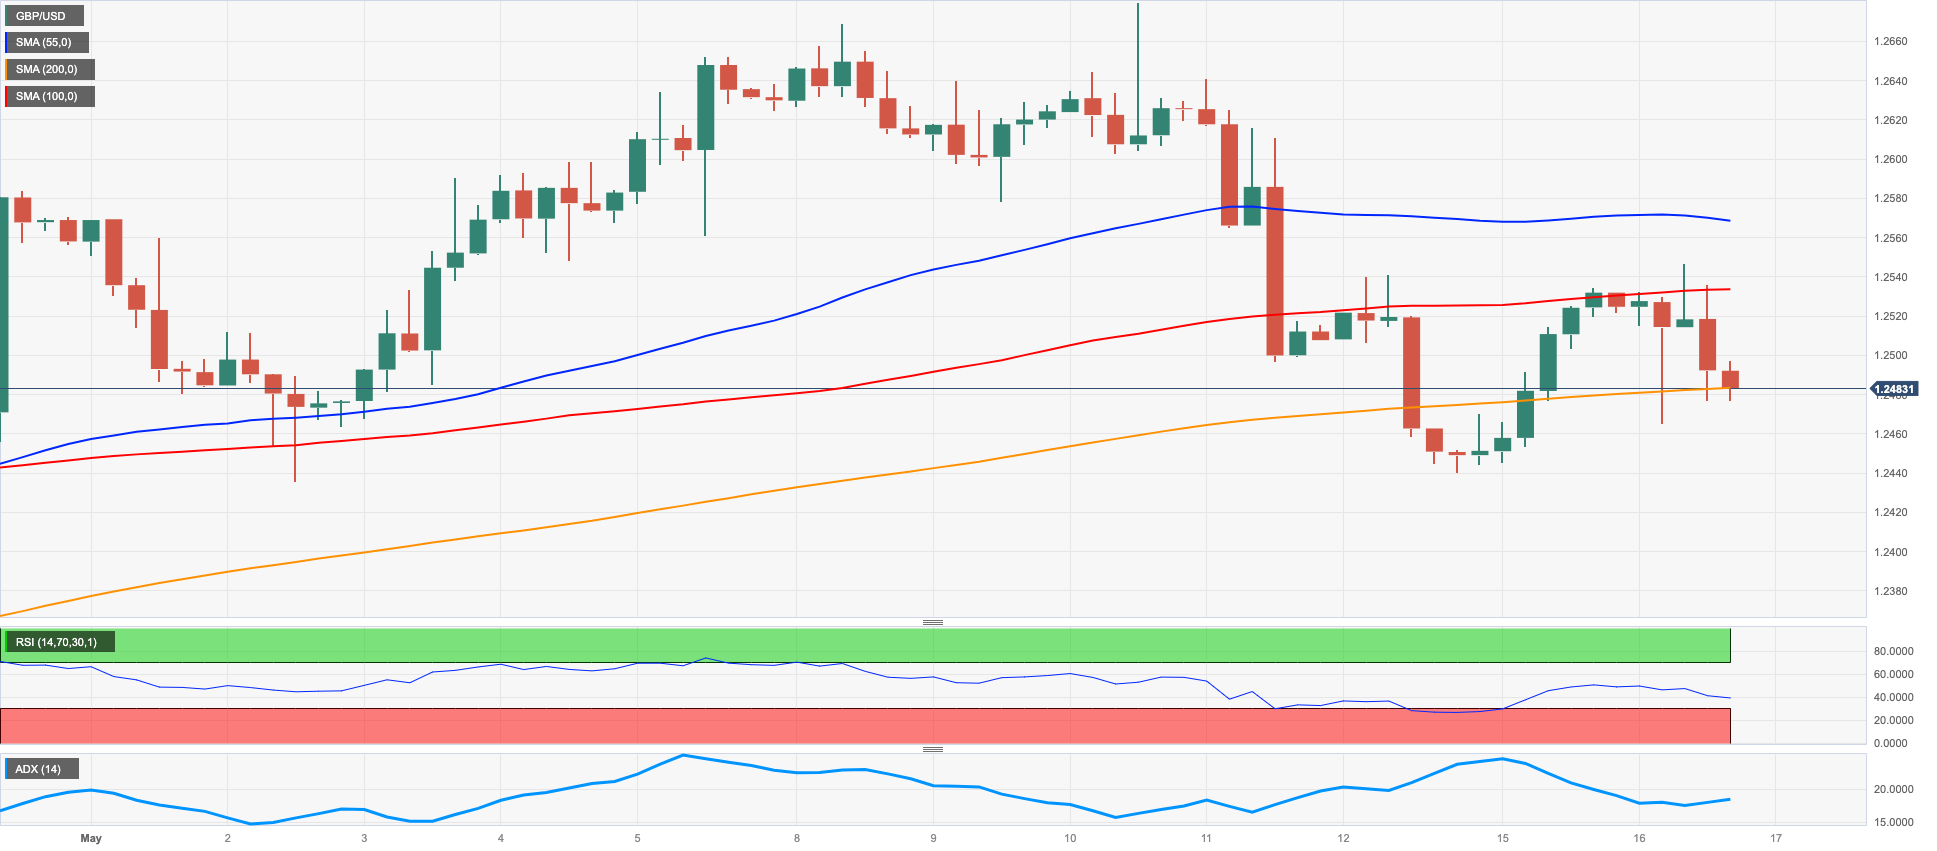
GBP/USD faded part of the auspicious start of the week and briefly revisited the 1.2465/60 band, where some decent contention appears to have resurfaced on Tuesday.
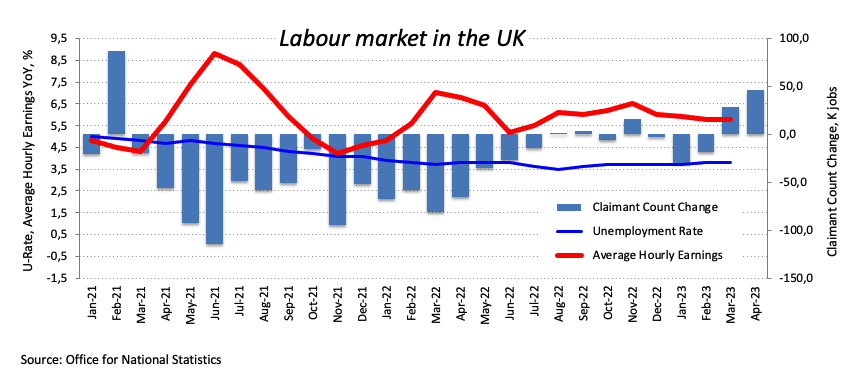
The daily knee-jerk in Cable came in response to the positive price action around the US dollar, while mixed feelings following the UK jobs report also seem to have sparked some selling bias around the quid.
Back to the UK docket, the Unemployment Change rose by 182K persons in February, although the Unemployment Rate ticked higher to 3.9% in March. Additional data saw the Claimant Count Change increase by 46.7K people and the Average Earnings inc. Bonus held steady at 3.8% from a year earlier.
On the upside, GBP/USD is currently targeting the 2023 high at 1.2668 (8 May), with buyers also focusing on the 200-week line SMA at 1.2865 ahead of the psychological level of 1.3000. If Cable experiences further downside momentum, it is likely to encounter immediate support at the May low of 1.2435 (2 May) and then the weekly low of 1.2344 (10 April). If these levels are breached, a test of the interim 55-day line SMA at 1.233 is likely, followed by the April low at 1.2274 (3 April). If the pair continues to fall, it could possibly reach the important 200-day line SMA at 1.1960 before falling to the 2023 low at 1.1802 (8 March). The RSI on the daily chart receded to the proximity of the key 50 mark.
Resistance levels: 1.2546 1.2568 1.2679 (4H chart)
Support levels: 1.2442 1.2386 1.2367 (4H chart)
AUDUSD
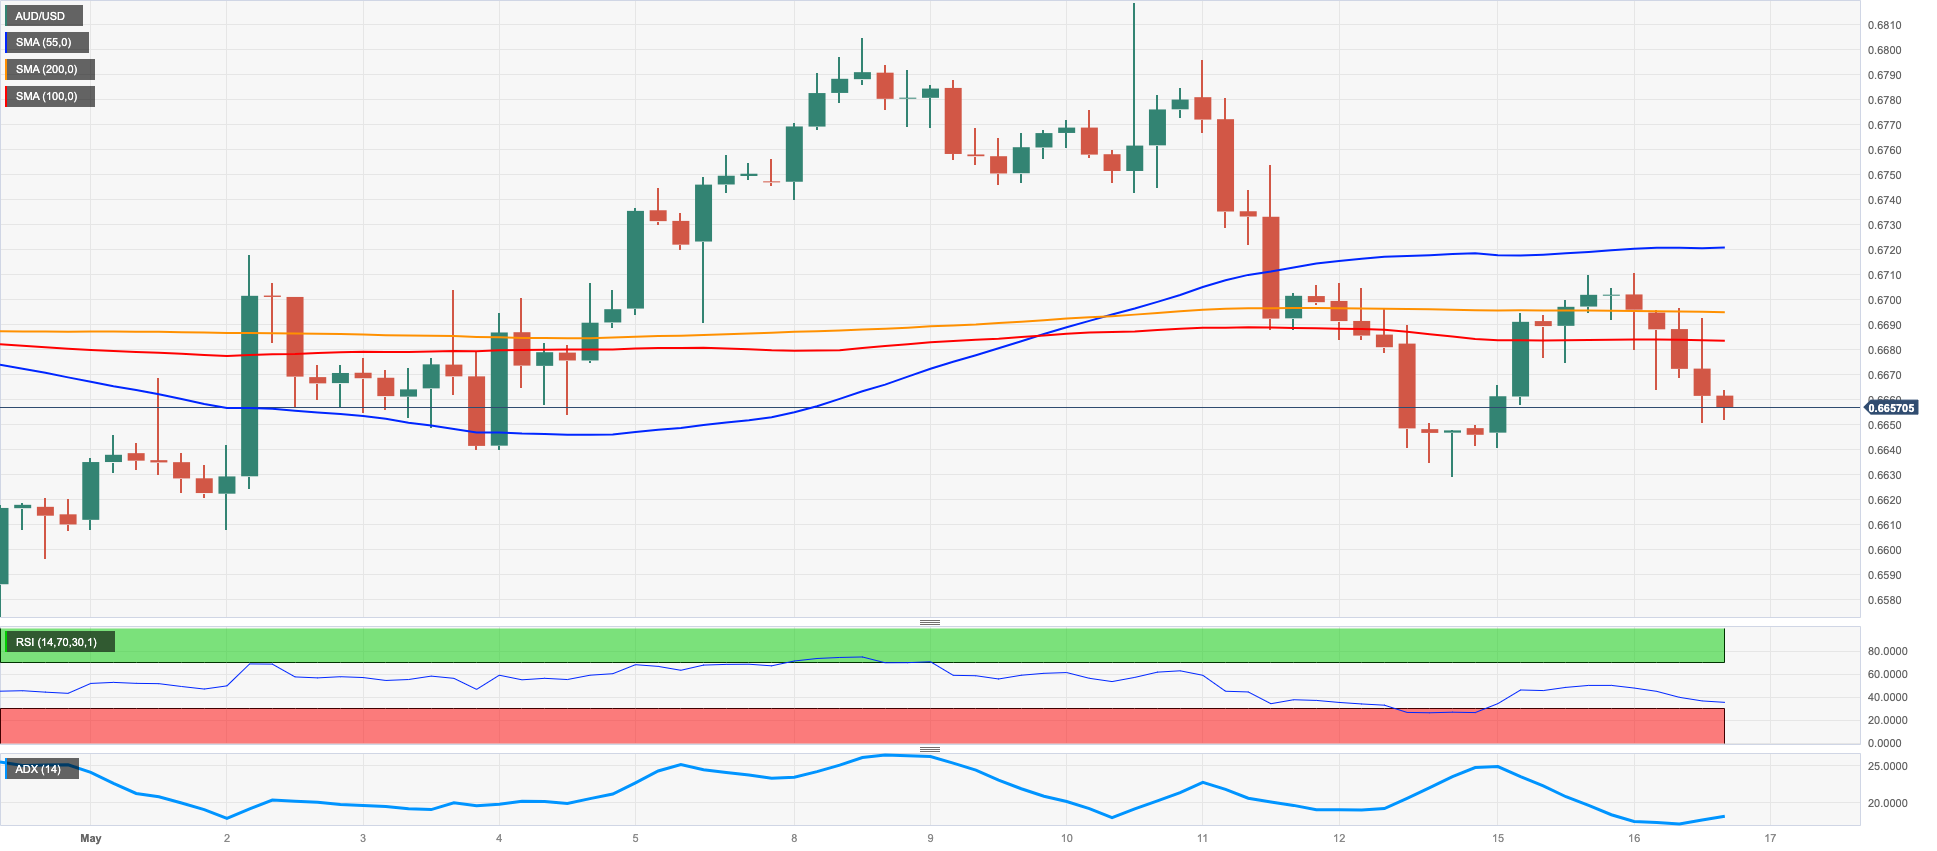
Inconclusive price action in the greenback was enough to spark a corrective move in AUD/USD, this time slipping back to the 0.6665/60 band on Tuesday.
The Aussie dollar, in the meantime, also derived extra weakness from the disheartening results from the Chinese docket published during early trade, while the mixed performance in the commodity galaxy also helped with the downbeat mood after copper prices clocked new lows and prices of the iron ore attempted a mild rebound.
In Oz, the RBA has released the Minutes of the May meeting at which the central bank unexpectedly raised the OCR by 25 basis points. The Minutes showed that Board members discussed another pause and agreed that further increases will depend on how the economy and inflation perform.
Other than the RBA Minutes, the Westpac Consumer Confidence Index worsened to 79.0 in May (from 85.8).
The immediate area of contention for AUD/USD is centered around the weekly low of 0.6636 (May 12t). If further weakness persists, it could potentially result in a decline towards the April low of 0.6573 (April 28), followed by the lowest point of 2023 at 0.6563 (March 10). Additionally, the weekly lows of 0.6386 (November 10, 2022), and The November 2022 low of 0.6272 (November 3) also present potential support levels. On the other hand, the next significant resistance level to overcome is the May high of 0.6818 (May 10). Once this level is surpassed, the key psychological level of 0.7000 becomes a plausible target, along with the weekly high of 0.7029 (February 14) and the highest point of 2023 at 0.7157 (February 2). In terms of technical indicators, the RSI on the daily chart dropped below 47.
Resistance levels: 0.6709 0.6796 0.6818 (4H chart)
Support levels: 0.6664 0.6636 0.6620 (4H chart)
GOLD
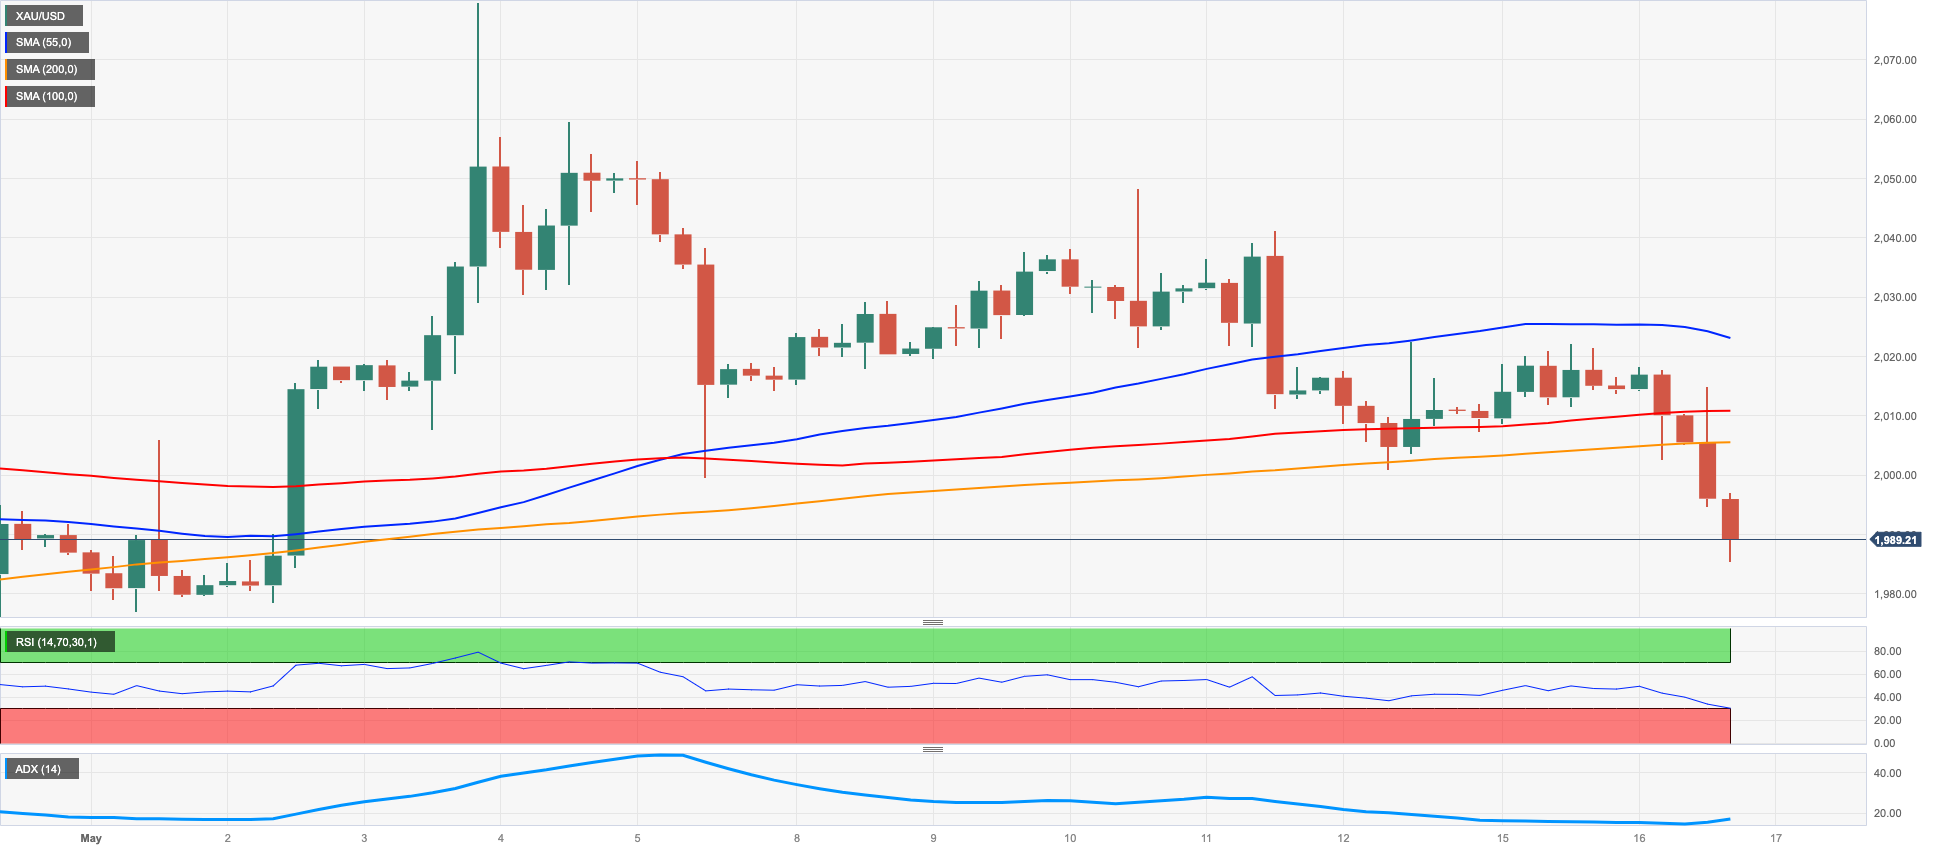
Renewed strength in the US dollar coupled with higher US yields across the curved weighed on the precious metal and dragged prices of the ounce troy to new multi-session lows in the sub-$2000 region on Tuesday.
Indeed, solid prints from the US docket – particularly April’s Retail Sales – confirmed once again the resilience of US consumers, while persevering jitters around the debt ceiling issue also lent wings to the buck on Tuesday.
Moving forward, bullion should continue to track dollar’s dynamics amidst sticky inflation, the above-mentioned debt ceiling discussion as well as omnipresent hawkish narrative from Fed’s rate setters.
It appears that gold bears are facing a psychological threshold at the $2000 mark. If the selling pressure gathers impulse, the metal could potentially fall to its 2021 low of $1804 (February 28). To do this, it would need to break through the weekly low of $1969 (April 19), the April low of $1949 (April 3), and the 100-day SMA at $1923. On the upside, the primary obstacle will be the highest point of 2023 at $2067 (May 4), followed by the March 2022 top of $2070 (March 8) and the record peak of $2075 (August 7, 2020).
Resistance levels: $2004 $2022 $2048 (4H chart)
Support levels: $1987 $1969 $1949 (4H chart)
CRUDE WTI
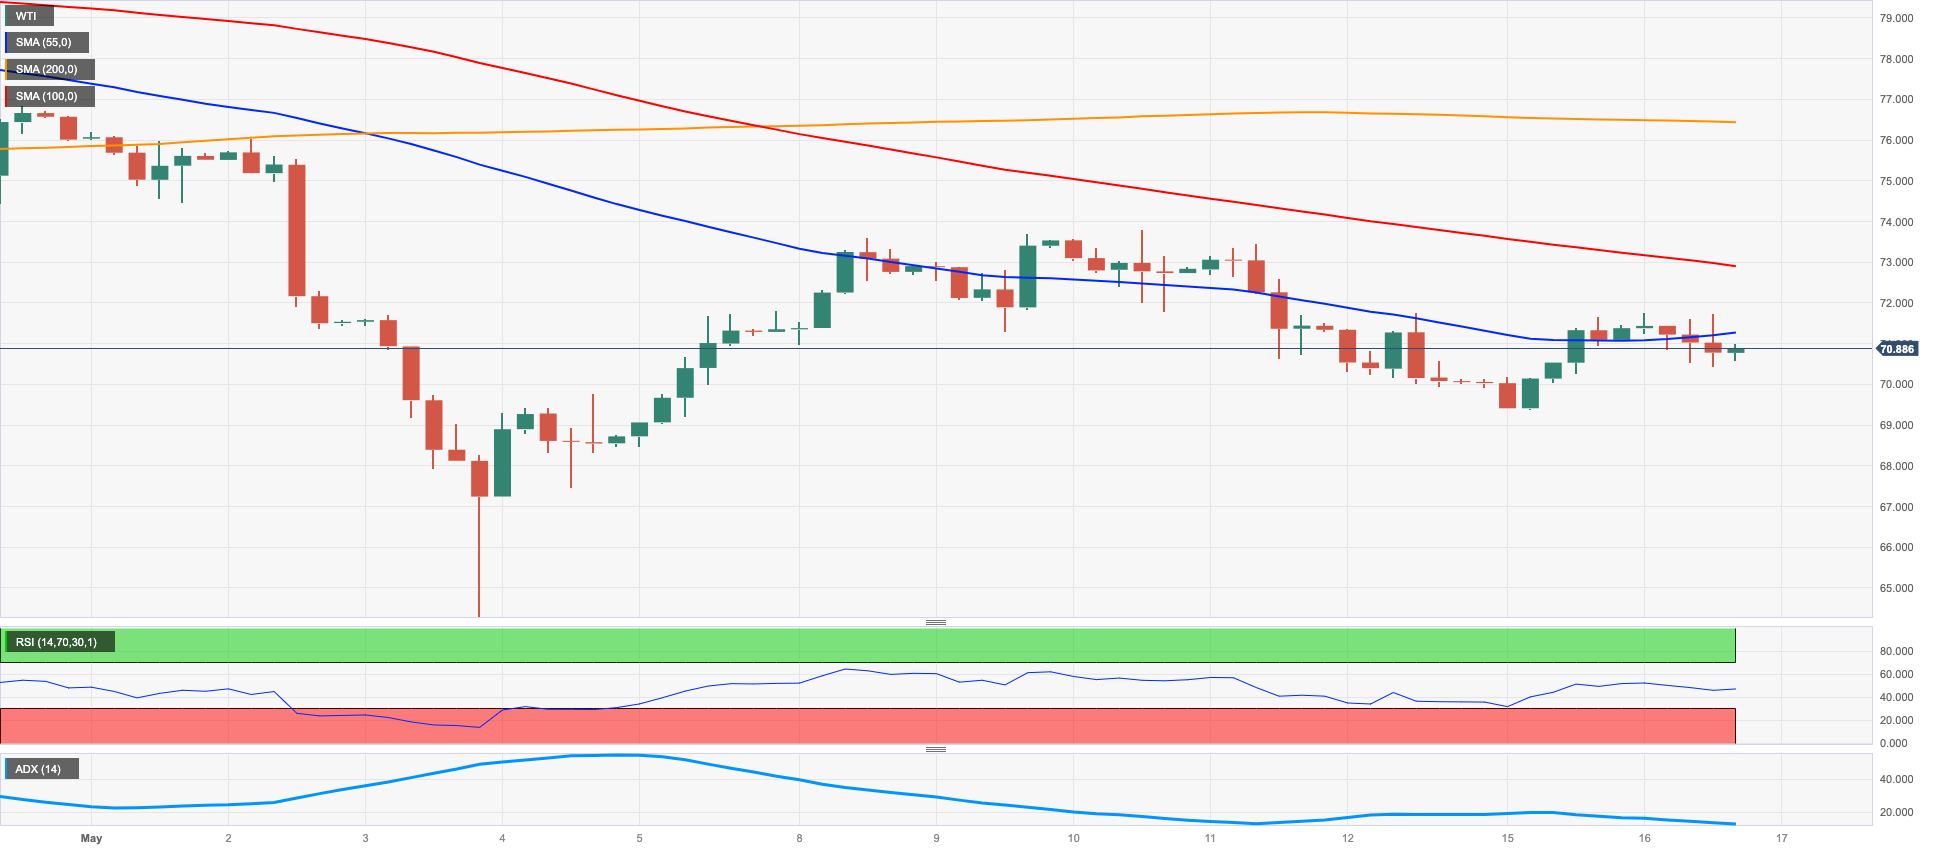
Crude oil prices remained choppy on Tuesday and hovered around the $71.00 mark per barrel, as traders continued to assess the discouraging results from the Chinese manufacturing sector, while the firmer dollar also put the commodity under further stress.
Somewhat limiting the downside emerged the IEA’s updated projections for global oil demand for this year (102 mbpd) and the announcement that the US government will start to top up its SPR.
Furthermore, wildfires in the Canadian region of Alberta also added some support to the commodity from the supply side.
Later in the NA session, the API will report on US crude oil inventories in the week to May 12 ahead of the EIA’s report on Wednesday.
Despite some recent progress, crude oil prices have fallen steadily in recent sessions. WTI, for example, hit a new 2023 low of $63.73 per barrel on 4 May. Oil prices could fall further to the crucial $60 level if the December 2021 low of $62.46 (December 2) is breached. Inconsistent upside, contrary to the norm, is likely to face a first obstacle at the weekly high of $79.14 (April 24), ahead of the key $80.00 level and the fundamental 200-day SMA at $80.57. The 2023 top of $83.49 (April 12) follows ahead of the November 2022 high of $93.73 (November 7).
Resistance levels: $71.74 $73.83 $76.89 (4H chart)
Support levels: $69.38 $63.61 $62.42 (4H chart)
GER40
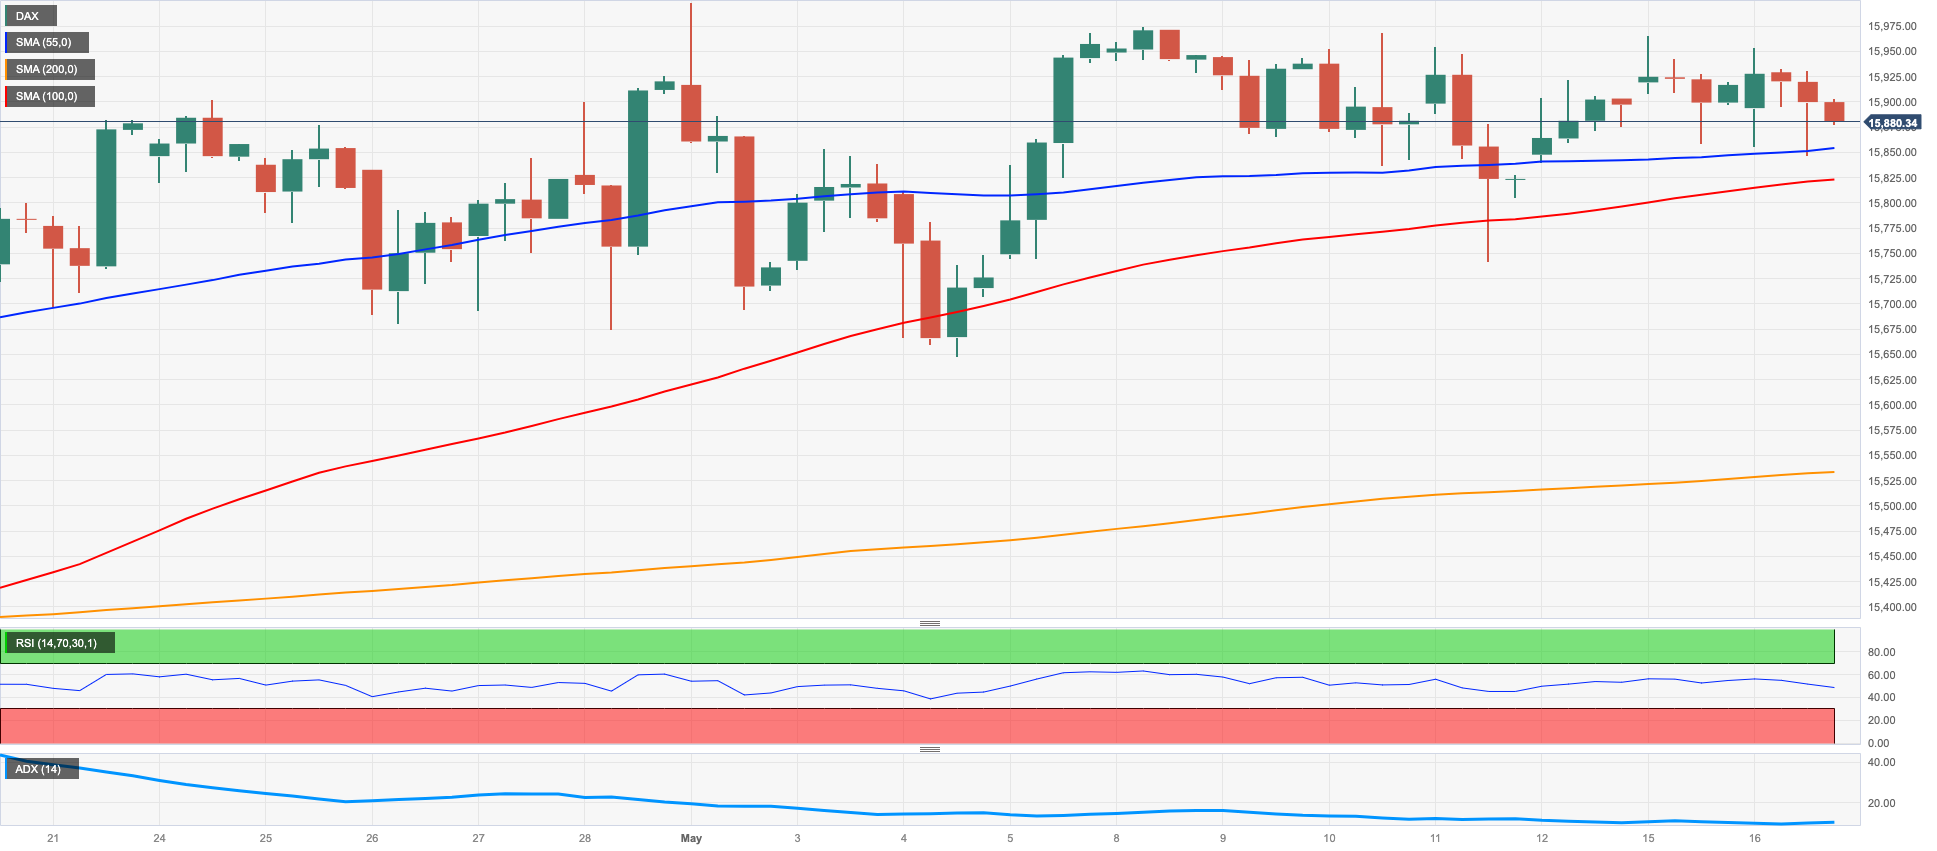
Germany’s stocks reference DAX40 partially reversed Monday’s promising start of the week and ended Tuesday’s session slightly on the defensive, although always maintaining the range bound theme in place since mid-April.
As a matter of fact, investors assessed the discouraging prints from the German and EMU Economic Sentiment tracked by the ZEW survey for the month of May in combination with opaque prints from another revision of the GDP for the broader Euroland in the January-March period.
Also weighing on the appetite for the risk complex appeared the prospects for further tightening by the ECB in June and July (and September?) as well as the spectre of the US debt ceiling discussions.
In the German bonds market, the benchmark 10-year Bund yields rose for the third session in a row, this time surpassing the 2.35% level.
The DAX40 continued its ongoing consolidation phase on Tuesday, extending the erratic performance. If the DAX40 surpasses the year-to-date high of 16011 recorded on May 2, it could challenge the 2020 peak of 16285 (January 5). Alternatively, the May low of 15662 (May 4) could act as a temporary point of support before the 55-day SMA of 15550 and the April low of 15482 (April 5). If the index continues to decline, the following potential support zone arises at the 100-day SMA of 15289. A deeper retracement could see minor support levels such as 14809 (March 24) and 14458 (March 20) as well as the critical 200-day SMA of 14332 play an important role. The daily RSI looked stable near 56.
Best Performers: Siemens Energy AG, Airbus Group, Infineon
Worst Performers: Zalando SE, Adidas, Siemens Healthineers
Resistance levels: 16011 16090 16285 (4H chart)
Support levels: 15754 15662 15530 (4H chart)
NASDAQ
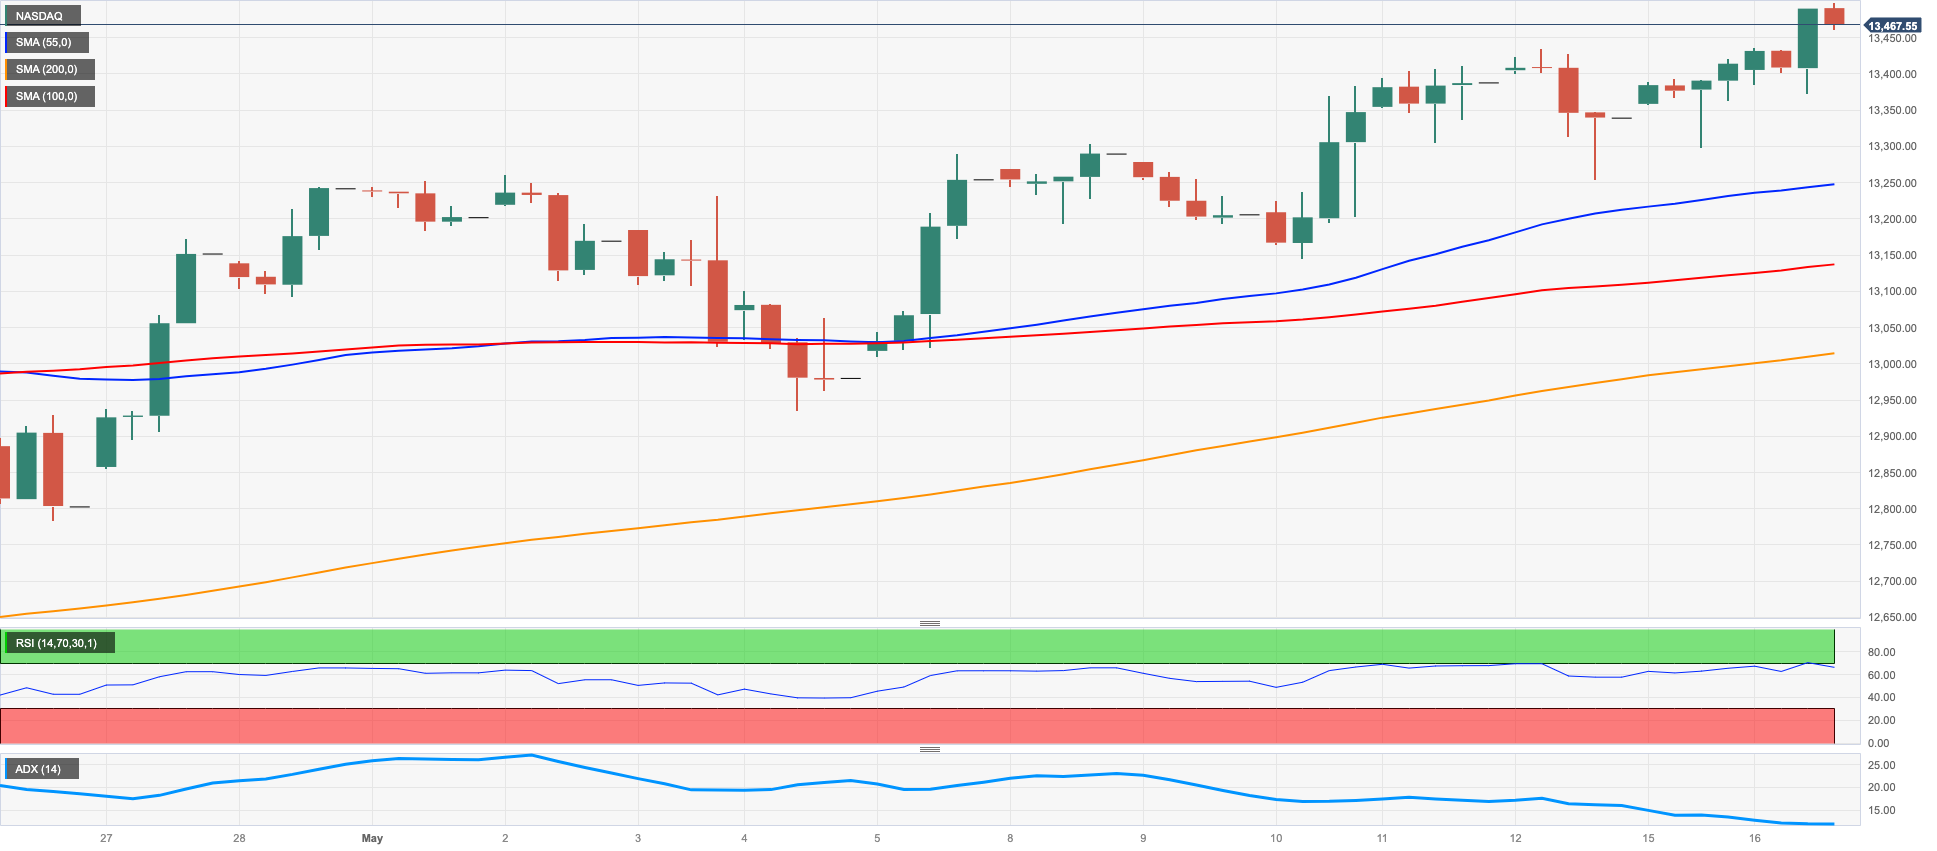
The upside momentum in the tech benchmark Nasdaq 100 remained everything but abated on Tuesday.
Indeed, the index gathered further pace and added to Monday’s gains to print new 2023 peaks in the 13500 region, an area last visited back in the summer of 2022 on the back of firm optimism among investors, which appeared in turned underpinned by the perception that the Federal Reserve might pause its hiking cycle as soon as in June.
The Nasdaq 100 printed a new 2023 high at 13498 on May 16. Should the upward trend persist, the next target to aim for could be the peak reached in March 2022 at 15265 (March 29). On the other hand, if the trend reverses and turns bearish, there is support available at the May low of 12938 (May 4). This support is reinforced by the provisional 55-day SMA at 12809 and is further preceded by the April low of 12724 (April 25). If these support levels are breached, it may pose a challenge for the 200-day SMA at 12109, the March low of 11695 (March 13), as well as the weekly lows of 11550 and 11251. A further decline could potentially jeopardize the lowest point recorded in 2023, which stands at 10696 (January 6). The daily RSI trespassed the 64 yardstick.
Top Gainers: AMD, Alphabet A, Alphabet C
Top Losers: Seagen, Warner Bros Discovery Inc, Moderna
Resistance levels: 13498 13720 14277 (4H chart)
Support levels: 13121 12938 12724 (4H chart)
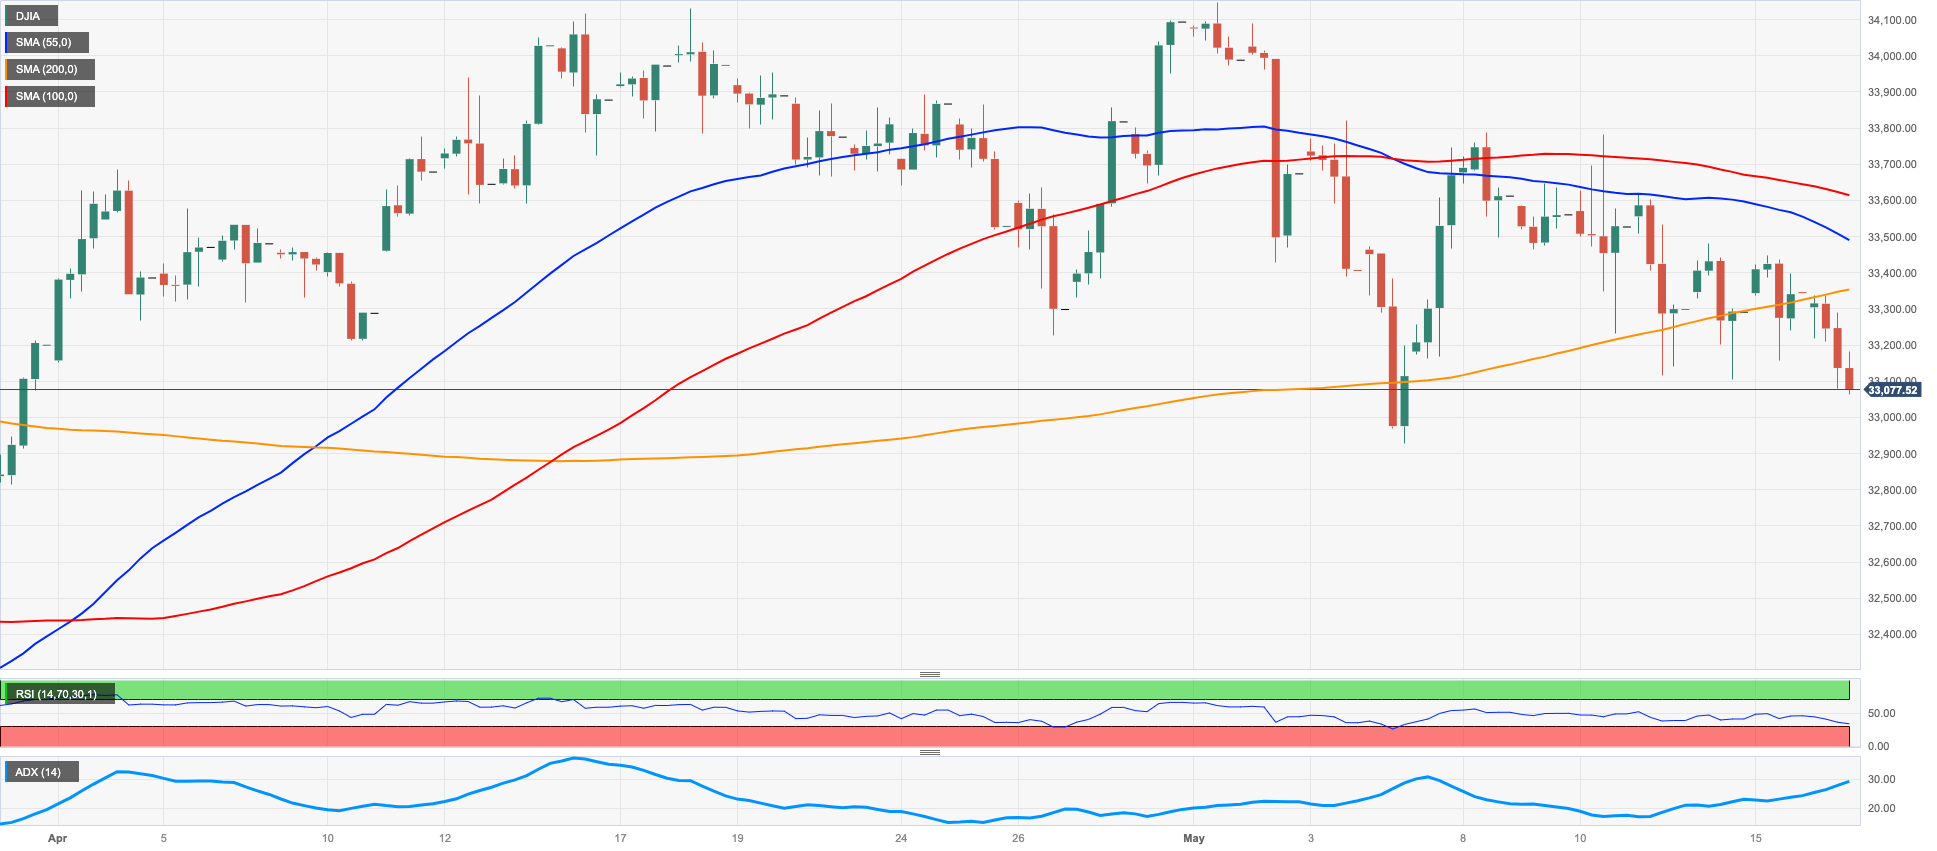
DOW JONES
US equities gauged by the Dow Jones retreated to multi-day lows near the 33000 mark before bouncing tepidly on turnaround Tuesday.
Investors’ sentiment was hurt in response to dour forecasts from megacap Home Depot regarding its annual sales, while persevering unease around the still unresolved debt ceiling issue also added to the daily bearishness in combination with the stronger dollar and weak Retail Sales data.
Overall, the Dow Jones retreated 0.75% to 33097, the S&P500 dropped 0.32% to 4122 and the tech-heavy Nasdaq Composite advanced 0.20% to 12390.
If the Dow falls further, it may find support at the May low of 32937 (May 4), which is just ahead of the crucial 200-day SMA of 32759. If the index continues to fall, the 2023 bottom of 31429 (March 15) might provide additional support before the 2022 low of 28660 (October 13). Just the opposite, the index is projected to encounter early resistance at the May peak of 34257 (May 1), followed by the 2023 high of 34342 (January 13) and the December 2022 peak of 34712 (December 13). If the index rises over this level, it may gain speed toward the April 2022 high of 35492 (April 21). The daily RSI broke below the 43 level.
Top Performers: Microsoft, Salesforce Inc, J&J
Worst Performers: Nike, 3M, Dow
Resistance levels: 33331 33772 34257 (4H chart)
Support levels: 33084 32937 31805 (4H chart)
MACROECONOMIC EVENTS

All Information & Updates provided by:

All information relating to the financial markets available on this page has been prepared and issued by FXStreet (Forexstreet SL, Spain, Reg: B62498233) on the basis of publicly available information and all information believed to be reliable and does not conflict with Kuwaiti local laws, and all necessary care has been taken to before the company to ensure that the facts mentioned are correct from the source.
NCM Investment nor any of its directors or employees shall in any way be held responsible for the contents of this news, and the information contained on this page is intended only to provide clients with publicly available information and should not be construed as investment advice, report or analysis and/or constitute an offer or invitation to buy or sell financial instruments of any kind.
RISK WARNING: Forex and CFDs are highly risky leveraged products, as losses can exceed deposits. Please ensure you understand all the risks and take independent advice if necessary. NCM will segregate the clients based on the criteria of the regulator and its bylaws. NCM does not provide any advisory service; the material published does not constitute advice or a recommendation for a transaction in any financial instrument. NCM accepts no responsibility for any use of the content presented and any consequences of that use. Anyone acting on the information provided does so at their own risk.