
- Contact Us:
-

-

-

-


Daily Market Updates
18 May 2023
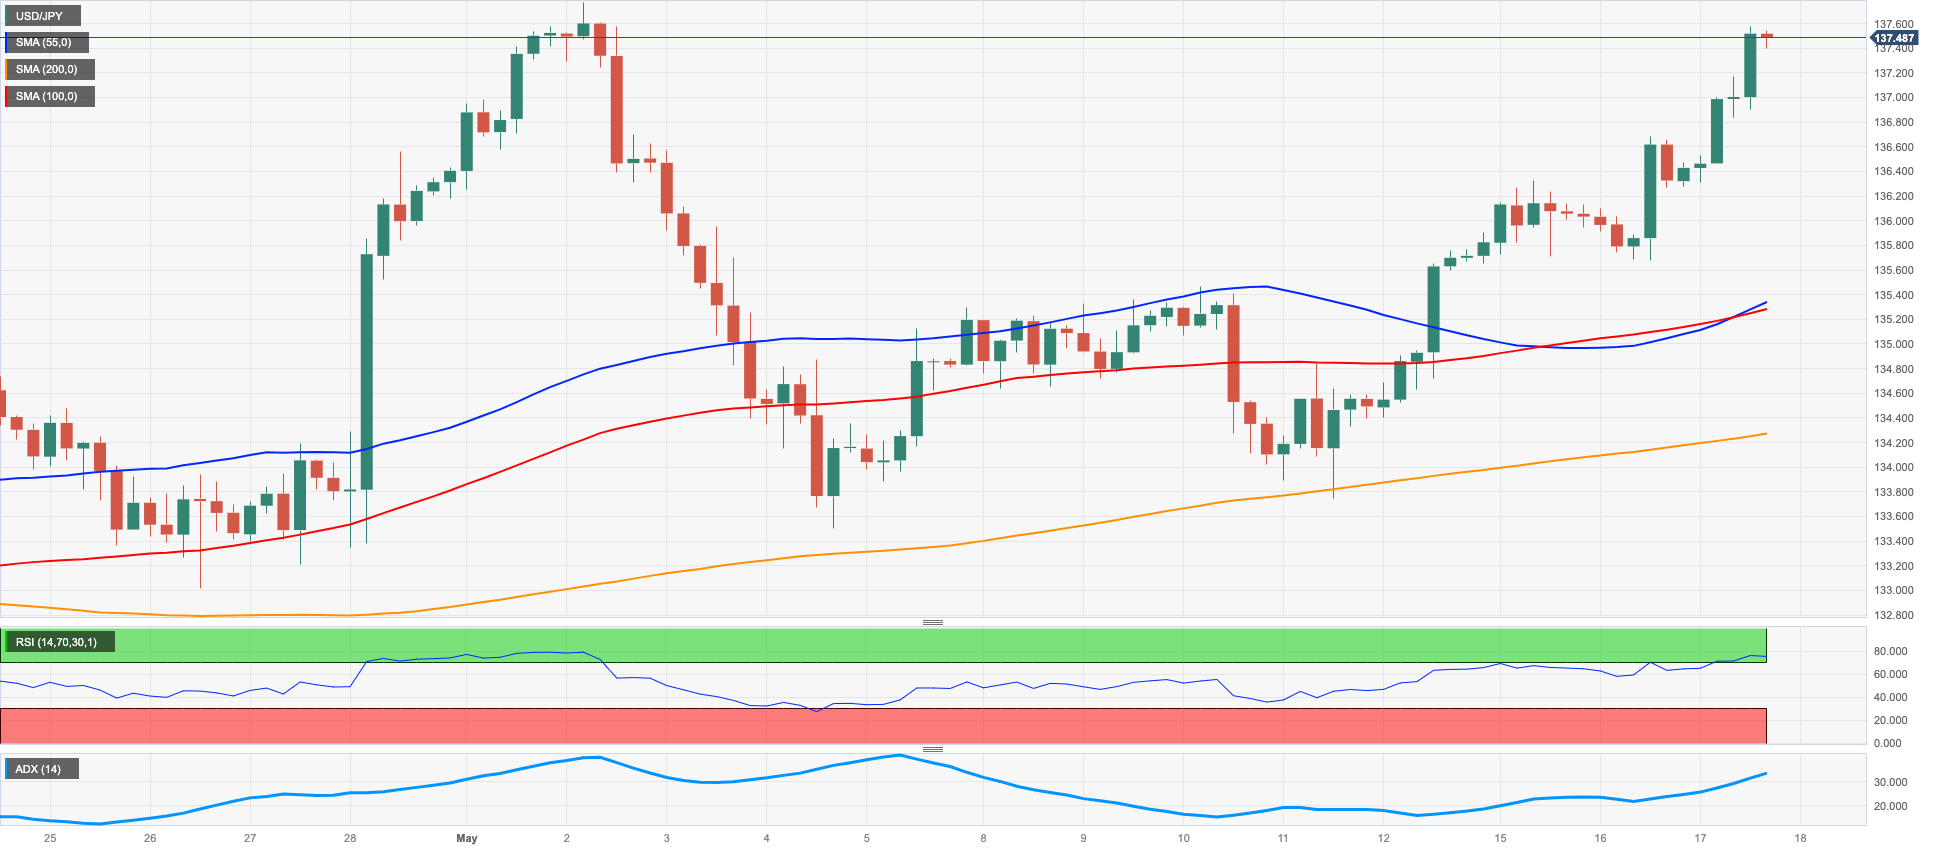
USDJPY
Further rebound in the greenback was enough to maintain the solid performance of USD/JPY for yet another session this week, now surpassing the key 137.00 the figure as well as the critical 200-day SMA on Wednesday.
The continuation of the uptrend in US yields also helped spot extending the upside bias, while the Japanese bond market showed extra demand for the JGB 10-year benchmark bonds, depressing their yields to the 0.37% area.
Data wise in Japan, auspicious flash GDP Growth Rate figures expect the economy to have expanded 0.4% QoQ in Q1 and 1.6% on an annualized view. On the not-so-bright side, final Industrial Production contracted 0.6% in the year to March and expanded 1.1% vs. the previous month.
The USD/JPY recovery now faces a hidden check level at the May high of 137.77 (May 2) ahead of the 2023 zenith of 137.91 (Walk 8). Accepting further gains are made, it is possible that the many weeks highs of 139.89 (November 30, 2022) and 142.25 (November 21, 2022) could be retested. The specific opposite, spot is supposed to test the step-by-step low of 133.01 (April 26) if bears recuperate the benefit. This dispute zone appears underpinned by the interim 100-day SMA at 132.98. Before the April low of 130.62 (April 5), the Mach 24 low of 129.63, and the February 8 low of 128.08, a minor struggle level of 132.01 appears. The following drawback target would be the absolute bottom of 2023 at 127.21 (January 16). The ordinary RSI rose further and flirted with the 65 area.
Resistance levels: 137.57 137.77 137.91 (4H chart)
Support levels: 135.64 134.19 133.74 (4H chart)
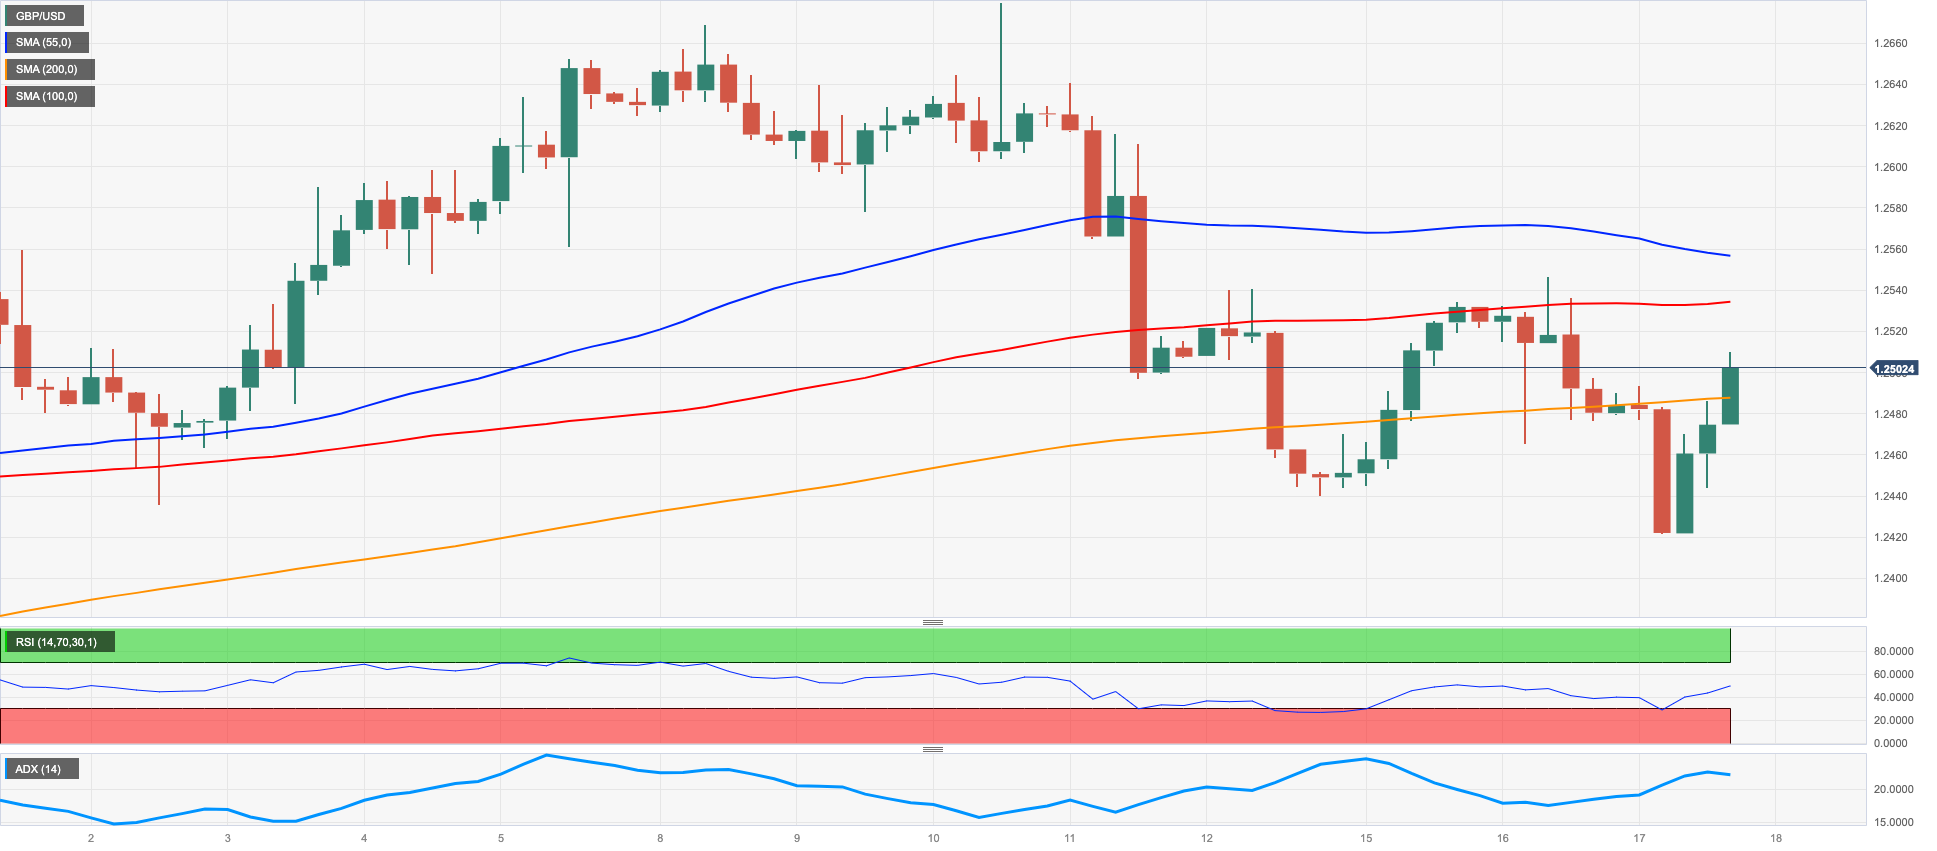
GBPUSD
The so far unabated recovery in the greenback pushed the USD Index (DXY) to fresh multi-week highs north of 103.00 the figure on Wednesday, while GBP/USD bounced off fresh monthly lows near 1.2420 and regained the 1.2500 hurdle around the closing bell in Wall St.
Indeed, the persevering risk aversion mood put the risk-associated complex under extra stress midweek against the backdrop of rising unease surrounding the US debt ceiling issue, forcing the pound and its risky peers to shed further ground.
From the BoE, Governor A. Bailey’s comment fell on the hawkish side after reiterating that in case of more persistent (price) pressures, the bank could further tighten its monetary policy, at the time when he acknowledged that inflation remains too elevated and showed some optimism regarding the current outlook. He also stressed that the labour market remains very tight and is cooling at a slower pace than anticipated. Furthermore, Baily hinted at the view that inflation is now expected to drop at a slower pace, while the outlook for UK consumer prices remains uncertain and largely hinges "on the extent of persistence in wage and price setting".
Extra weakness could prompt GBP/USD to find immediate support at the May low of 1.2421 (May 17), followed by the weekly low of 1.2344 (April 10), which appears reinforced by the proximity of the temporary 55-day SMA and comes ahead of the April low at 1.2274 (April 3). In the event that the pair continues to decline, it could potentially reach the critical 200-day SMA at 1.1963 before falling to the 2023 low of 1.1802 (March 8). On the flip side, initial up-barrier aligns at 2023 high of 1.2668 (May 8), with buyers also setting their sights on the 200-week line SMA at 1.2864, as well as the significant psychological level of 1.3000. The RSI on the daily chart climbed modestly above the 51 barrier.
Resistance levels: 1.2510 1.2546 1.2568 1.2679 (4H chart)
Support levels: 1.2421 1.2386 1.2367 (4H chart)
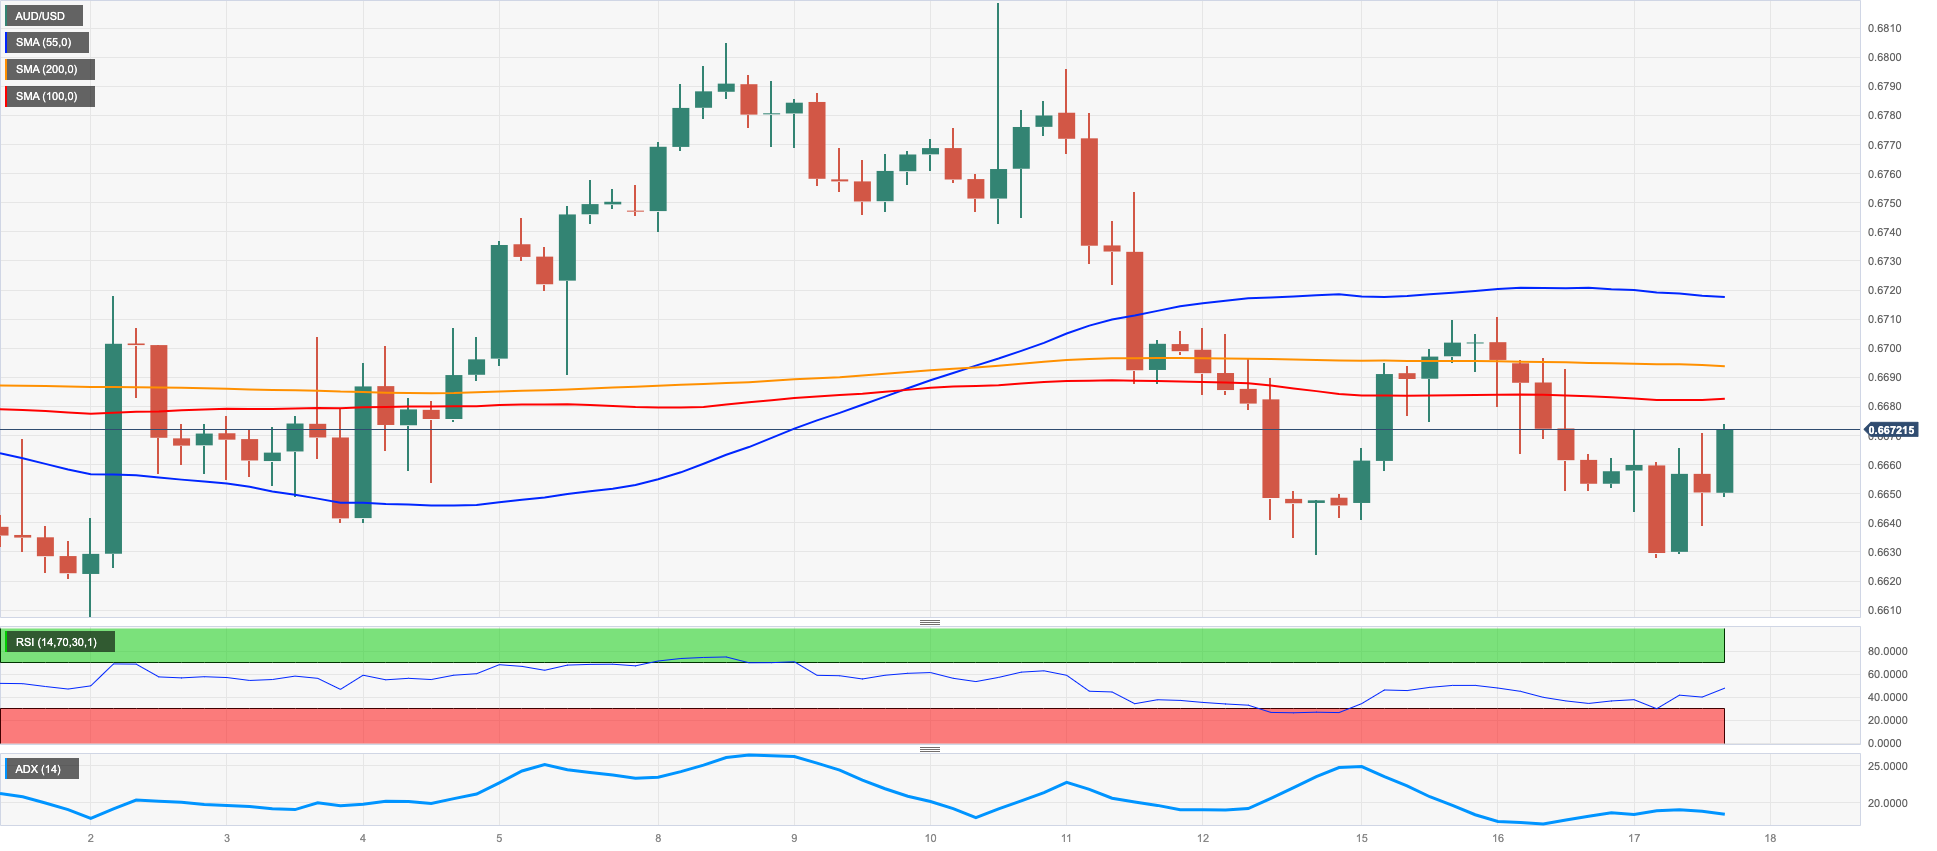
AUDUSD
AUD/USD partially reversed Tuesday’s marked retracement and printed decent gains after rebounding from weekly lows near 0.6630 on Wednesday.
Once again, the solid pace of the US dollar put the risk space and the high-beta currencies under extra pressure and sponsored the early drop to multi-session lows in the pair.
However, bullish moves in the commodity complex saw some recovery in copper prices and the iron ore and underpinned the daily recovery in the Aussie dollar along with alleviated unease around the US debt ceiling.
Data wise Down Under, Wage Price Index rose 0.8% QoQ in the January-March period and 3.7% over the last twelve months.
The immediate conflict area for AUD /USD is around the weekly low of 0.6636 (12 May). If weakness continues, this could lead to a decline towards the April low of 0.6573 (28 April), followed by the 2023 low of 0.6563 (10 March). In addition, the weekly lows at 0.6386 (10 November 2022) and the November 2022 low at 0.6272 (3 November) also represent potential support levels. On the other hand, the next significant resistance level to overcome is the May high of 0.6818 (10 May). Once this level is overcome, the key psychological level of 0.7000 becomes a plausible target, along with the weekly high of 0.7029 (14 February) and the 2023 high at 0.7157 (2 February). As for the technical indicators, the daily RSI improved past the 47 yardstick.
Resistance levels: 0.6694 0.6709 0.6818 (4H chart)
Support levels: 0.6628 0.6620 0.6573 (4H chart)
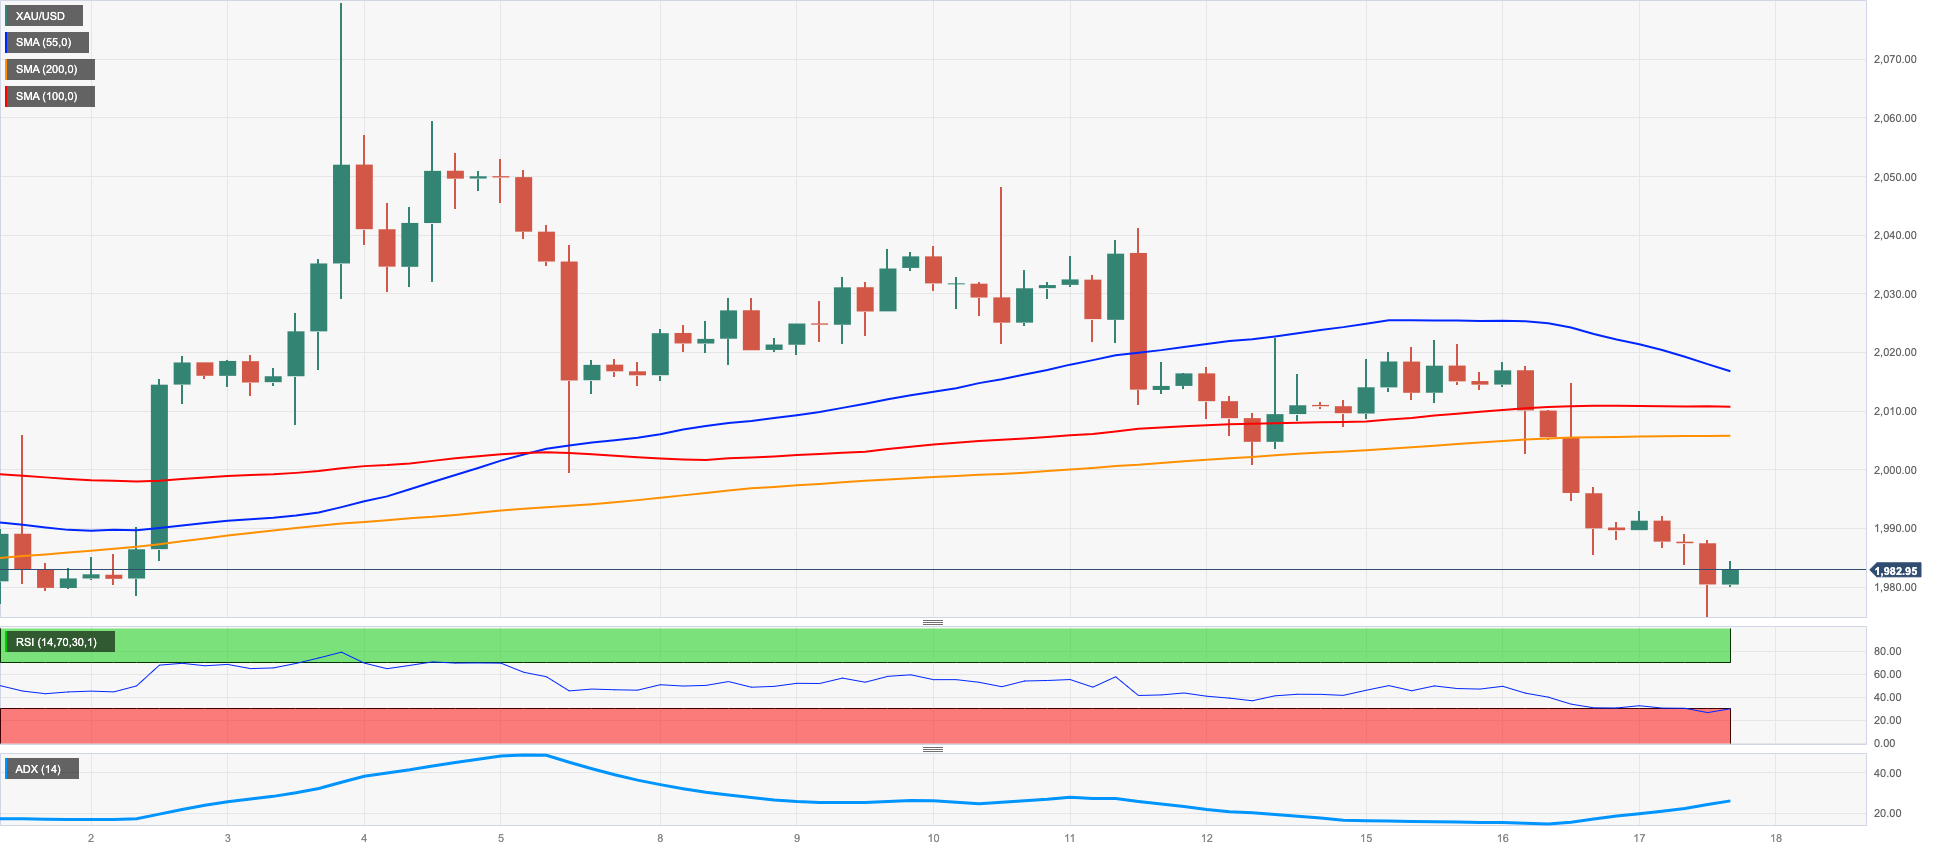
GOLD
The price of an ounce troy of gold accentuated the weekly correction and dropped to new 2-week lows below $1980 on Wednesday.
In fact, the so far unabated buying pressure in the greenback weighed on the precious metal after the USD Index (DXY) advanced to multi-week peaks north of the key 103.00 hurdle despite the mixed tone in US yields.
In the meantime, the generalized nervousness around the US debt ceiling issue should keep propping up the upside momentum in the buck to the detriment of the risk complex and the USD-denominated space for the time being.
Gold recently dropped below the significant $2000 mark, potentially leading to further declines in the near future. If the selling pressure intensifies, the metal could dip to its 2021 low of $1804 (February 28). To achieve this, it must break through the weekly low of $1969 (April 19), the April low of $1949 (April 3), and the 100-day SMA at $1925. Should the price increase, the primary obstacle will be the 2023 high of $2067 (May 4), followed by the March 2022 peak of $2070 (March 8) and the all-time top of $2075 (August 7, 2020).
Resistance levels: $2005 $2022 $2048 (4H chart)
Support levels: $1975 $1969 $1949 (4H chart)
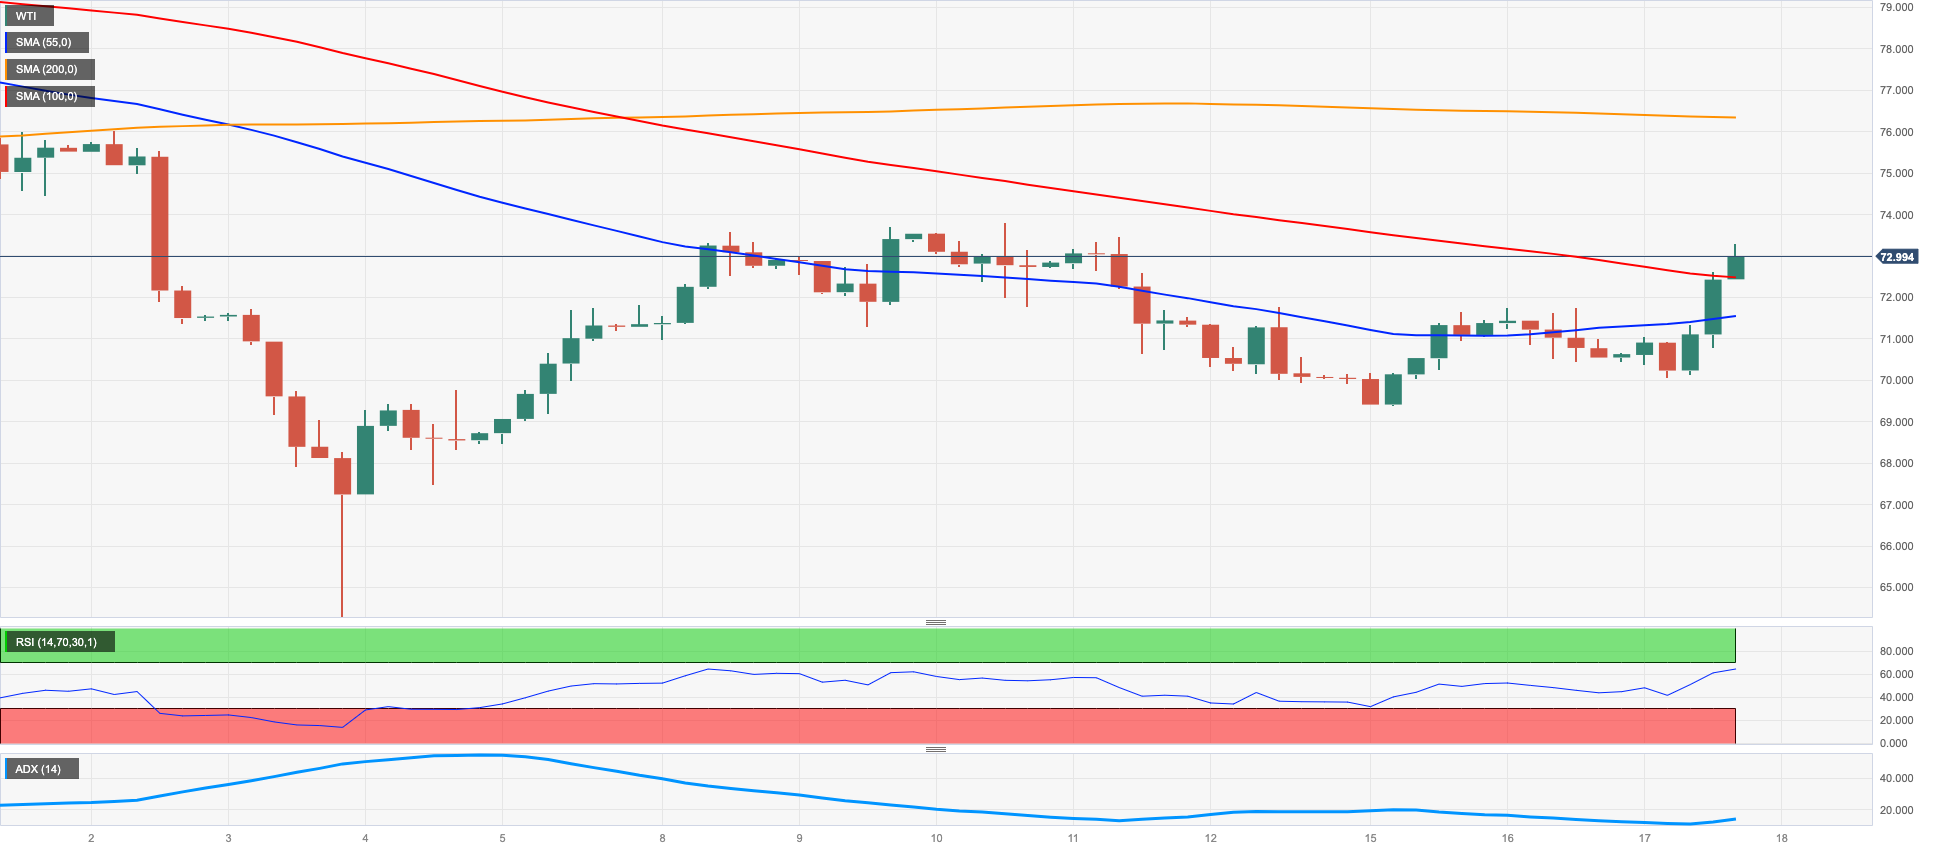
CRUDE WTI
Prices of the barrel of WTI managed to pick up strong pace and revisited the area just above the $73.00 mark on Wednesday, or 4-day highs.
In the meantime, traders’ sentiment continued to wobble around the expected uneven recovery in the Chinese post-pandemic economy vs. the IEA’s predicted tightness in the crude oil market in the second half of the year, while some optimism around the debt ceiling also provided some support to the commodity.
These factors helped WTI offset the intense move higher in the buck and another unexpected weekly build in crude oil supplies, as reported by the EIA on Wednesday.
On the latter, US crude oil inventories unexpectedly went up by 5.040M barrels in the week to May 12, while supplies at Cushing rose by 1.461M barrels, Weekly Distillate Stocks dropped by 0.080M barrels and gasoline stockpiles went down more than estimated by 1.381M barrels.
The performance of WTI prices has been volatile this week. On May 4th, WTI reached a new low for 2023 at $63.73 per barrel. If the December 2021 low of $62.46 (December 2) is broken, oil prices may fall further to the critical $60 level. Any potential gains may be limited, with the first obstacle likely to be encountered at the weekly high of $79.14 (April 24), followed by the key $80.00 level and the important 200-day SMA at $80.49. The 2023 peak of $83.49 (April 12) comes next, followed by the November 2022 high of $93.73 (November 7).
Resistance levels: $73.21 $73.83 $76.89 (4H chart)
Support levels: $70.01 $69.38 $63.61 (4H chart)
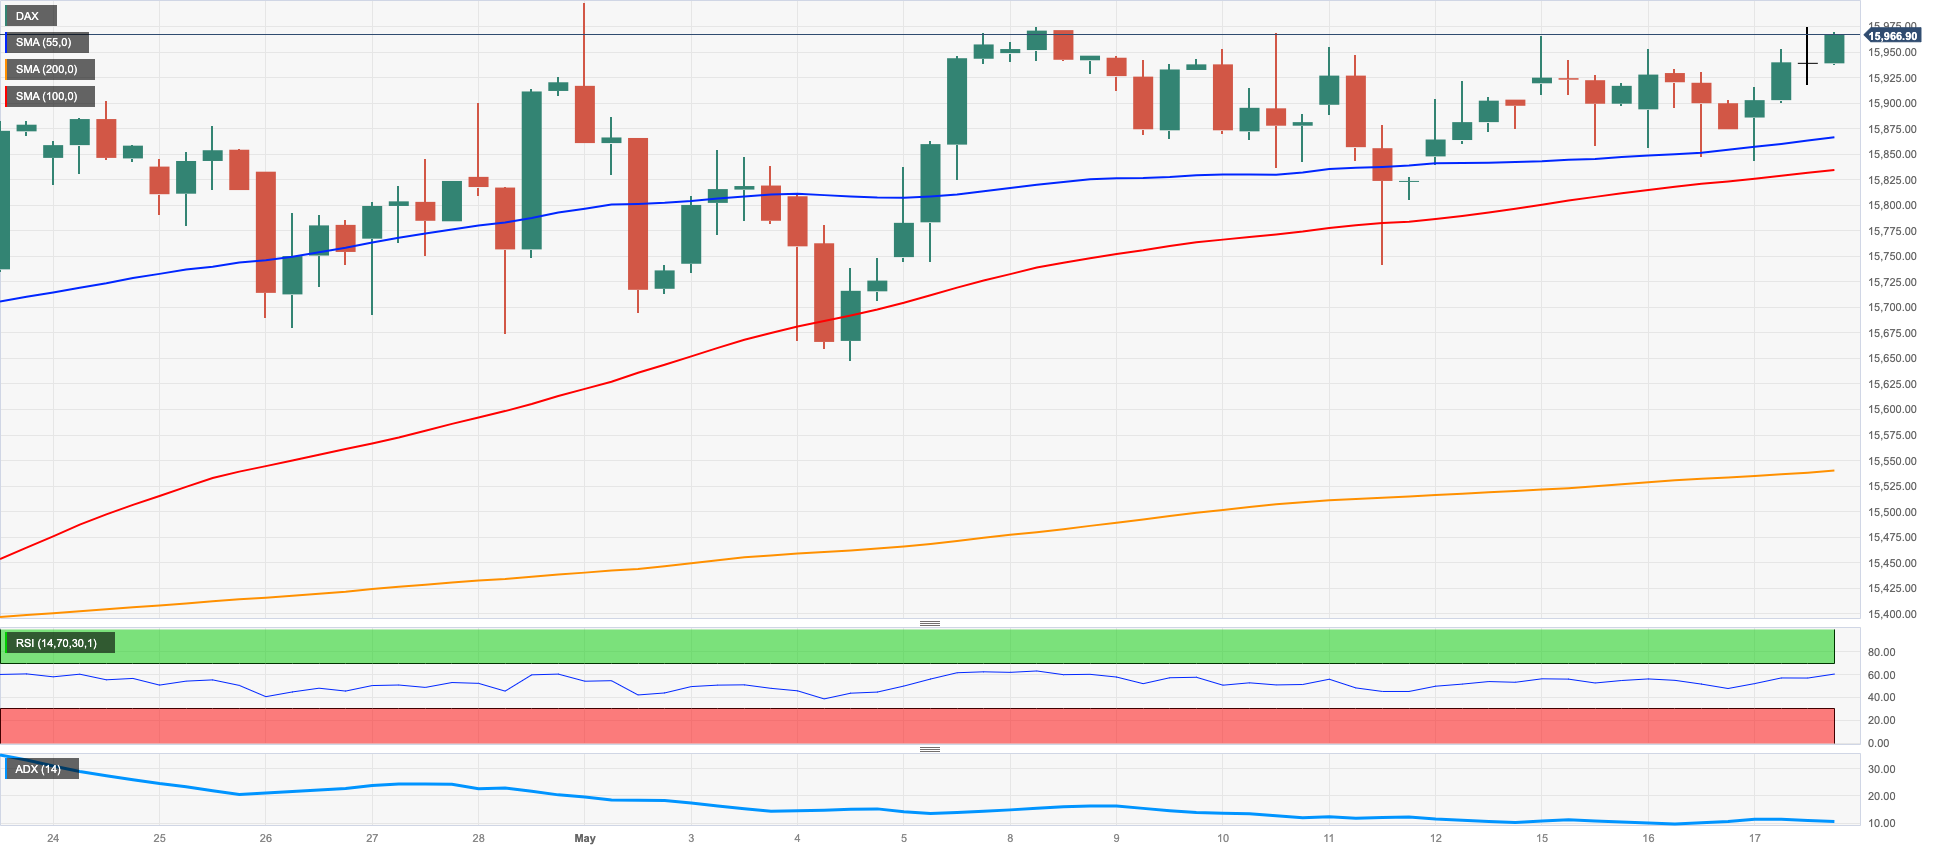
GER40
Germany's leading DAX40 index extended its multi-week consolidation phase, leaving behind Tuesday's inconclusive price action to end Wednesday with modest gains in the area just below the 16000 mark. The other European stock markets traded mixed.
The index managed to stay in positive territory despite a sharp setback at Commerzbank, despite better-than-expected first-quarter results. Surrounding the lender, its Chief Financial Officer (CFO), B. Orlopp, hinted at the likelihood that Germany could face a mild recession this year.
In the German bond market, 10-year Bunds yields continued their upward trend, rising in line with their US counterparts to the 2.35% range, due to reduced nervousness around the US debt ceiling.
On Tuesday, the DAX40 extended its current consolidation phase and its erratic performance. If the DAX40 rises above its record high of 16011 for the year so far (May 2), it may dispute the 2022 peak of 16285 (January 5). On the downside, the temporary 55-day SMA of 15564 ahead of the April low of 15482 (April 5) and the May low of 15662 (May 4) could serve as a next support levels. The following potential contention appears at the interim 100-day SMA of 15309 before minor support levels like 14809 (March 24) and 14458 (March 20), as well as the crucial 200-day SMA of 14343, may be crucial in a deeper retracement. The daily RSI edged higher past 58.
Best Performers: Siemens AG, Covestro, Airbus Group
Worst Performers: Commerzbank, Deutsche Boerse, Symrise AG
Resistance levels: 16011 16090 16285 (4H chart)
Support levels: 15754 15662 15530 (4H chart)
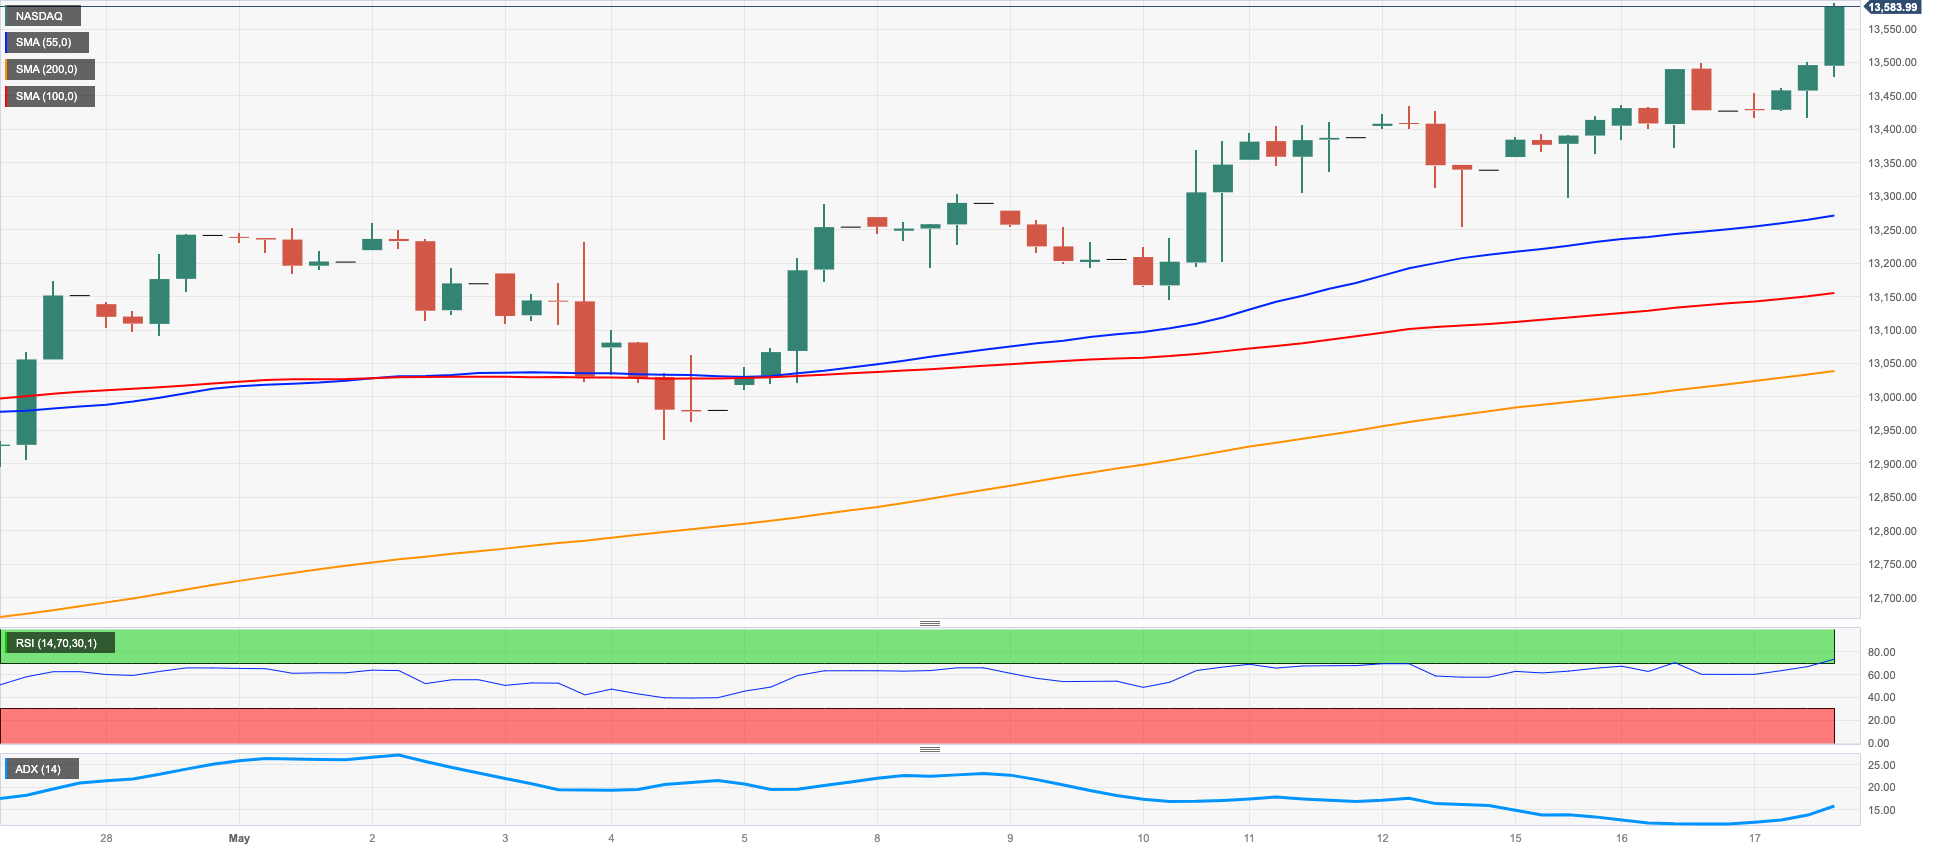
NASDAQ
Another day, another fresh 2023 high in the Nasdaq 100.
Indeed, the tech reference added to the weekly rebound and reached levels last traded back in mid-August 2022 past the 13500 level.
The firm performance of EV maker Tesla in combination with reinvigorated optimism around a potential solution to the debt ceiling deadlock, mitigating banking concerns and the late improvement in the risk-associated universe all collaborated with the move to fresh tops in the index.
The Nasdaq 100 marked a new 2023 high of 13554 on May 17. If the uptrend continues, the next target could be the March 2022 high at 15265 (March 29). Having said that, if the trend reverses and turns downwards, the May low of 12938 (May 4) offers initial support. This support is reinforced by the provisional 55-day SMA at 12835 and is further undercut by the April low of 12724 (April 25). If these contention areas are breached, the index could challenge the 200-day SMA at 12112, the March low of 11695 (March 13) and the weekly lows of 11550 (January 25) and 11251 (January 19). A further decline could threaten the 2023 low, which is at 10696 (January 6). The daily RSI crossed the 66 mark.
Top Gainers: Marvell, Tesla, Applied Materials
Top Losers: T-Mobile US, JD.com Inc Adr, Illumina
Resistance levels: 13540 13720 14277 (4H chart)
Support levels: 13128 12938 12724 (4H chart)
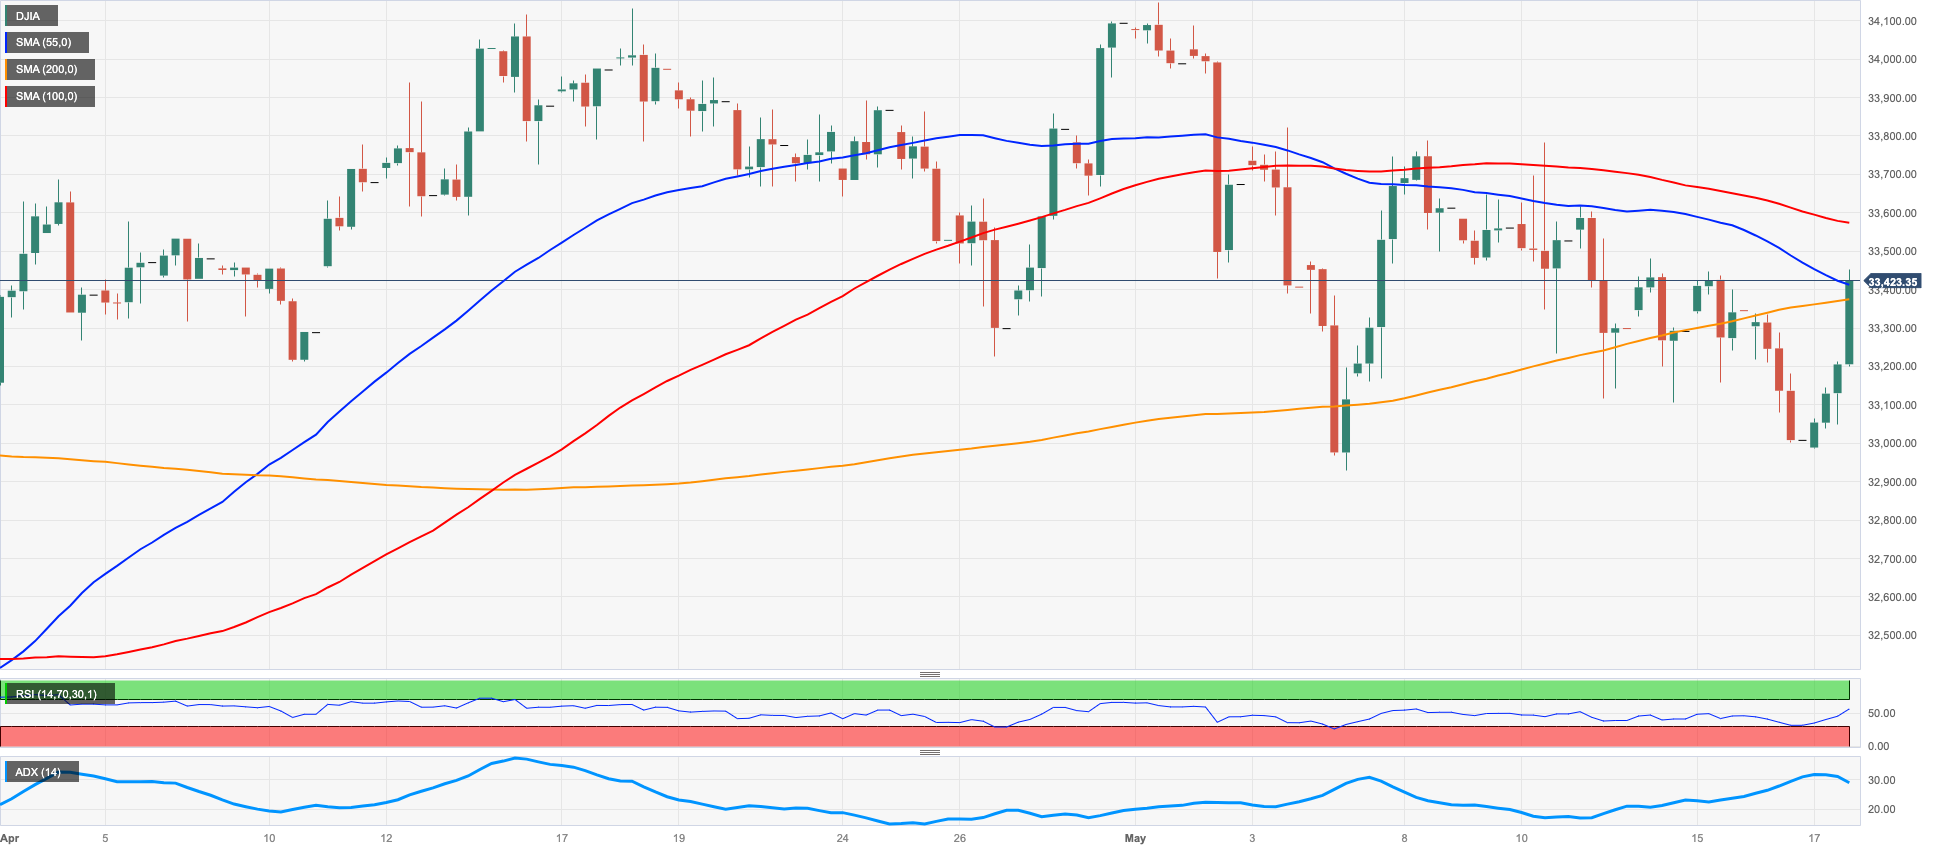
DOW JONES
US equities gauged by the three significant US stock lists recovered the grin and exchanged with checked gains on Wednesday.
Rising hopefulness over the likelihood that US policy makers could open the debt ceiling dealings in the near future got truly necessary help to financial backers, starting simultaneously an expansive recuperation in the risk complex and episodes of selling tension around bonds.
On the whole, the Dow Jones advanced 1.38% to 33467, the S&P500 rose 1.32% to 4163 and the tech-benchmark Nasdaq Composite gained 1.34% to 12508.
A more serious rebound should put the Dow Jones en route to the May peak of 34257 (May 1), followed by the 2023 high of 34342 (January 13) and the December 2022 peak of 34712 (December 13). If it surpasses this level, it may gain momentum towards the April 2022 high of 35492 (April 21). In the event of further decline, the index should meet initial support at the May low of 32937 (May 4), which is slightly above the important 200-day SMA of 32762. Further down emerges the 2023 bottom of 31429 (March 15) seconded by the 2022 low of 28660 (October 13). The daily RSI leapt to the boundaries of the 50 threshold.
Top Performers: Home Depot, Boeing, Caterpillar
Worst Performers: Merck&Co, Intel, Amgen
Resistance levels: 33441 33772 34257 (4H chart)
Support levels: 33006 32937 31805 (4H chart)
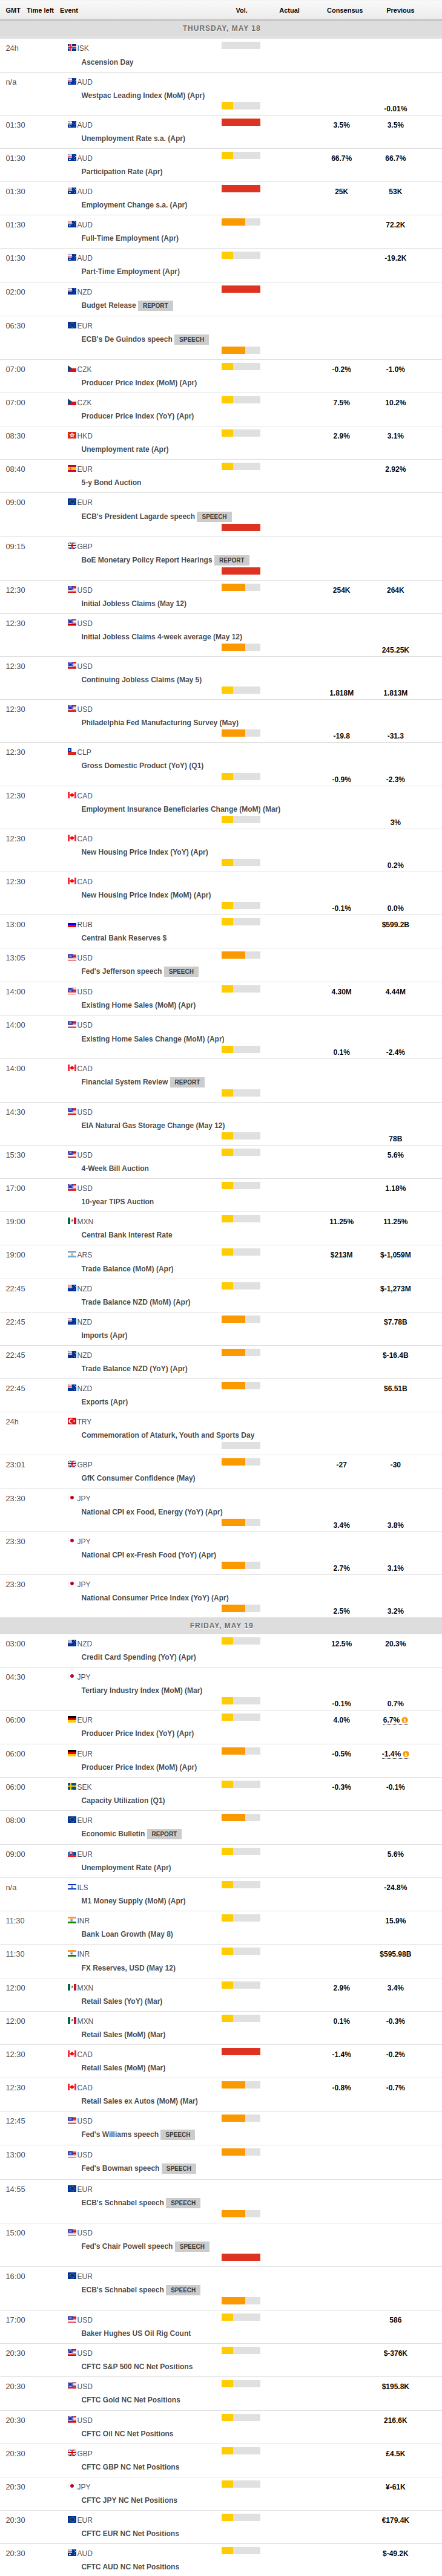
MACROECONOMIC EVENTS
All Information & Updates provided by:

All information relating to the financial markets available on this page has been prepared and issued by FXStreet (Forexstreet SL, Spain, Reg: B62498233) on the basis of publicly available information and all information believed to be reliable and does not conflict with Kuwaiti local laws, and all necessary care has been taken to before the company to ensure that the facts mentioned are correct from the source.
NCM Investment nor any of its directors or employees shall in any way be held responsible for the contents of this news, and the information contained on this page is intended only to provide clients with publicly available information and should not be construed as investment advice, report or analysis and/or constitute an offer or invitation to buy or sell financial instruments of any kind.
RISK WARNING: Forex and CFDs are highly risky leveraged products, as losses can exceed deposits. Please ensure you understand all the risks and take independent advice if necessary. NCM will segregate the clients based on the criteria of the regulator and its bylaws. NCM does not provide any advisory service; the material published does not constitute advice or a recommendation for a transaction in any financial instrument. NCM accepts no responsibility for any use of the content presented and any consequences of that use. Anyone acting on the information provided does so at their own risk.