
- Contact Us:
-

-

-

-


Daily Market Updates
19 May 2023
USDJPY
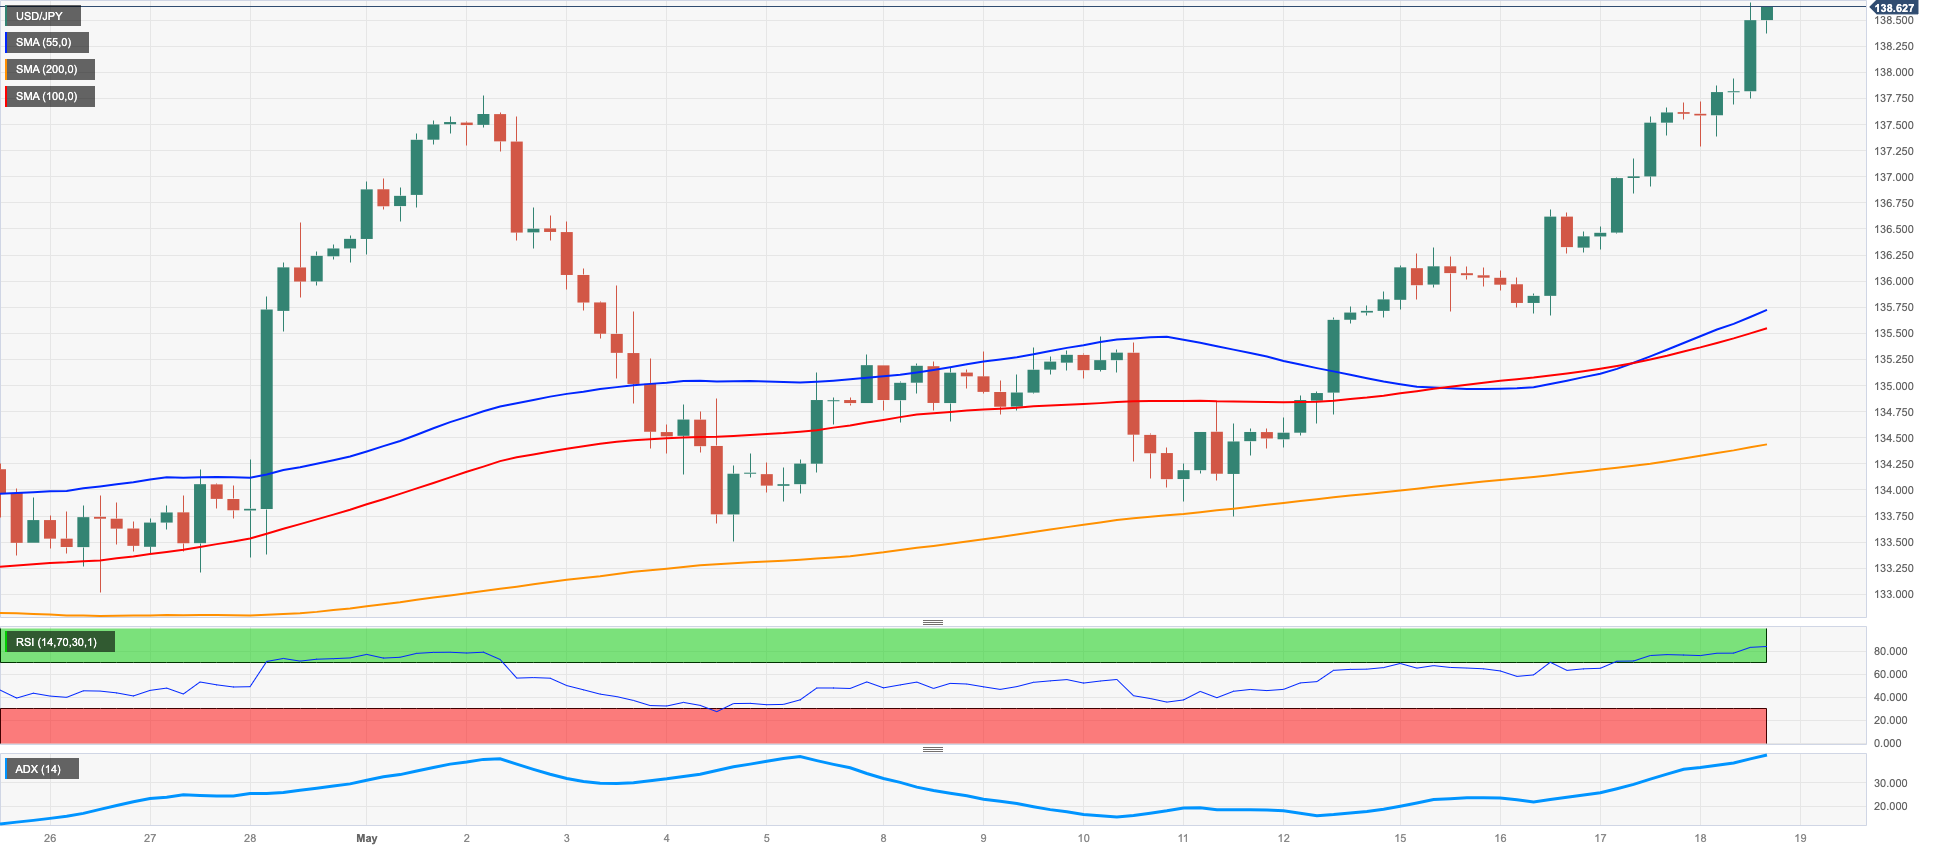
The intense rally in the greenback prompted an equally strong session in USD/JPY, this time pushing the pair past the 138.00 hurdle for the first time since late November 2022.
Indeed, the persistent upside bias in the dollar in combination with the multi-session advance in US yields across the curve underpinned the 6th consecutive day of gains in spot amidst optimism surrounding a probable deal over the debt ceiling and renewed doubts around a potential pause of the Fed’s hiking cycle in June.
No news from the domestic money market, where the JGB 10-year yields remained stuck around the 0.40% region for yet another day.
In the Japanese docket, the trade deficit shrank to ¥434.4B in April (Exports up 2.6% and Imports down 2.3%) and Foreign Bond Investment rose ¥1121.6B in the week to May 13.
USD/JPY printed a new 2023 high at 138.39 on May 18. Accepting additional gains, the previous weeks' highs of 139.89 (November 30, 2022) and 142.25 (November 21, 2022) might be retested. If bears recover the advantage, there is immediate contention at the key 200-day SMA at 137.07 prior to spot is expected to hit the weekly low of 133.01 (April 26). The temporary 100-day SMA looks to be supporting this support zone. A small struggle level of 132.01 (April 13) emerges before the April low of 130.62 (April 5), the Mach 24 low of 129.63, and the February 8 low of 128.08. The ultimate bottom of 2023 at 127.21 would be the next downside target. The daily RSI improved further and trespassed the 68 level.
Resistance levels: 138.68 139.89 141.61 (4H chart)
Support levels: 135.64 134.36 133.74 (4H chart)
GBPUSD
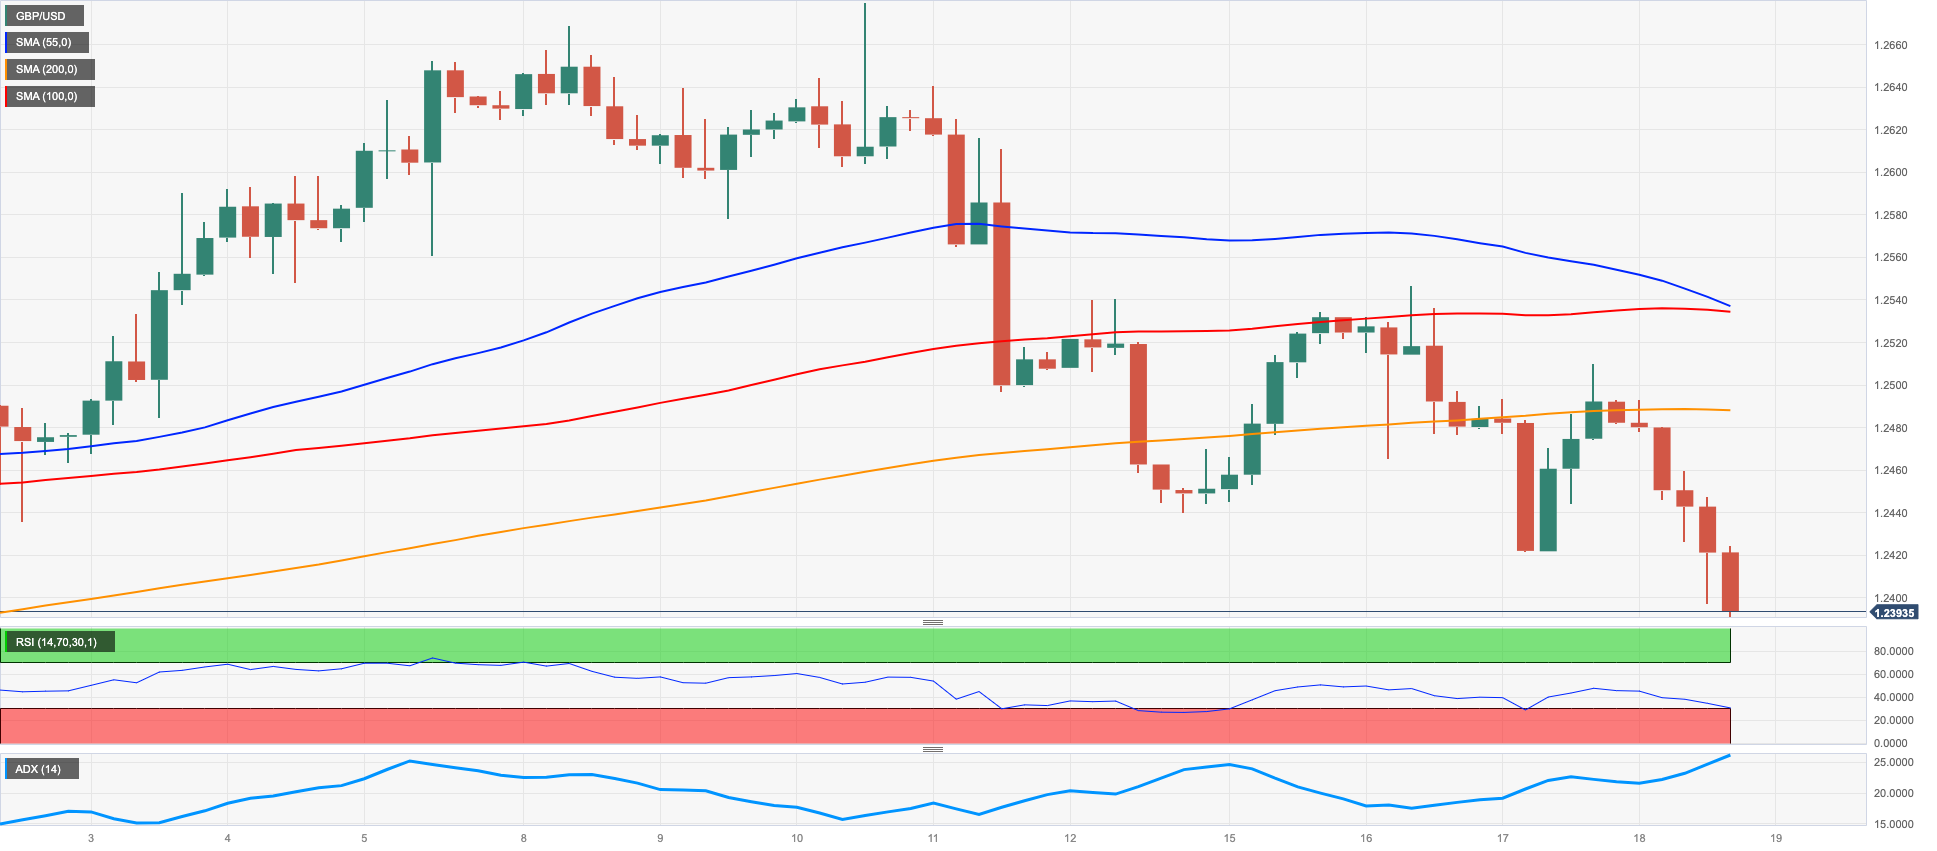
GBP/USD dropped for the third consecutive session and printed a new monthly low in the 1.2390 region on Thursday.
The renewed and marked weekly decline in Cable mirrored the strong bounce in the greenback, which lifted the USD Index (DXY) to new multi-week peaks near 103.60 during the NA trading hours.
There was no reaction in the British pound to the comments from BoE officials, after MPC member D. Ramsden argued that QT has a fairly small effect in the economy, at the time when he suggested that Gilts may still carry some risk from liquidity premium following liability-driven investment (LDI) funds issues during 2022.
Still around the BoE, Governor A. Bailey stated that the balance sheet is unlikely to return to its pre-financial crisis level, mentioning that the stock of reserves, which represents the highest form of bank liquidity, is a key factor. He emphasized the importance of banks holding larger cash reserves for the sake of financial stability. In addition, Bailey expressed the bank's intention to further reduce the size of the balance sheet to create room for potential future Quantitative Easing (QE) initiatives, if necessary.
There were no data releases scheduled in the UK calendar on Thursday.
A potential weakness in GBP/USD could lead to immediate support being found at the weekly low of 1.2344 (April 10) ahead of the April low at 1.2274 (April 3) and the interim 100-day SMA at 1.2264. The critical 200-day SMA at 1.1964 could potentially be reached if the pair continues to fall, followed by the 2023 low of 1.1802 (March 8). On the upside, the initial hurdle is set at the 2023 high of 1.2668 (May 8), with buyers also eyeing the 200-week line SMA at 1.2864 and the significant psychological level of 1.3000. The everyday RSI debilitated to the sub-44 region.
Resistance levels: 1.2510 1.2546 1.2568 1.2679 (4H chart)
Support levels: 1.2391 1.2386 1.2367 (4H chart)
AUDUSD
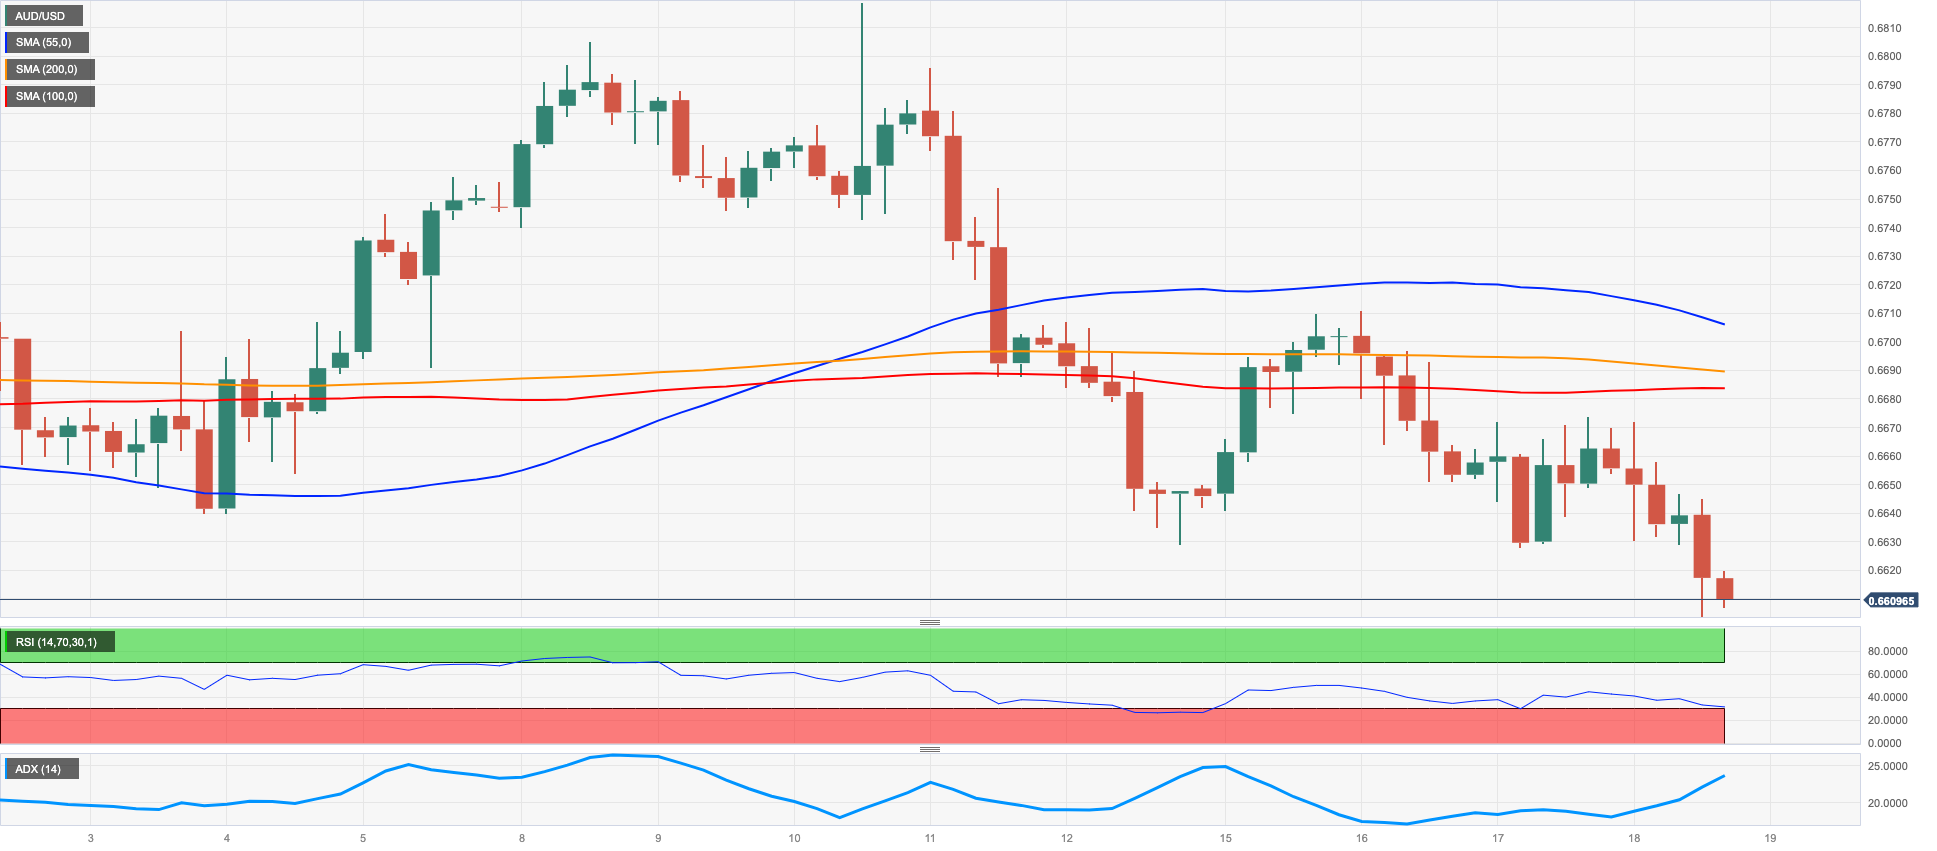
AUD/USD resumed the decline on Thursday and retreated to new monthly lows in the 0.6600 neighbourhood on the back of further strength in the greenback and increasing bearishness surrounding the risk space.
Also keeping the price action around the Aussie dollar depressed, the commodity complex traded mostly on the defensive, with copper prices giving away part of Wednesday’s bounce and iron ore advancing modestly.
Adding to the prevailing weakness in AUD, disheartening results from the Australian labour market in April saw the Unemployment Rate tick higher to 3.7% and the Employment Change drop by 4.3K people.
The quick struggle region for AUD/USD is now around the April low of 0.6573 (28 April), trailed by the 2023 low of 0.6563 (10 Walk). What's more, the weekly lows at 0.6386 (November 10 2022) and the November 2022 low at 0.6272 (November 3) additionally address potential help levels. Then again, the following critical obstruction level to defeat is the 200-day SMA at 0.6714 prior to the May high of 0.6818 (10 May). When this level is survived, the critical mental degree of 0.7000 turns into a conceivable objective, alongside the week-after-week top of 0.7029 (February 14) and the 2023 peak at 0.7157 (February 2). The day-to-day RSI deflated to the vicinity of 42.
Resistance levels: 0.6658 0.6693 0.6709 (4H chart)
Support levels: 0.6604 0.6573 0.6563 (4H chart)
GOLD
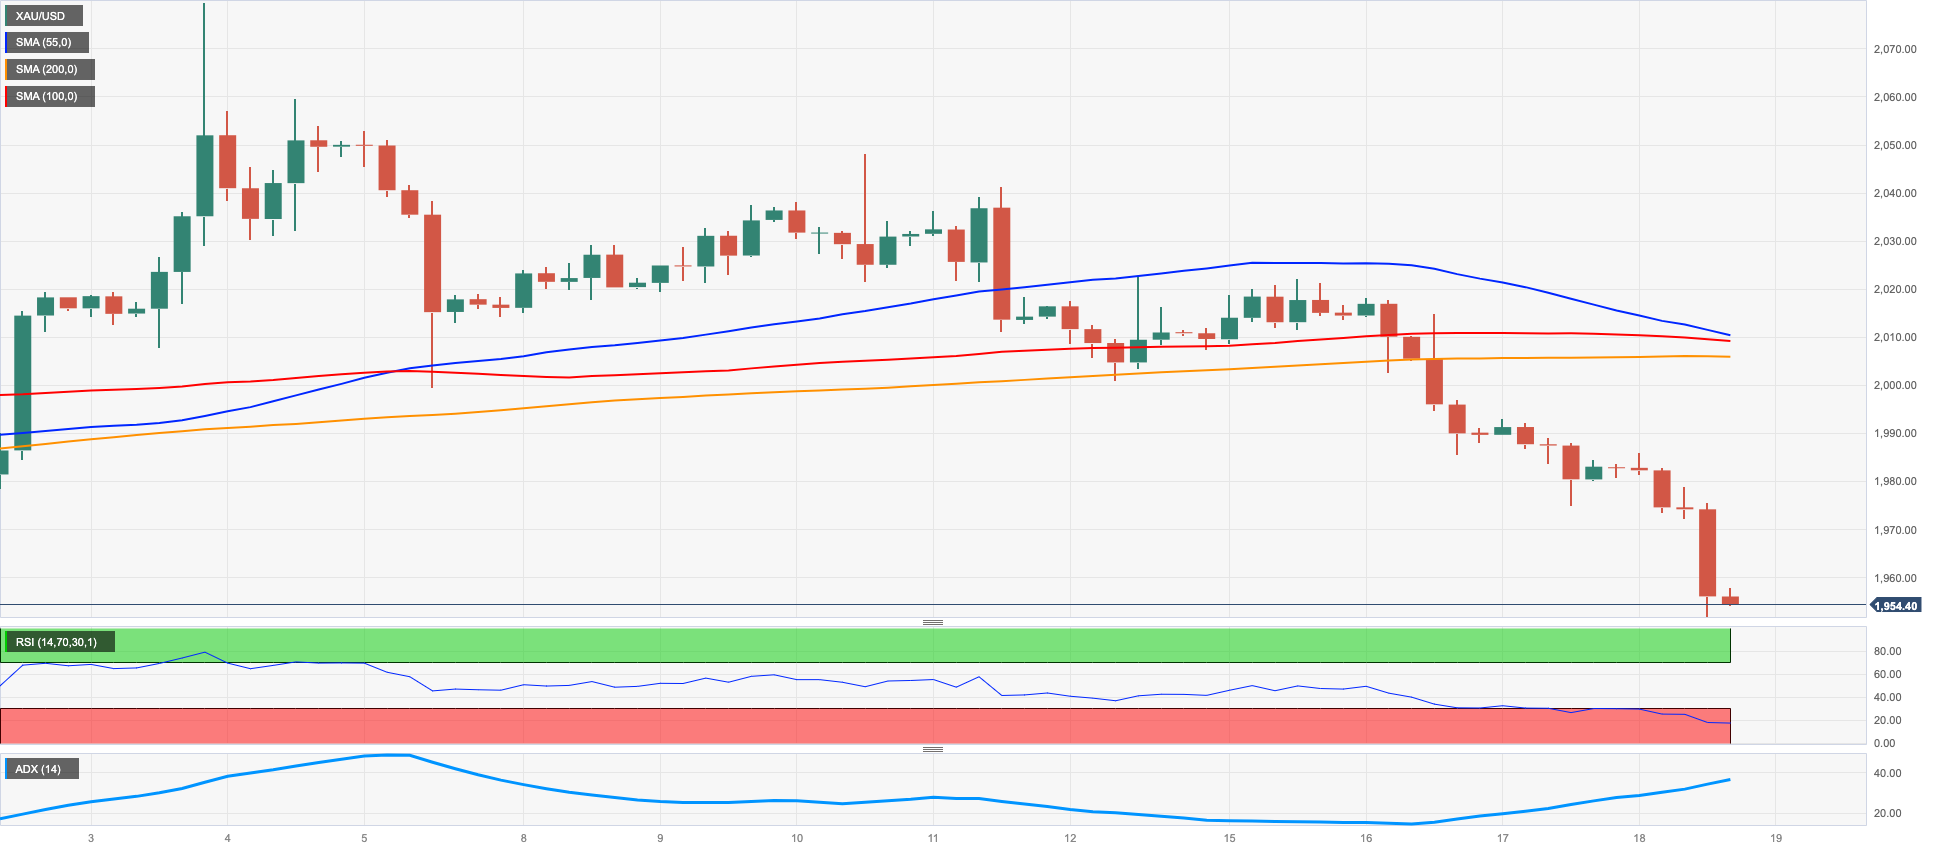
The weekly leg lower in prices of the ounce troy of gold gathered extra steam and flirted with the area of 2-month lows near $1950 on Thursday.
The sharp advance in the greenback in combination with another positive day in US yields across the curve played against any attempt of recovery in the yellow metal and kept the traders’ sentiment depressed for the third session in a row.
Diminishing speculation of a Fed’s potential pause in June particularly picked up pace in response to another bout of hawkish narrative from FOMC members and bolstered even further the multi-day recovery in the USD Index (DXY) well past the 103.00 mark.
Gold continues to build on the recent breakdown of the significant $2000 level, underpinning the notion that further losses are in store for the precious metal in the near future. If selling pressure intensifies, the metal could fall back to the April low of $1949 (April 3) prior to the 100-day line SMA at $1926 and the key 200-day SMA at $1824, all ahead of the 2021 low of $1804 (February 28). If it rises, there are no resistance levels of note until the 2023 top of $2067 (May 4), seconded by the March 2022 high of $2070 (March 8) and the all-time peak of $2075 (August 2020 7).
Resistance levels: $2005 $2022 $2048 (4H chart)
Support levels: $1952 $1934 $1885 (4H chart)
CRUDE WTI
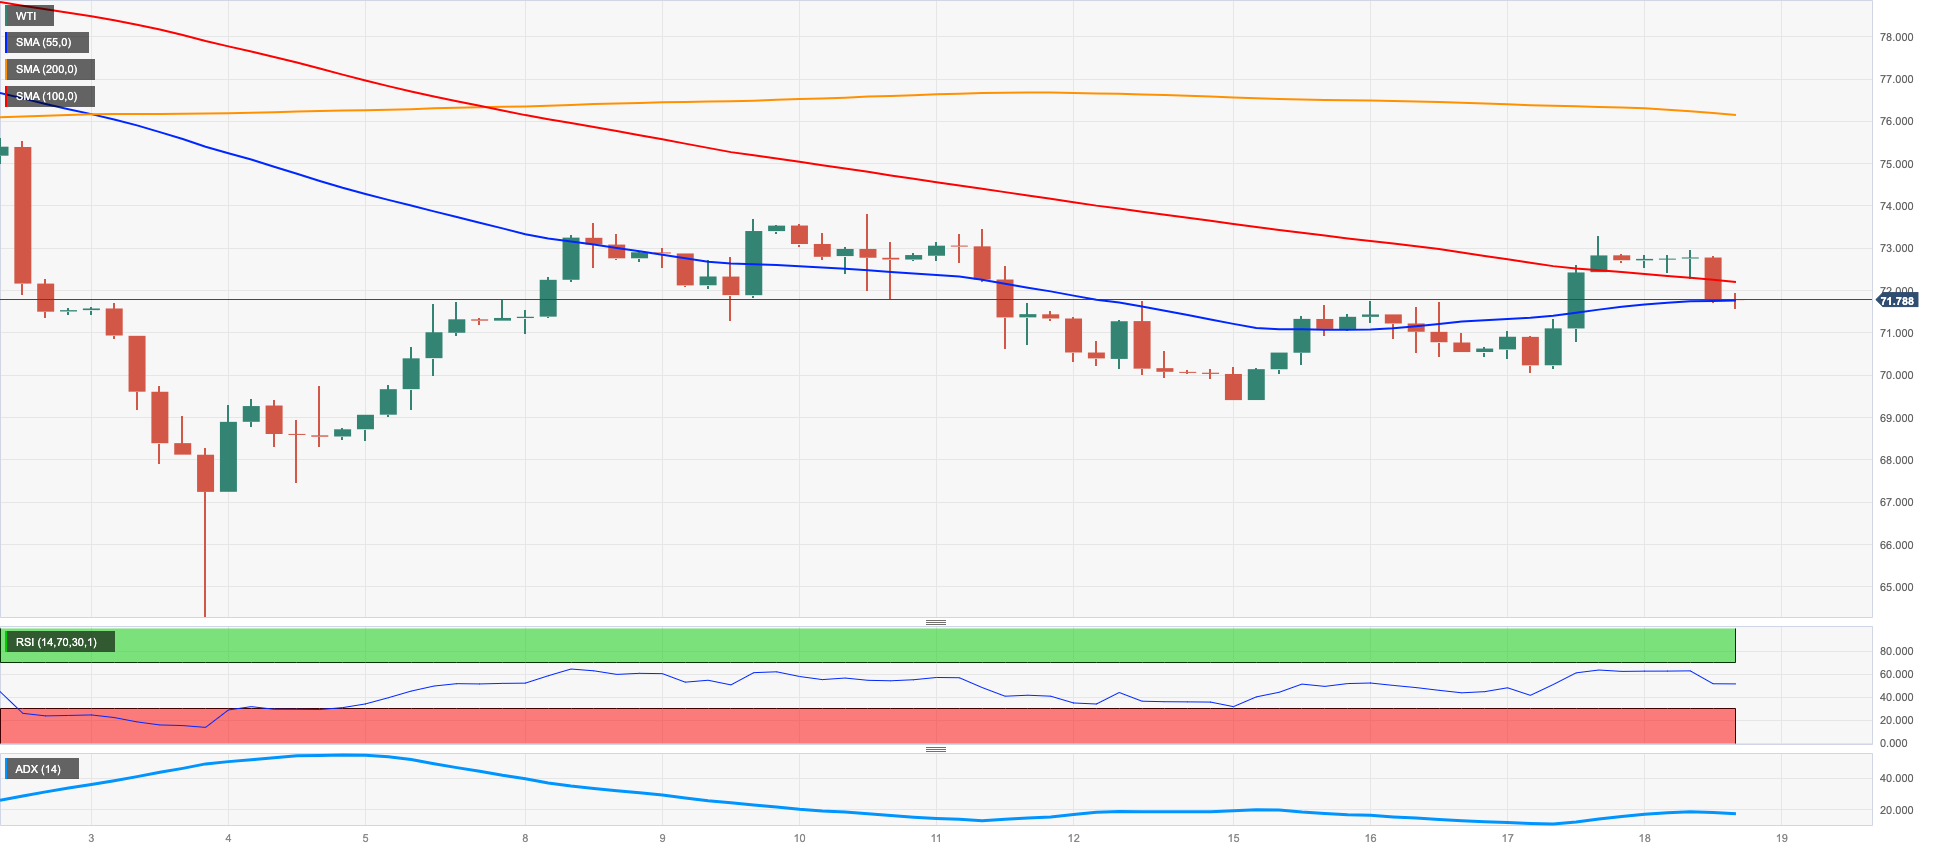
The intense advance in the greenback weighed on the USD-labelled assets for yet another session and this time sponsored a daily decline in prices of the barrel of the American reference for the sweet light crude oil to the $71.50 area.
In fact, auspicious as well as unexpected firm prints from the US docket on Thursday boosted the demand for the buck and motivated the WTI to set aside recent strength derived from potential Chinese recovery in H2 2023, persistent tight supply conditions in the market, and the recent announcement that the Biden administration will start topping up the SPR.
This week has seen a lot of volatility in the performance of WTI prices. On May 4th, the price of WTI hit its lowest point for the year 2023, reaching $63.73 per barrel. If the price falls below the December 2021 low of $62.46 (December 2), it could signal a further drop to the critical level of $60. However, any potential gains may be limited, as there are several obstacles that could prevent the price from rising significantly. The first obstacle is likely to be encountered at the weekly high of $79.14 (April 24), followed by the key level of $80.00, and the important 200-day SMA at $80.41. The next levels of resistance are the 2023 peak of $83.49 (April 12) and the November 2022 high of $93.73 (November 7).
Resistance levels: $73.21 $73.83 $76.89 (4H chart)
Support levels: $70.01 $69.38 $63.61 (4H chart)
GER40
European stocks moved higher following the positive session in Wall Street in the previous day, as optimism picked up pace around a possible leap forward in conversations to clinch a deal around the US debt ceiling before cash safes dry up around June 1.
The daily uptick in stocks was also accompanied by a strong advance in the German 10-year bund yields, up for the 5th day in a row and revisiting the 2.45% region.
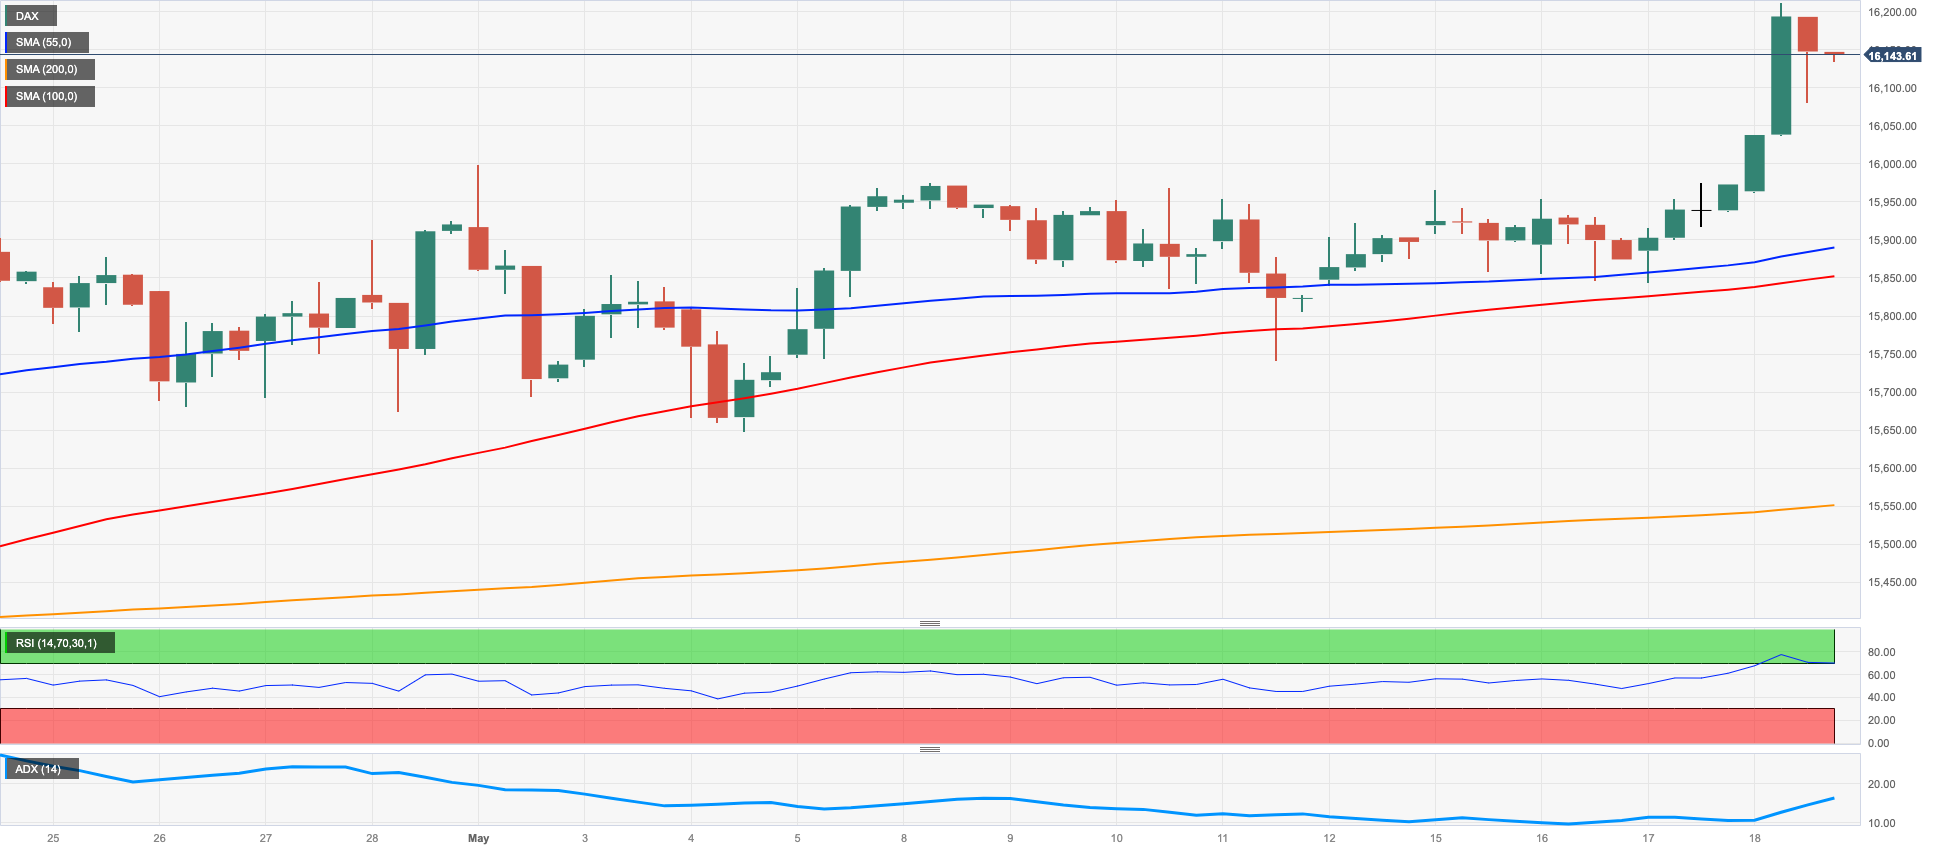
On Thursday, the DAX40 broke above the multi-week consolidative range and clocked a new 2023 high at 16230. its ongoing combination stage and its sporadic presentation. Assuming further gains, the index might debate the 2022 pinnacle of 16285 (January 5) just ahead of the all-time top at 16290 (November 18 2021). On the drawback, the immediate support comes at the May low at 15662 (May 4) ahead of the transitory 55-day SMA of 15578 in front of the April low of 15482 (April 5). South from here comes the provisional 100-day SMA of 15331 preceding minor help levels like 14809 (March 24) and 14458 (March 20), as well as the essential 200-day SMA of 14356, might be vital in a more profound retracement. The everyday RSI climbed past the 66 hurdle.
Best Performers: Commerzbank, Porsche, Infineon
Worst Performers: E.ON SE, Vonovia, Fresenius SE
Resistance levels: 16230 16285 16290 (4H chart)
Support levels: 15754 15662 15548 (4H chart)
NASDAQ
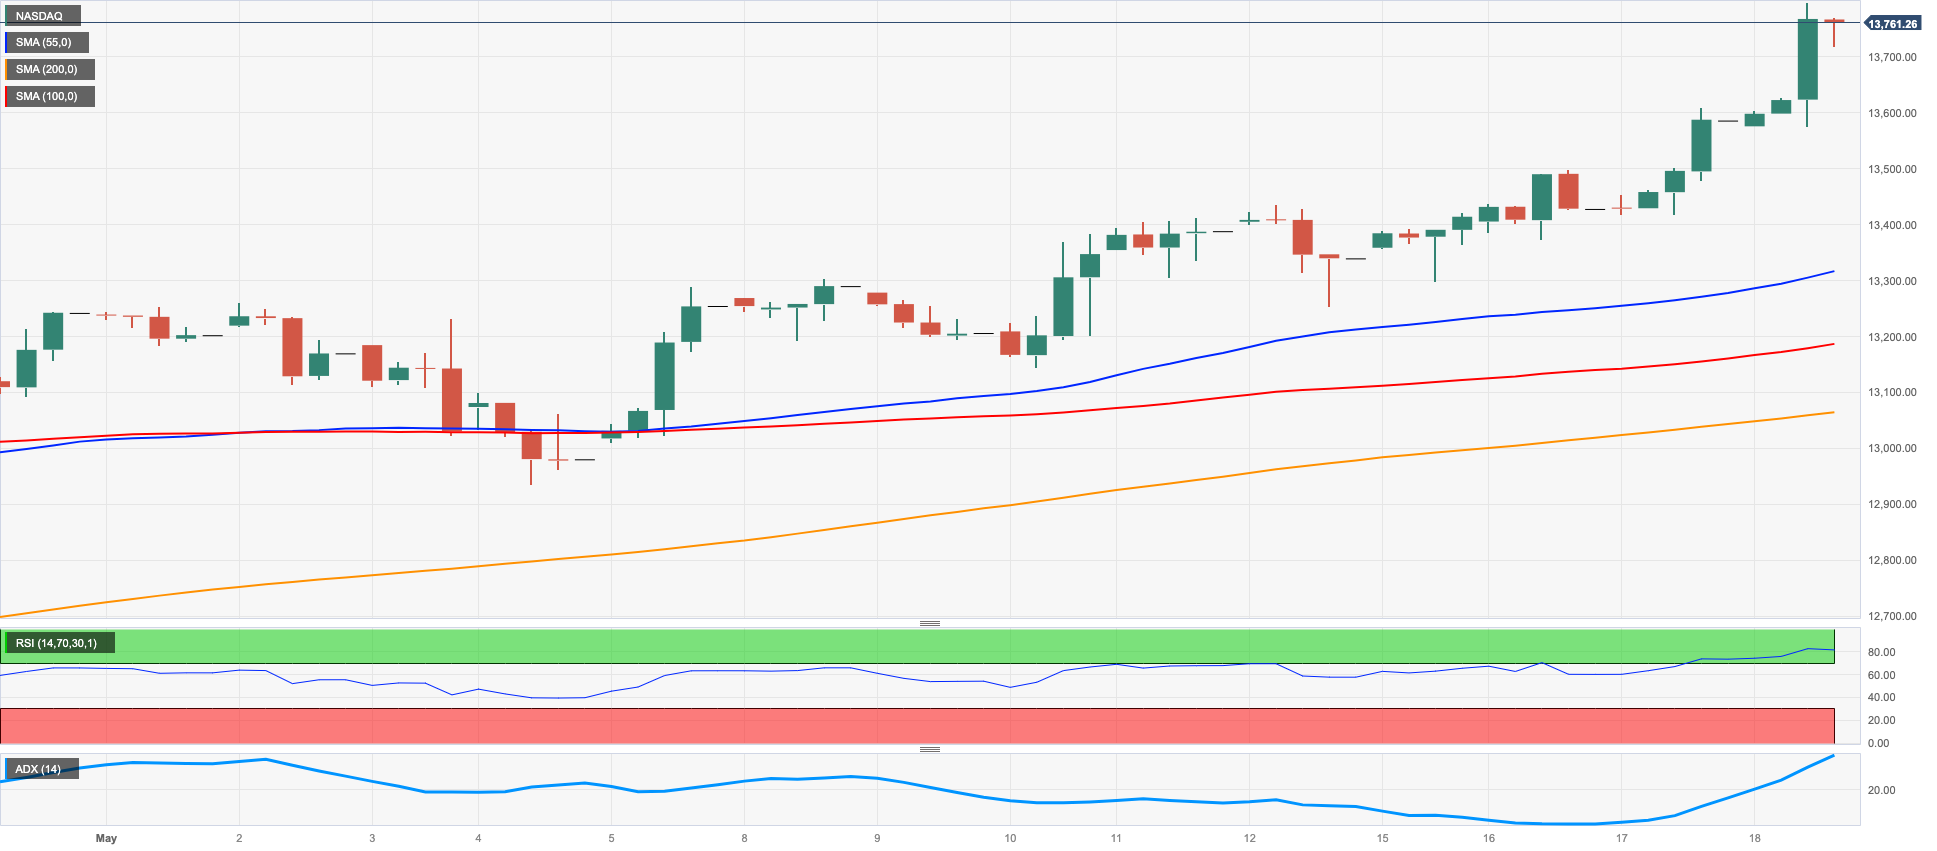
The US tech heavy Nasdaq 100 rose to new 2023 highs around the 13800 region for the first time since late April 2022 on Thursday.
Optimism over a potential agreement between policy makers to leave behind the debt ceiling issue in the relatively short-term horizon continued to boost the appetite for tech equities despite the strong dollar and rising US yields.
Further support for the benchmark index came from solid daily gains in megacaps Nvidia, Apple and Microsoft.
The Nasdaq 100 marked a new 2023 top of 13800 on May 18. If the uptrend continues, the next target could be the March 2022 high at 15265 (March 29). On the other hand, if the trend reverses and turns downwards, the May low of 12938 (May 4) offers initial support. This support is reinforced by the temporary 55-day SMA at 12868 and is further undercut by the April low of 12724 (April 25). If these contention areas are breached, the index could challenge the 200-day SMA at 12116 seconded by the March low of 11695 (March 13) and the weekly lows of 11550 (January 25) and 11251 (January 19). A further decline could threaten the 2023 low at 10696 (January 6). The daily RSI entered the overbought region past 70.
Top Gainers: Netflix, Synopsys, Copart
Top Losers: PDD Holdings DRC, JD.com Inc Adr, T-Mobile US
Resistance levels: 13800 14277 15161 (4H chart)
Support levels: 13152 12938 12724 (4H chart)
DOW JONES
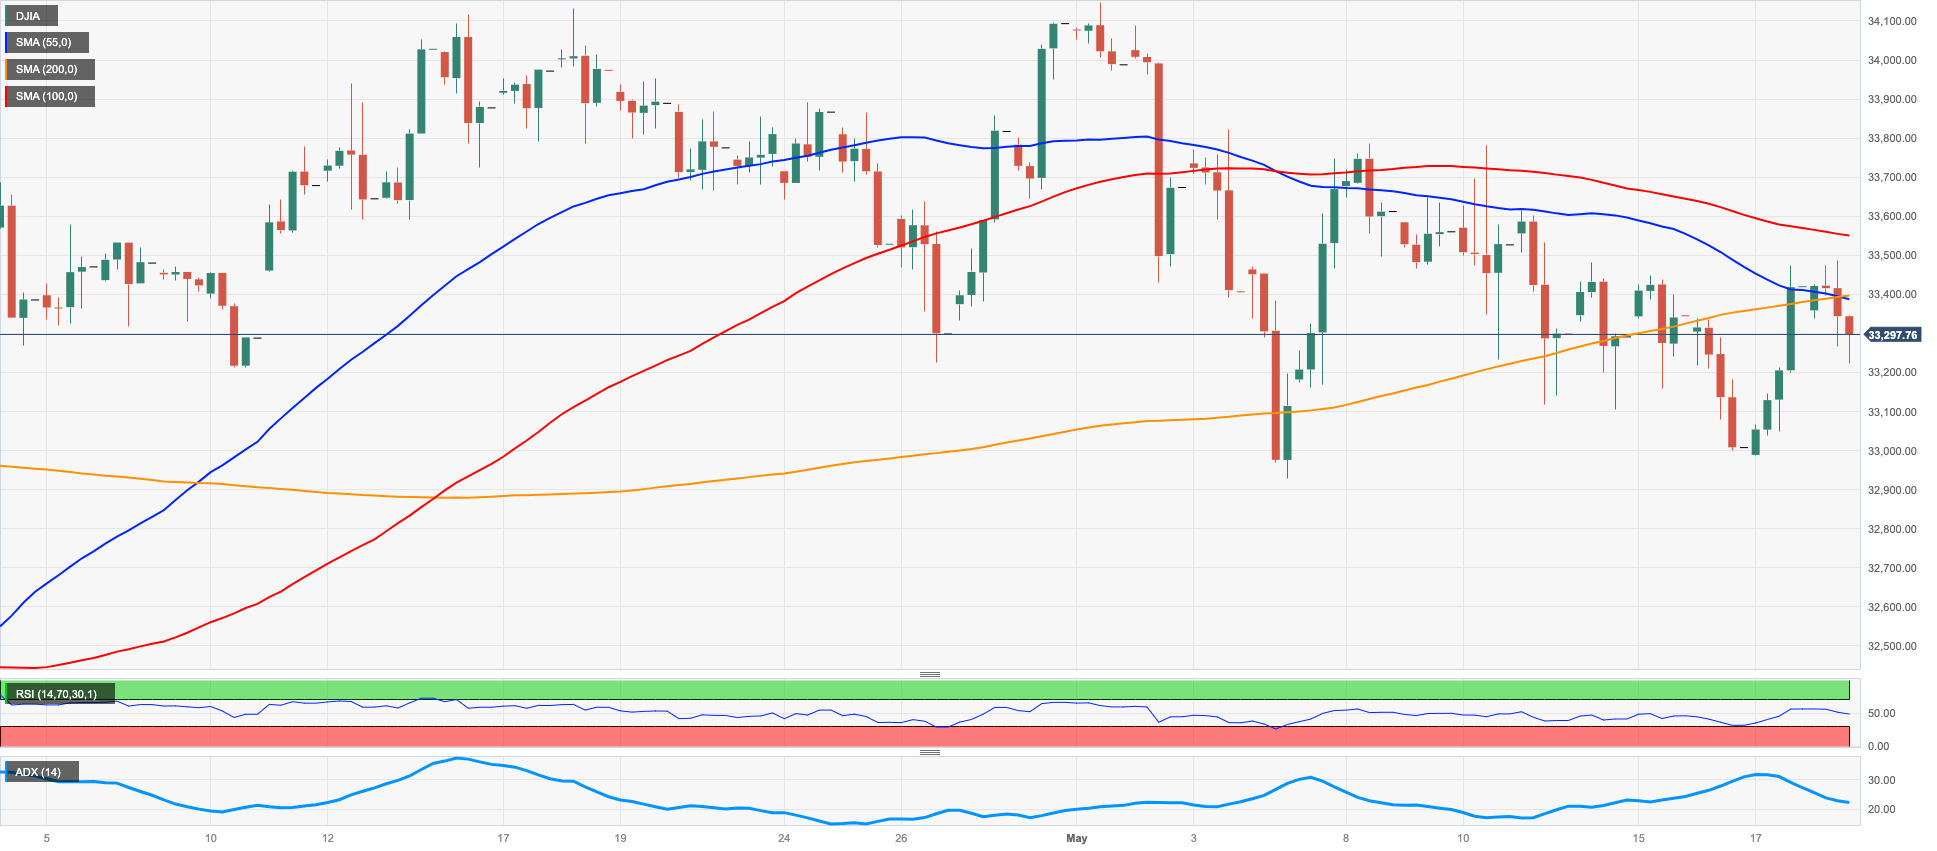
Equities measured by the Dow Jones reversed Wednesday’s strong advance and returned to the 33200 region on the back of lingering concerns over the debt ceiling and the persistent move higher in the greenback.
The daily pullback, however, came in contrast to decent gains from the S&P500 and the tech-reference Nasdaq Composite and practically ignored the auspicious news from giant Walmart.
In addition, stronger-than-expected results from the US calendar (weekly Claims and the Philly Fed index) reignited speculation that the Fed might not pause its tightening cycle in June eventually.
The latter view has also been reinforced by Dallas Fed L. Logan (voter, hawk) who suggested that current data from fundamentals does not justify an impasse in the normalization process.
All in all, the Dow Jones deflated 0.48% to 33261, the S&P500 advanced 0.29% to 4170 and the tech-heavy Nasdaq Composite rose 0.93% to 12617.
A more substantial rebound in the Dow Jones could potentially lead it towards various key peaks. Firstly, the May peak of 34257 (May 1), followed by the 2023 high of 34342 (January 13), and the December 2022 top of 34712 (December 13). If the index manages to surpass this level, it may gather further momentum towards the April 2022 high of 35492 (April 21). Just the opposite, in the event of a continued decline, initial support is expected at the May low of 32937 (May 4), which is slightly above the important 200-day SMA of 32766. Further downward, we encounter the 2023 bottom of 31429 (March 15), followed by the 2022 low of 28660 (October 13). The day-by-day RSI dropped to the sub-47 zone.
Top Performers: Intel, Salesforce Inc, Apple
Worst Performers: Procter&Gamble, UnitedHealth, Walgreen Boots
Resistance levels: 33492 33772 34257 (4H chart)
Support levels: 33006 32937 31805 (4H chart)
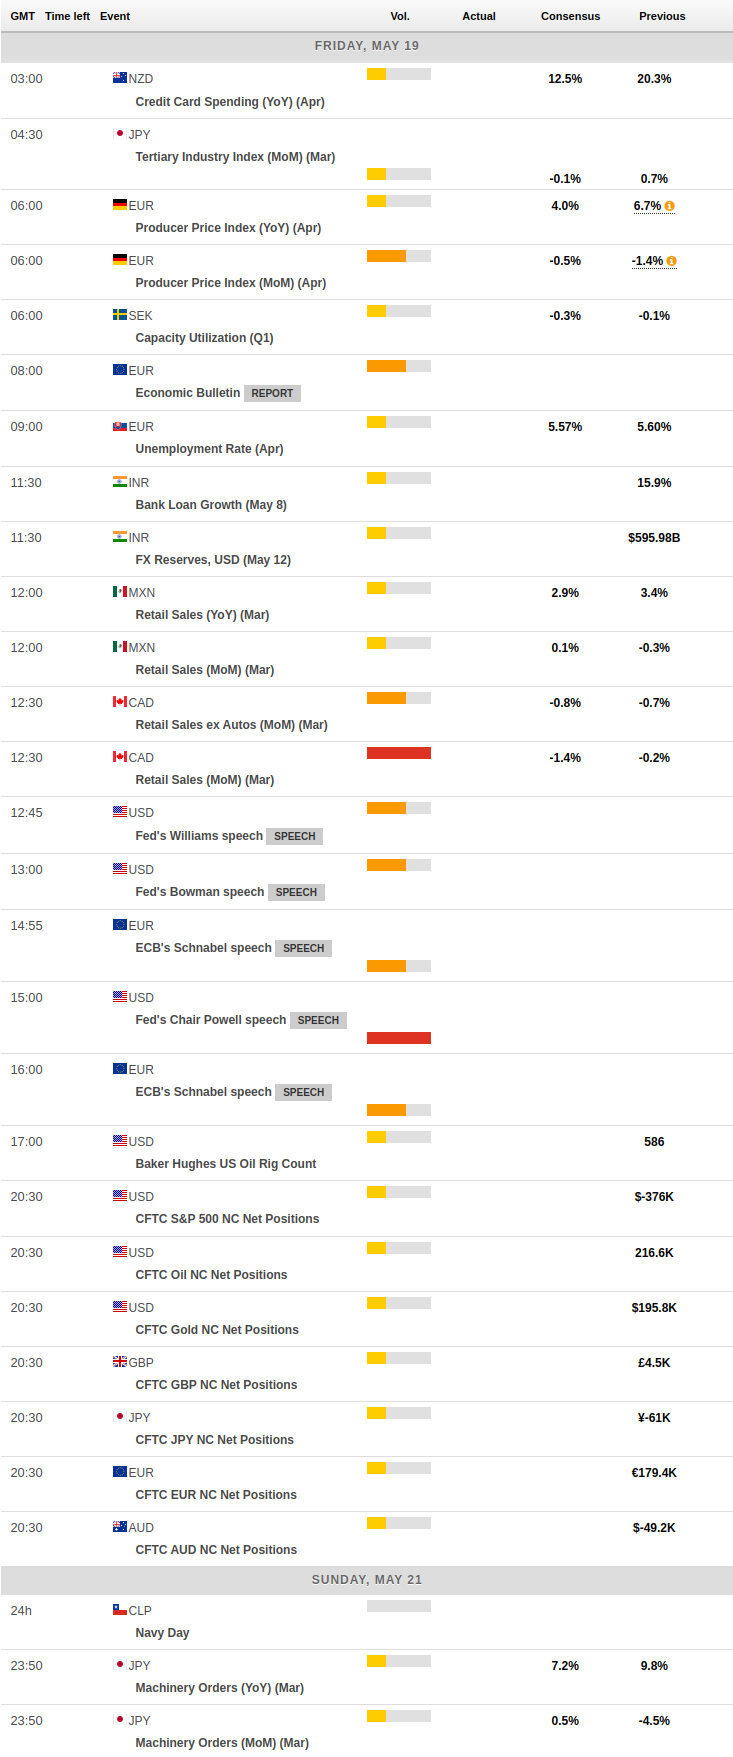
MACROECONOMIC EVENTS
All Information & Updates provided by:

All information relating to the financial markets available on this page has been prepared and issued by FXStreet (Forexstreet SL, Spain, Reg: B62498233) on the basis of publicly available information and all information believed to be reliable and does not conflict with Kuwaiti local laws, and all necessary care has been taken to before the company to ensure that the facts mentioned are correct from the source.
NCM Investment nor any of its directors or employees shall in any way be held responsible for the contents of this news, and the information contained on this page is intended only to provide clients with publicly available information and should not be construed as investment advice, report or analysis and/or constitute an offer or invitation to buy or sell financial instruments of any kind.
RISK WARNING: Forex and CFDs are highly risky leveraged products, as losses can exceed deposits. Please ensure you understand all the risks and take independent advice if necessary. NCM will segregate the clients based on the criteria of the regulator and its bylaws. NCM does not provide any advisory service; the material published does not constitute advice or a recommendation for a transaction in any financial instrument. NCM accepts no responsibility for any use of the content presented and any consequences of that use. Anyone acting on the information provided does so at their own risk.