
- Contact Us:
-

-

-

-


Daily Market Updates
24 May 2023
USDJPY
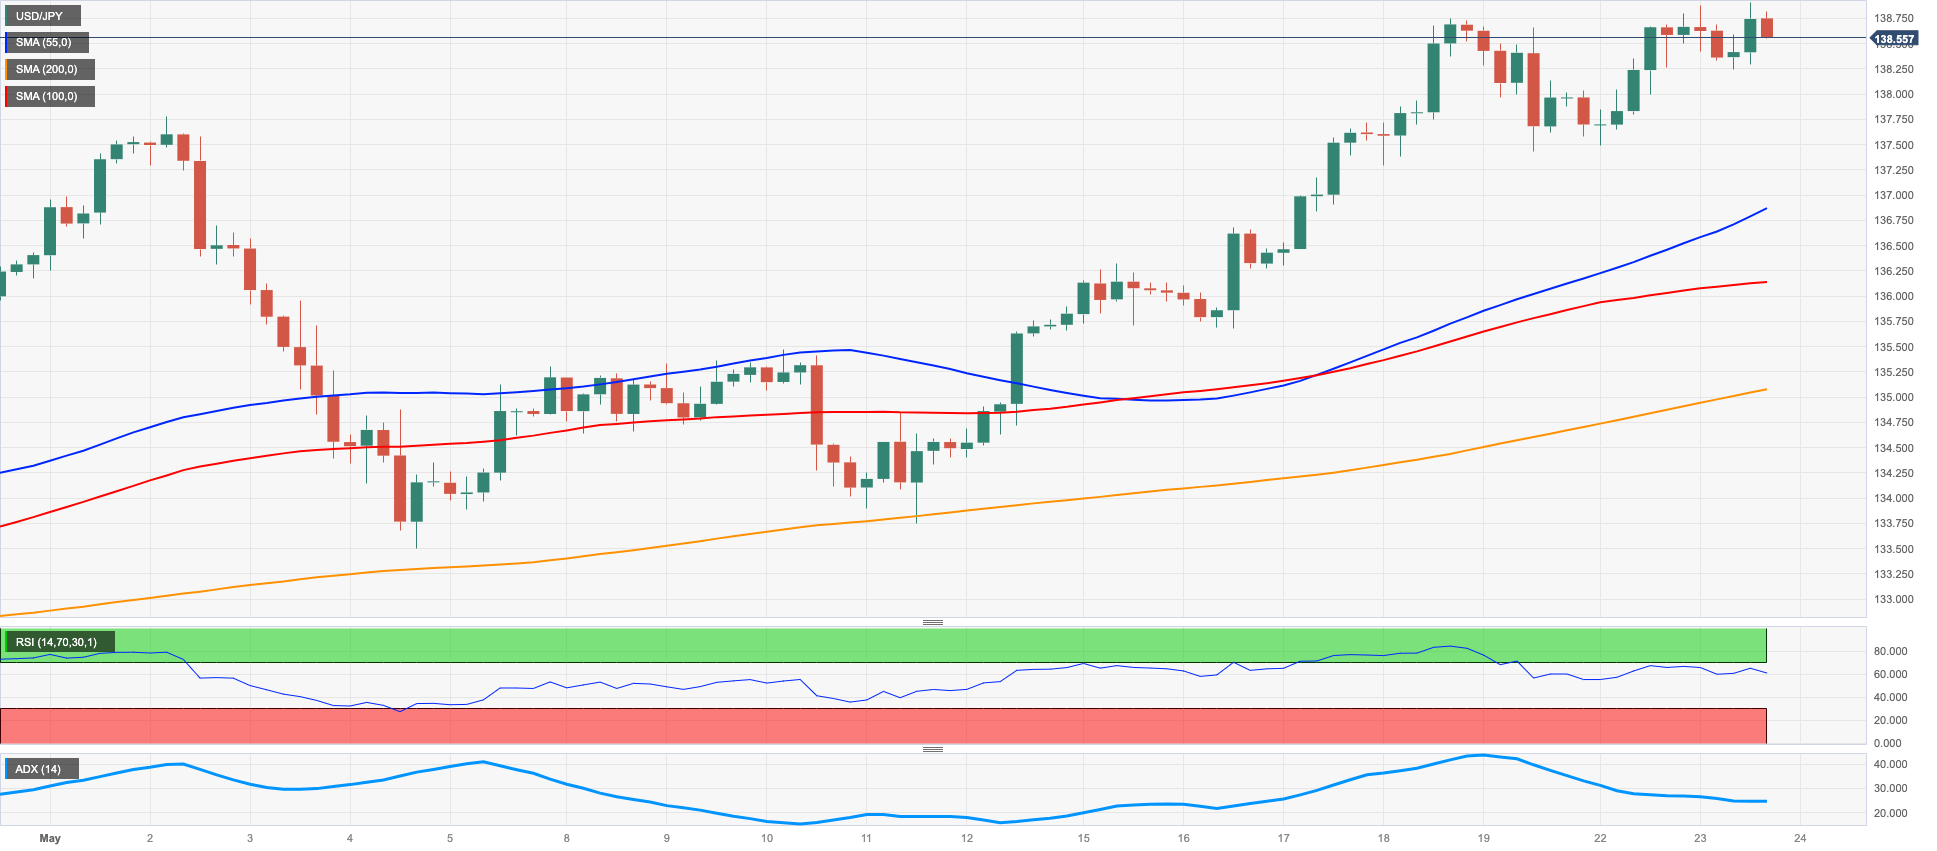
USD/JPY printed a new 2023 peak near 138.90 on Tuesday. That initial uptick, however, lost some traction afterwards and eventually left the pair to the mercy of increased volatility and ended the session near Monday’s closing levels.
The continuation of the move higher in the greenback and the relentless advance in US yields across the curve sustained the earlier bull run to the proximity of the 139.00 mark, while the better tone in the Japanese JGP 10-year yields seems to have lent some support to the yen.
In the Japanese docket, flash Judo Bank Services and Manufacturing PMIs came at 56.3 and 50.8, respectively, for the month of May.
The next resistance level for USD/JPY lies at the 2023 peak of 138.91 (May 23), with the potential for further upward movement. Should the pair continue to appreciate, it may retest the weekly highs of 139.89 (November 30, 2022) and 142.25 (November 21, 2022). On the flip side, the initial support level can be found at the important 200-day SMA at 137.15, ahead of the temporary 55-day and 100-day SMAs at 134.14 and 133.27 respectively. Moving lower, we encounter the weekly low of 133.01 (April 26), followed by minor support at 132.01 (April 13) and the April low of 130.62 (April 5). A deeper decline could lead to a revisit of the March low at 129.63 (March 24) and the February low at 128.08 (February 8), before approaching the 2023 low of 127.21 (January 16). It is worth noting that the daily RSI rose to the proximity of 66.
Resistance levels: 138.91 139.89 141.61 (4H chart)
Support levels: 137.42 135.64 134.93 (4H chart)
GBPUSD
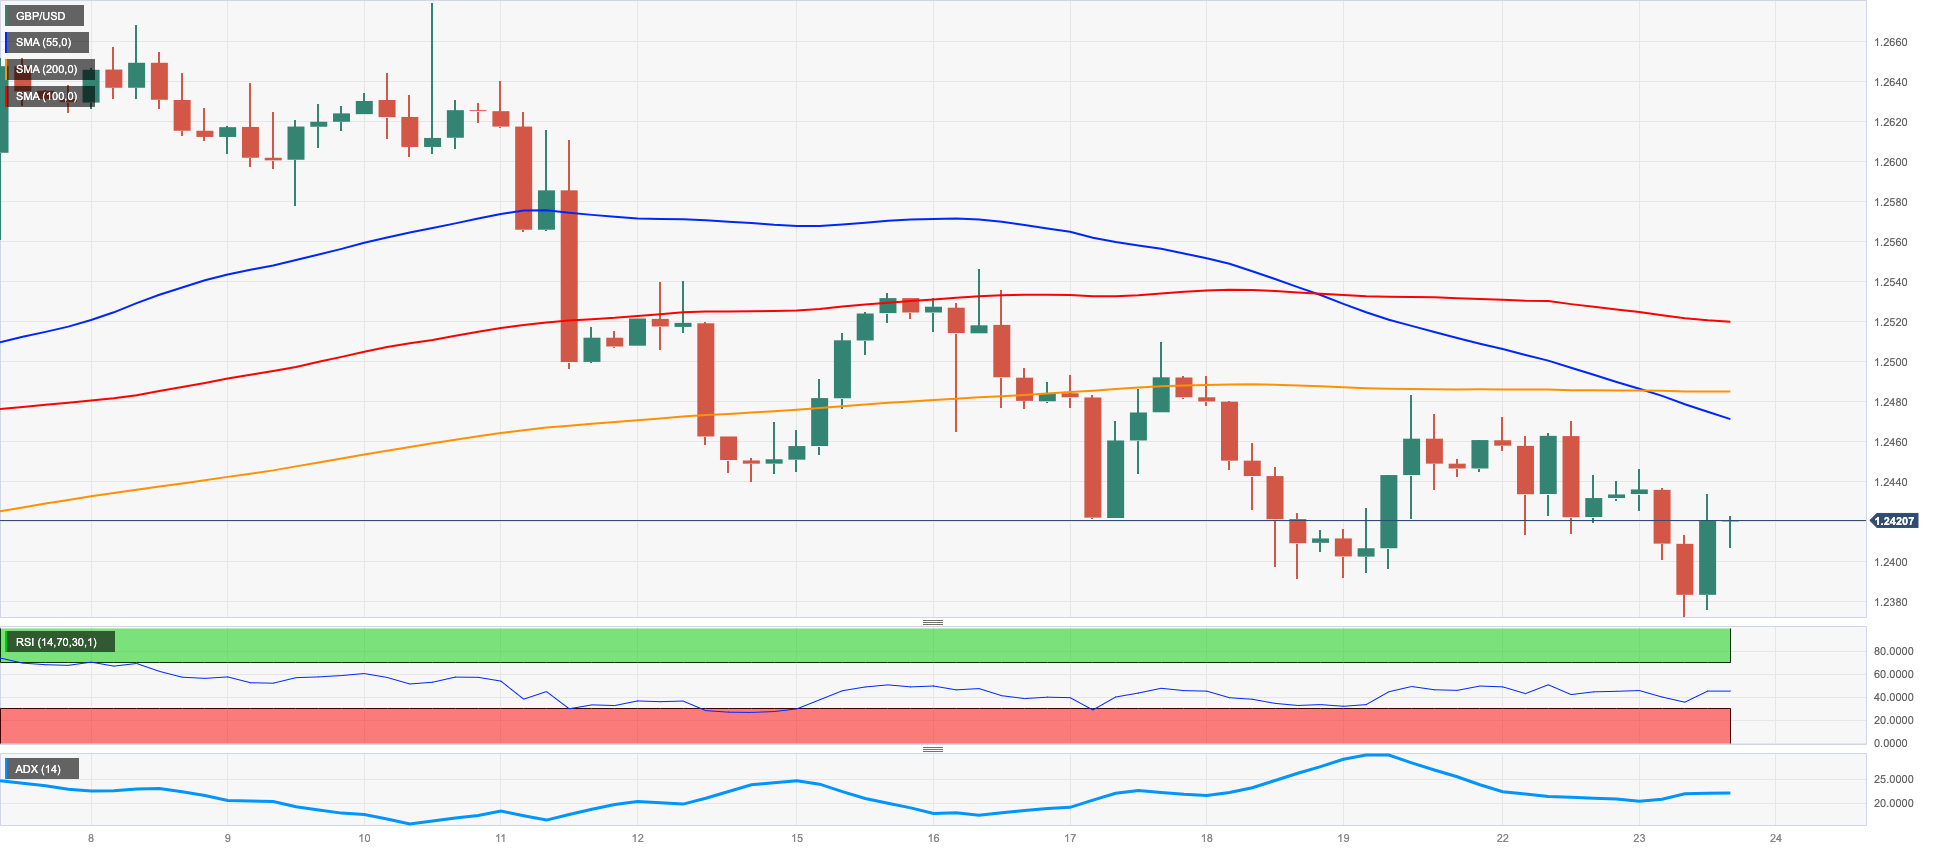
After bottoming out in new monthly lows near 1.2370, GBP/USD staged a marked comeback to the area beyond 1.2400 the figure on Tuesday, although it could not help ending the session with modest losses.
In fact, the intense bullish move in the greenback kept the British pound and the rest of the risk-associated assets under further pressure on Tuesday, always against the backdrop of omnipresent debt ceiling woes.
In the UK calendar, the flash Manufacturing and Services PMI showed a mild pullback in May vs. the previous month to 46.9 and 55.1, respectively.
Also from the docket, BoE Governor A. Bailey suggested that inflation has turned the corner and reiterated that the MPC will adjust the bank rate as required to bring inflation back to the bank’s target in a sustainable fashion in the medium term.
The GBP/USD pair is facing a possible vulnerability that could result in immediate support levels at the May low of 1.2372 (May 23) followed by the weekly low of 1.2344 (April 10) and the April low of 1.2274 (April 3), which is reinforced by the interim 100-day SMA (1.2276). Extra decline could see the crucial 200-day SMA at 1.1970 revisited prior to the 2023 low of 1.1802 (March 8). On the contrary, if the pair moves upward, the initial obstacle to overcome would be the 2023 high of 1.2679 (May 10). Buyers may also aim for the 200-week line SMA at 1.2864, seconded by the psychological level of 1.3000. The daily RSI dropped below the 46 yardstick.
Resistance levels: 1.2483 1.2510 1.2546 (4H chart)
Support levels: 1.2372 1.2352 1.2274 (4H chart)
AUDUSD
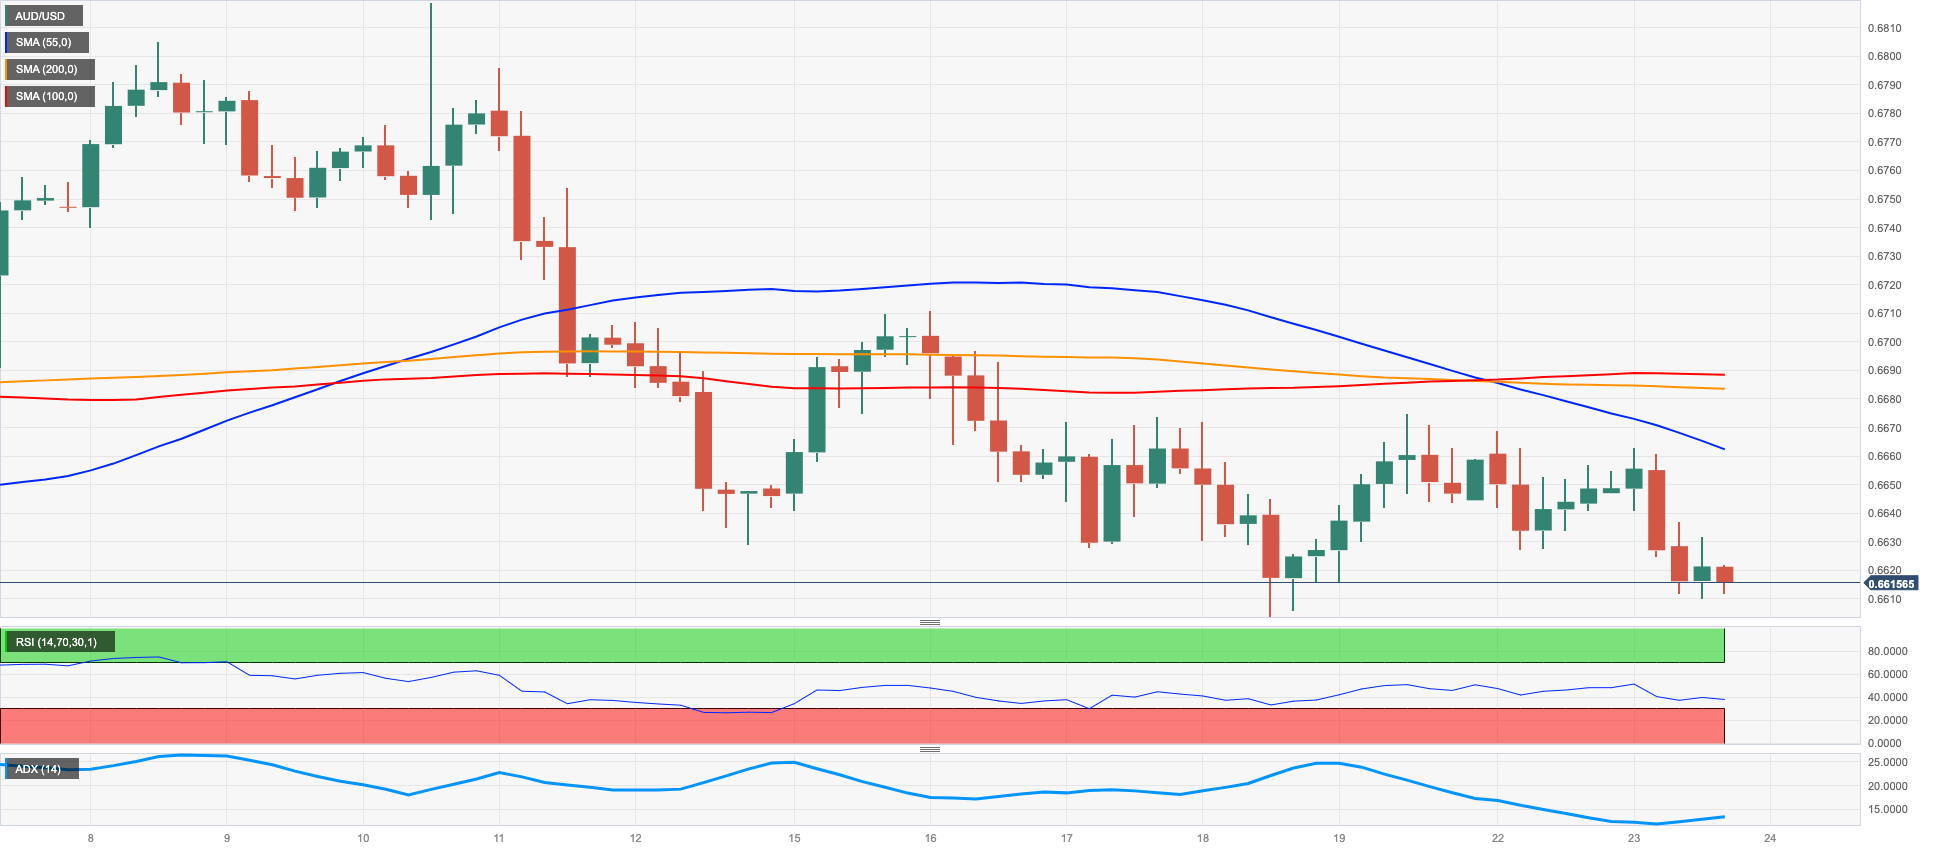
AUD/USD reversed the recent strength and resumed the downside on Tuesday, this time revisiting the key 0.6600 neighbourhood, where a solid contention zone emerges.
In fact, sellers forced the Aussie dollar to give away part of the recent gains amidst the resumption of the uptrend in the greenback, while persistent uncertainty around the US debt ceiling issue also weighed on the risk complex.
Extra weakness, in addition, came from the generalized bearish performance of the commodity universe.
In Oz, flash figures saw the Judo Bank Services PMI at 51.8 in May (from 53.7) and the Judo Bank Manufacturing PMI at 48.0 (unchanged).
AUD /USD faces immediate contention at the May low of 0.6604 (May 18) before the April low of 0.6573 (April 28), which seems to have been overtaken by the 2023 low of 0.6563 (March 10). In addition, the weekly lows at 0.6386 (November 10 2022) and the November 2022 low at 0.6272 (November 3) represent other potential support levels. On the upside, the next critical hurdle to overcome is the 200-day SMA at 0.6708 ahead of the May high of 0.6818 (May 10). If this area is cleared, the critical round level of 0.7000 becomes a conceivable target, alongside the weekly top of 0.7029 (February 14) and the 2023 peak at 0.7157 (February 2). The RSI on the daily chart grinded lower to the sub-43 zone.
Resistance levels: 0.6675 0.6709 0.6818 (4H chart)
Support levels: 0.6604 0.6573 0.6563 (4H chart)
GOLD
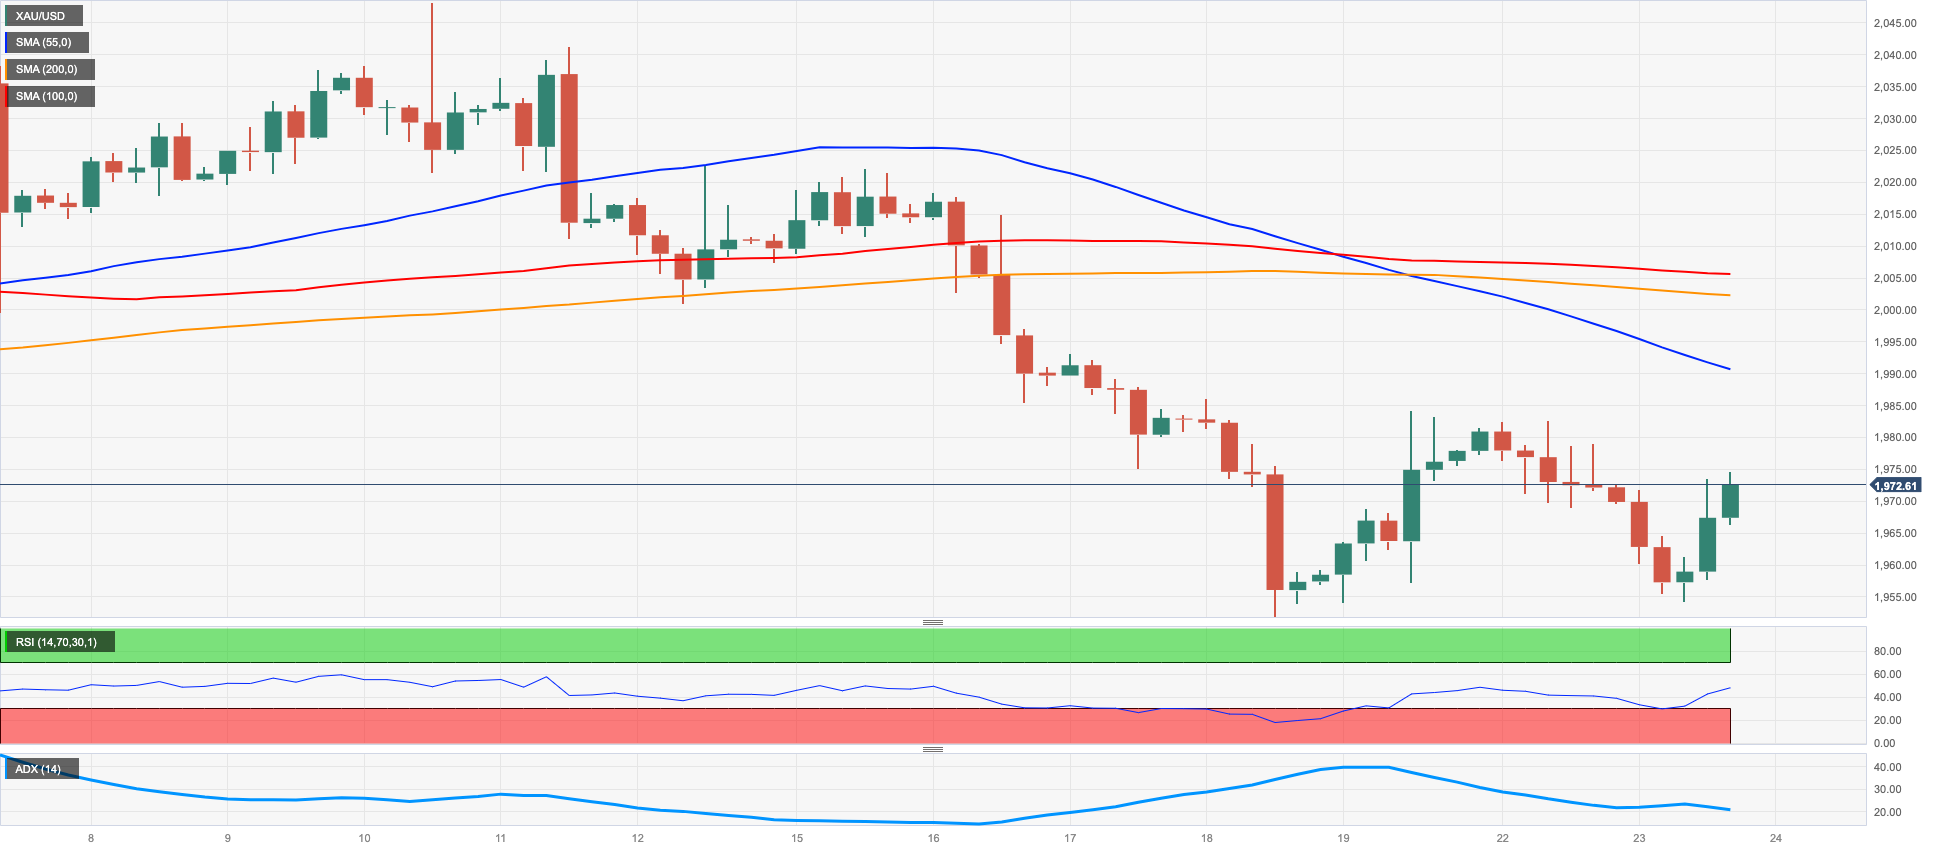
Gold prices managed to trim the earlier drop to the vicinity of the $1950 mark per ounce troy and retake the $1970 region – and the positive territory - on Tuesday.
In fact, the precious metal printed humble gains despite the strong resumption of the upside bias in the greenback, which was in turn helped by the still unabated rally in US yields across the curve.
In the meantime, debt ceiling concerns remain a key driver of investors’ sentiment in the very near term in combination with expectations of further rate hikes/impasse by the Federal Reserve in June.
On account of selling pressure fortifying, bullion could fall back to the May low of $1952 (May 18), which seems upheld by the April low of $1949 (April 3) and precedes the 100-day SMA at $1931. South from here arises the key 200-day SMA at $1827, all before the 2021 low of $1804 (February 28). If it climbs, the immediate u-barrier emerges at the key $2000 mark. Further up, there are no resistance levels of note until the 2023 top of $2067 (May 4), approved by the March 2022 high of $2070 (March 8) and the unmatched zenith of $2075 (August 7, 2020).
Resistance levels: $1984 $2003 $2022 (4H chart)
Support levels: $1952 $1934 $1885 (4H chart)
CRUDE WTI
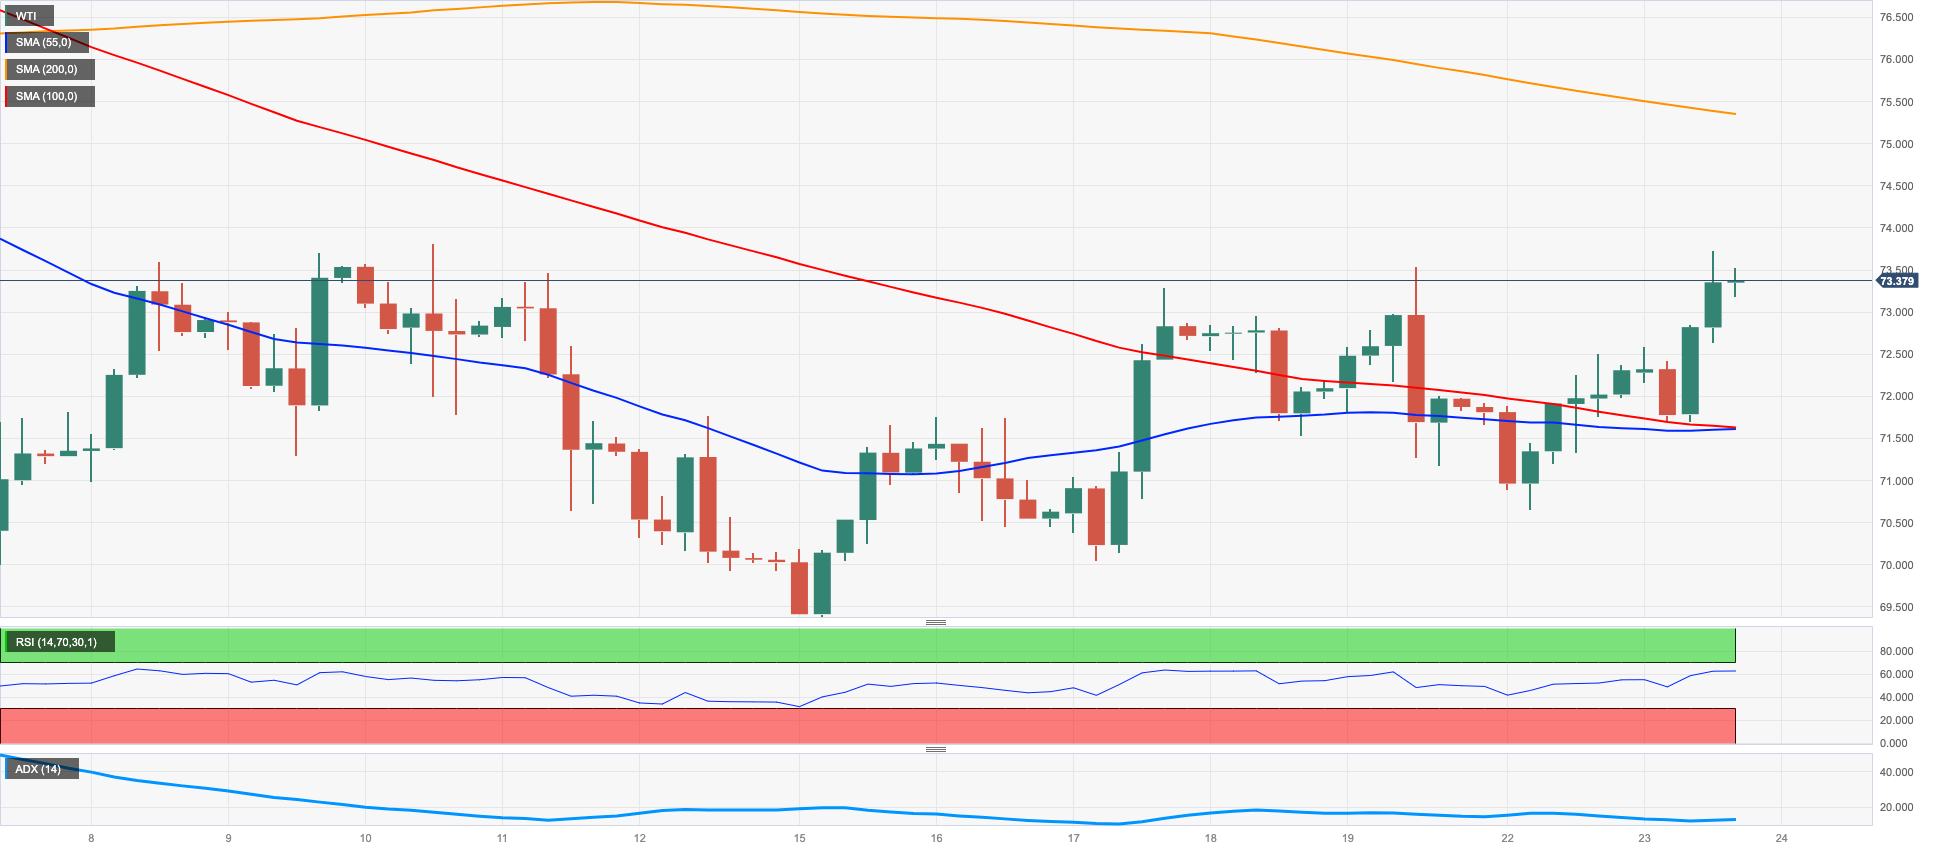
Prices of the American reference for sweet light crude oil advanced to multi-session highs and flirted with the key resistance area near the $74.00 mark per barrel on Tuesday.
The marked bounce in costs of the commodity came after another uptick in prices of gasoline futures, which rose to levels last seen in mid-April beyond the $2.70 mark. It is worth noting that these prices have already gained around 20% since their monthly lows of around $2.25 (May 4).
In addition, the remarks made by the energy minister of Saudi Arabia appear to have exacerbated the tightness of the crude oil market at the moment by warning short-sellers, a message that may suggest that OPEC+ could reduce oil output again in the near term.
Later on Tuesday, the API will publish its weekly report on US crude oil inventories for the week ending May 19 ahead of the DoE’s report on Wednesday.
The WTI price trend has exhibited considerable volatility thus far. Further gains are expected to meet the next obstacle at the weekly high of $79.14 (April 24), followed by the key level of $80.00 and the crucial 200-day SMA at $80.14. Furthermore, subsequent resistance levels can be identified, such as the 2023 peak at $83.49 (April 12) and the November 2022 top at $93.73 (November 7). In the event that sellers regain dominance in the market, it is important to monitor the next significant support levels. These include the 2023 low of $63.61 (May 4), followed by the December 2021 low of $62.46 (December 2), and the critical level of $60.00 per barrel.
Resistance levels: $73.72 $75.53 $76.89 (4H chart)
Support levels: $71.85 $70.01 $69.38 (4H chart)
GER40
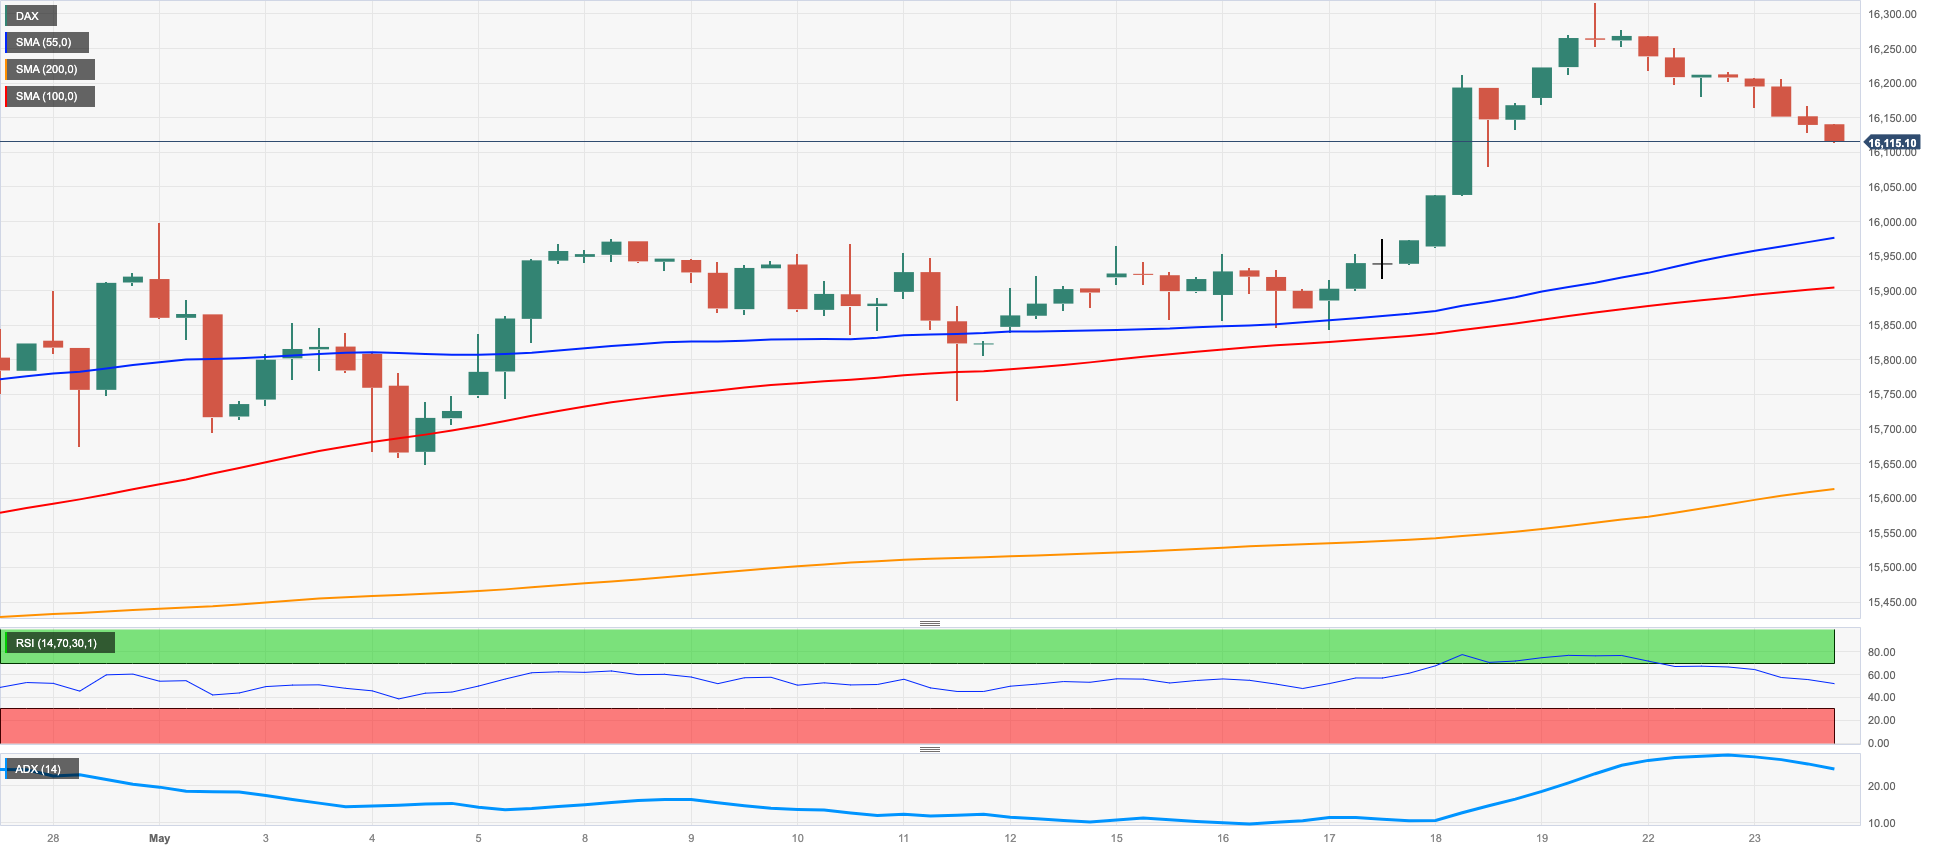
German equities measured by the DAX40 added to the disheartening start of the week and dropped to 3-day lows near the 16100 region on Tuesday.
Indeed, persevering uncertainty around the US debt ceiling negotiations weighed on investors in the old continent, while mixed results from preliminary PMIs in the Manufacturing and Services sector for the month of May also collaborated with the prevailing sour mood.
In the money market, the 10-year Bund yields advanced marginally after two daily pullbacks in a row and managed well to keep the trade in the upper end of the range, near multi-week tops.
On May 19, the DAX40 marked a new all-time high at 16331, but immediate support was provided by the May low of 15662 (May 4), ahead of the temporary 55-day SMA at 15626 and the April low of 15482 (April 5). Further down is the interim 100-day SMA at 15398 followed by minor support levels such as 14809 (March 24) and 14458 (March 20). In addition, the critical 200-day SMA at 14395 could play an important role in a more significant retracement. The everyday RSI deflated to the vicinity of 62.
Best Performers: Vonovia, Qiagen, Porsche
Worst Performers: Rheinmetall AG, Zalando SE, MTU Aero
Resistance levels: 16331 17000? 18000? (4H chart)
Support levels: 15944 15754 15662 (4H chart)
NASDAQ
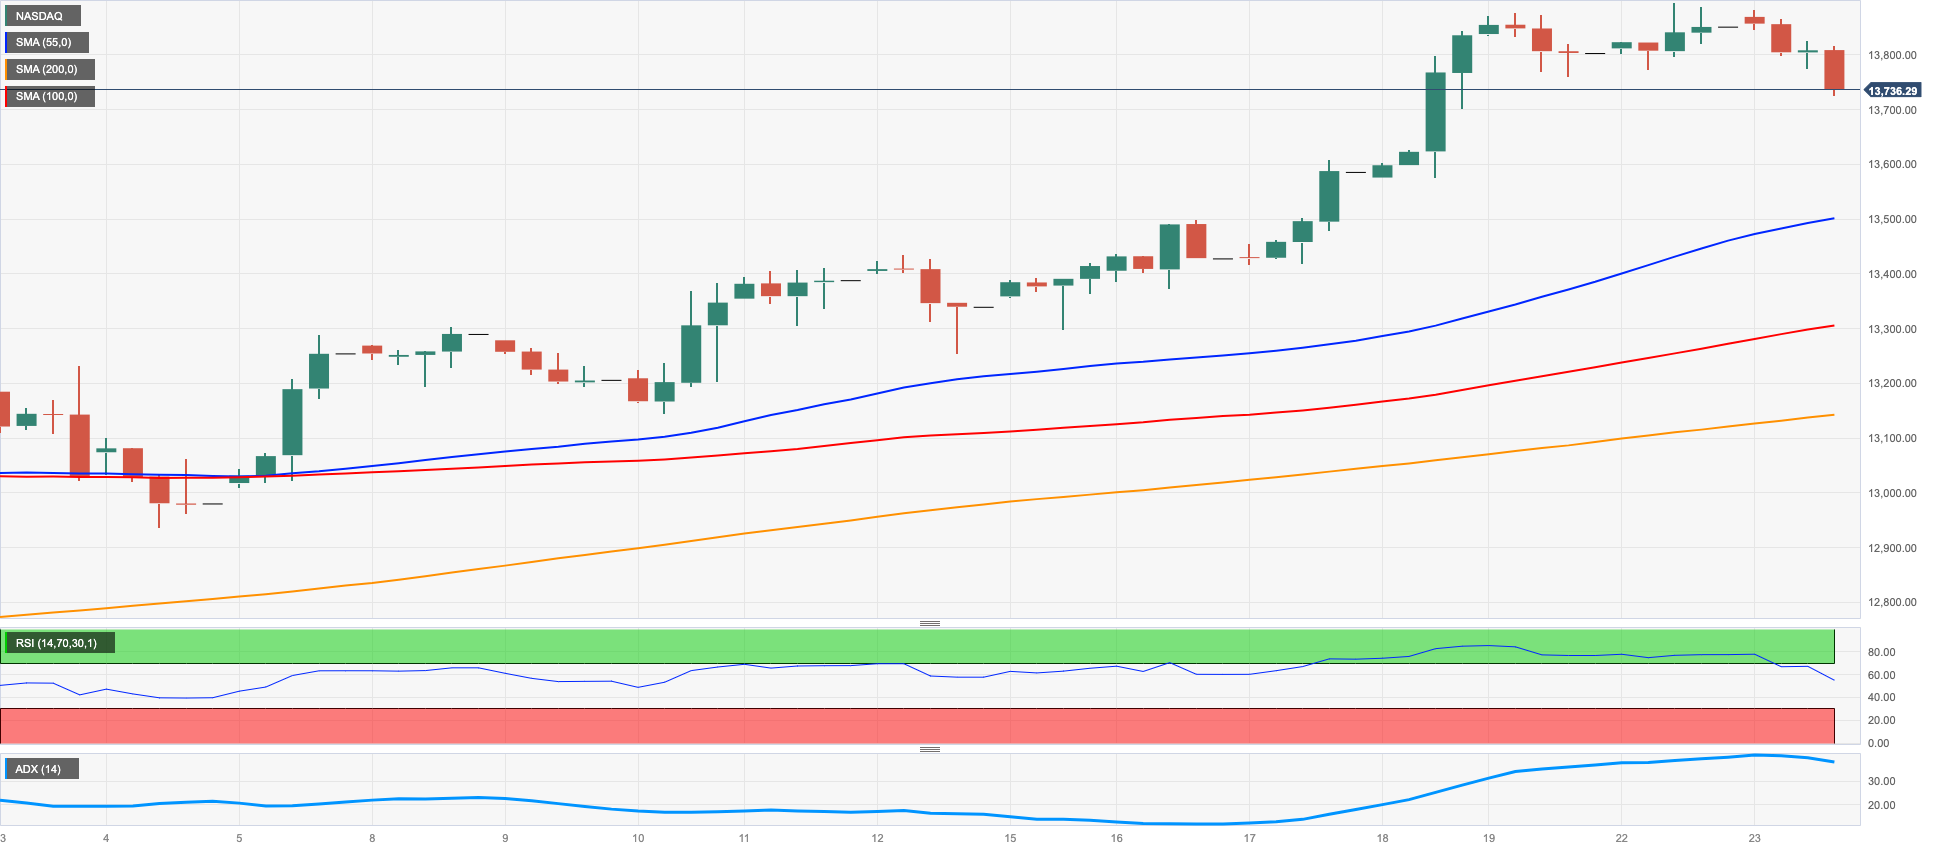
While market participants continued to wait for fresh clues from upcoming meetings, Nasdaq 100-gauged US tech stocks remained far from immune to debt ceiling concerns and followed their US peers south on Tuesday.
Additionally, the risk complex's mood was further harmed by the strong tone of the greenback and the relentless march north in US yields across the curve, ultimately dragging the index to 3-day lows near 13700.
On May 22, the Nasdaq 100 reached a new high for 2023, hitting 13893. If this upward trend continues, the next target could be the March 2022 top of 15265 (March 29). However, if the trend reverses and the index begins to fall, the May low of 12938 (May 4) is the initial support level. This level is supported by the provisional 55-day SMA at 12957 and further backed up by the April low of 12724 (April 25). Extra losses could see the index challenge the 200-day SMA at 12125, followed by the March low of 11695 (March 13) and the weekly lows at 11550 (January 25) and 11251 (January 19). A deeper drop could threaten the 2023 low at 10696 (January 6). On the daily chart, the RSI deflated below the 68 yardstick.
Top Gainers: Moderna, Broadcom, Walgreen Boots
Top Losers: Zoom Video, IDEXX Labs, Align
Resistance levels: 13893 14277 15161 (4H chart)
Support levels: 13242 12938 12724 (4H chart)
DOW JONES
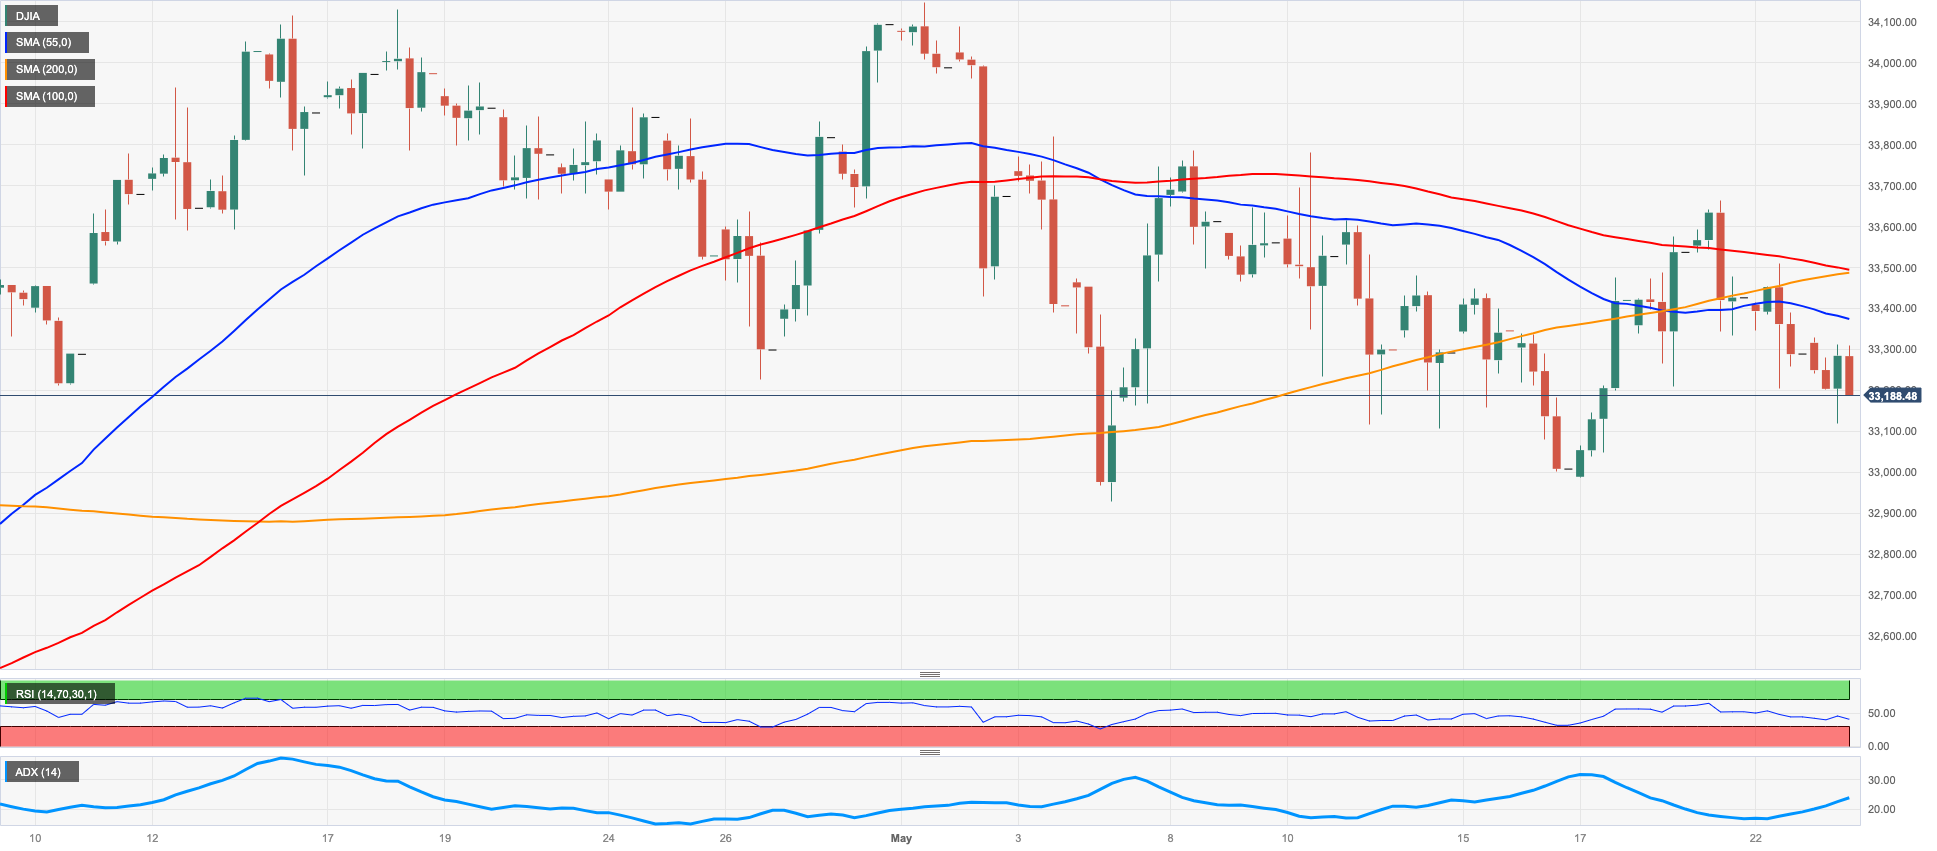
Determined anxiety around the US debt ceiling talks kept on burdening investors’ opinion and kept any endeavor from bulls to recover control of the market discouraged on Tuesday.
In fact, market participants appeared prudent in light of the Democrats' and Republicans' resumption of negotiations in the following hours, all of which followed the constructive tone from Monday's meeting between House Speaker McCarthy and President Biden.
On the whole, the Dow Jones retreated 0.09% to 33255, the S&P500 dropped 0.48% to 4172, and the tech-benchmark Nasdaq Composite deflated 0.58% to 12647.
The May low of 32937 (May 4) is proving to be an immediate point of attack for the Dow Jones if losses accelerate in the near term. Further down, the important 200-day SMA is at 32776, before the 2023 low at 31429 (15 March) and the 2022 low at 28660 (13 October). On the upside, the May top at 34257 (May 1) is the first possible target, followed by the 2023 peak at 34342 (January 13) and the December 2022 high at 34712 (December 13). If the index exceeds this level, it could accelerate towards the April 2022 top at 35492 (April 21). The step-by-step RSI receded to the vicinity of 46.
Top Performers: Chevron, Verizon, Walgreen Boots
Worst Performers: Visa A, Intel, Microsoft
Resistance levels: 33652 33772 34257 (4H chart)
Support levels: 33006 32937 31805 (4H chart)
MACROECONOMIC EVENTS

All Information & Updates provided by:

All information relating to the financial markets available on this page has been prepared and issued by FXStreet (Forexstreet SL, Spain, Reg: B62498233) on the basis of publicly available information and all information believed to be reliable and does not conflict with Kuwaiti local laws, and all necessary care has been taken to before the company to ensure that the facts mentioned are correct from the source.
NCM Investment nor any of its directors or employees shall in any way be held responsible for the contents of this news, and the information contained on this page is intended only to provide clients with publicly available information and should not be construed as investment advice, report or analysis and/or constitute an offer or invitation to buy or sell financial instruments of any kind.
RISK WARNING: Forex and CFDs are highly risky leveraged products, as losses can exceed deposits. Please ensure you understand all the risks and take independent advice if necessary. NCM will segregate the clients based on the criteria of the regulator and its bylaws. NCM does not provide any advisory service; the material published does not constitute advice or a recommendation for a transaction in any financial instrument. NCM accepts no responsibility for any use of the content presented and any consequences of that use. Anyone acting on the information provided does so at their own risk.